Part 2: Price Action Breakdown - Advance ElementsIn the first part, we discussed the components of the price action theory. We covered value area, control line, and excess price with examples, setups & guidelines (with my own observations.) Now, in this idea, we are going to cover the following topics:
No trading zone
Initiative & responsive trading
Shifting of the value area
Bullish Value area
Bearish value area
Extention of the value area
Combining all the pieces
I request all of you to visit our first part if you have not read it yet.
Check out the following demo chart, and try to mention each component by yourself:
Now, you can check the following chart, and see if you have denoted correctly or noted:
1) No trading zone:
No trading zone/activities is the area where trading is not happening. It shows the strength of buyers in the lower band and the strength of the sellers in the upper boundary. Its shows who is controlling, who will be controlling, and who have lost the opportunity.
What does it mean?
🔹If the length of the no-trading zone is wide at the lower band, it shows that buyers are controlling the movement and sellers are not able to form trading activities.
🔹If the length of the no-trading zone is wide at the upper band, it shows that sellers are controlling the movement and buyers are not able to form trading activities.
Observing the given formation that shows a sideways value area is enough to understand the whole story. There were actually three no-trading zones in the value area: two on the lower band and one on the upper band.
The first NTZ(No-trading zone) on the lower band was the signal of the movement controlled by buyers. NTZ-2 was the widest of the value area, where sellers snatched the control from buyers and started outnumbering the buyers. NTZ-3 was the last no-trading zone where the buyers were on the controlled buy and couldn't give a response to the sellers' initiative move. The excess was the last price point from sellers that started the supply pressure.
2) Initiative & responsive trading
As we discussed earlier, price movements are the result of the interaction between supply and demand. Buyer(demand) and seller's(supply) intuition are the main components of the price.
Value area from where buyers and sellers are satisfied with the current prices. Neither buyers want to increase, nor the seller is interested in low prices at least for some duration. It's called equilibrium between buyers and sellers.
What if it's enough?
# Now buyers don't want to keep the prices as it's too low for them. So, the buyers will make an initiative to break the upper band of the value area. It is called "initiative" by buyers.
# Sellers have to stop them from going out of the value area by making excess, which is called "response" by sellers. Anyone, either buyers or sellers, who are not satisfied can make an initiative. However, the opposite party has to respond to their initiative and settle into equilibrium again.
Case 1:
- The movement can only reach equilibrium by responding to each initiative. If a failure occurs, it signals evidence of a big move in the direction of the initiative. As per the chart, whenever buyers have made an initiative to move outside of the value area, sellers have responded with supply pressure and vice versa.
Case 2:
- Buyers have made an initiative, but sellers couldn't hold back the buyers' pressure and ended up losing movement. Here, we can say that the buyers have given a breakout of the value area, and the sellers' response was a failure.
3) Shifting of the value area
- Traders don't have to be upset after the breakout of the value area. Supply and demand will balance and unbalance again, and traders will get an opportunity to trade according to the theory. We all know of the tenet of the dow theory that "price tends to trend ." Value area also shifts its value after the breakout/breakdown, often in the direction of the trend.
Uptrend: The price was in an uptrend. After the breakout of the first value area, it has formed the second, and so on.
Downtrend: The price was in a downtrend. After the breakdown of the first value area, it has formed the second, and so on.
Chartpatterntrading

Ascending Triangle on AUD/CAD @ H4This ascending triangle pattern has formed on the 4-hour chart of the AUD/CAD currency pair. It can be used as a short-term bullish breakout setup. The triangle's borders are marked with the yellow lines. My potential entry is marked with the cyan line (0.89235). My potential take-profit level is marked with the green line (0.90537). The stop-loss is to be set to the triangle's bottom point at 0.87643. Bearish breakouts from this continuation formation should be ignored.

TonCoin is ready for the next climb
When others correct and Toncoin will start to move. Climbing up to the price of 3.9$ ...
Irrespective of the emerging pattern, with this routine and clean chart and high potential, "TON" seems to present another climb to his fans.

BCHUSD Nearing Breakout Of Ascending Triangle PatternBCHUSD / Bitcoin Cash about to breakout of this ascending triangle chart pattern. Higher lows are forming with multiple retests horizontal resistance line. This is bullish and expect a move higher as soon as it closes above the horizontal resistance line around $250.00

Bullish Flag Pattern Reversal in ICICIPRULIICICI PRUDUNTUAL LIFE INSURANCE LTD
Key highlights: 💡⚡
📊On 1Day Time Frame Stock Showing Reversal of Bullish Flag Pattern.
📊 It can give movement upto the Reversal target of Above 598+.
📊There have chances of Breakout of Resistance level too.
📊 After Breakout of Resistance level this stock can gives strong upside rally upto above 785+.
📊 Can Go Short in this stock by placing stop loss below 472- or last swing Low.

#NIFTY Intraday Support and Resistance Levels - 06/11/2023Nifty will be gap up opening in today's session. After opening nifty sustain above 19250 level and then possible upside rally up to 19350 & This rally can extend another 100-120 points if market gives breakout of 19370 level in today's session. in case nifty trades below 19210 level then the downside target can go up to the 19090 level.

[INTRADAY] #BANKNIFTY PE & CE Levels(06/11/2023) Today will be gap up opening in BANKNIFTY . After opening if banknifty sustain above 43550 level then possible upside rally of 400-500 points upto 43950 Level. And this rally can extend for another 400 points if it gives breakout of 44050 level. Any Major downside only expected in case banknifty starts trading below 43450 level.

AUDUSD Downhill ContinuationWith NFP on Friday 06/11/2023 Bears are starting to be in control of the market, already broke the support level of ABCD Pattern and retested it. With the sellers pushing the market down we looking for short seller before NFP announcement.

Ascending Channel on EUR/USD @ D1This chart shows an ascending channel pattern that has formed on the daily timeframe of EUR/USD following a long-term downtrend that had been active since July. It can now be used for a bearish breakout trade setup. The pattern's borders are marked with the yellow lines. The potential entry level is at the cyan line. The potential take-profit level is at the green line. The position of both lines is calculated based on the channel's width. The stop-loss isn't shown on the chart. It is to be set to the high of the breakout candle (or to the high of the preceding candle if the breakout one is trading mostly outside the channel).

AUDCAD made a Bullish breakout, 400 pips long setupAUDCAD
price made a bullish breakout of the narrow structure , if price continues to holds above the trendline, price will rise towards next resistance
Trade Wisely
*The content on this analysis is subject to change at any time without notice, and is provided for the sole purpose of assisting traders to make independent investment decisions.

AUD/CAD ↗️ Long Trade Setup ↗️Hello Everyone 🙋🏽♂️
🔴 0.87555
🟢 0.90485
We are not responsible of any losses for anyone, our trades are profitable more for long terms and we take losses as everyone,
manage your lot size as well and your SL and TP and my opinion is 0.01 lot for each 500 $.
Don't forget to hit the like bottom and write a comment to support us.
Follow us for more 🙋🏻♂️
Best Regard / EMA Trading .
Disclaimer:
----------------
It's not a financial advise, As everyone we take losses sometime but for long term trading we are profitable traders, so manage your account well with SL and TP and your lot size to keep your account safe and stay in the market .

AUDCHF broke above triangle, to continue bullishAUDCHF
price broke above triangle structure. after a correction if price continues to hold above support I expect the price to move higher towards the next resistance..
Trade Wisely
*The content on this analysis is subject to change at any time without notice, and is provided for the sole purpose of assisting traders to make independent investment decisions.

Descending Channel pattern breakout in IGLINDRAPRASTHA GAS LTD
Key highlights: 💡⚡
✅On 1Hour Time Frame Stock Showing Breakout of Descending ChannelPattern.
✅Strong Bullish Candlestick Form on this timeframe.
✅It can give movement up to the Breakout target of 392+.
✅Can Go Long in this stock by placing a stop loss below 380-.

[INTRADAY] #BANKNIFTY PE & CE Levels(01/11/2023) Today will be gap down opening in BANKNIFTY . After opening if banknifty start trading below 42950 level then possible downside rally of 400-500 points upto 42550 Level. And this rally can extend for another 400 points if it gives breakdown of 42450 level. Any Major upside only expected in case banknifty starts trading above 43050 level.

Ascending Triangle Pattern On NAKAUSDNakamoto games / NAKAUSD on the 3-hour timeframe forming an ascending triangle pattern. NAKA is already in an uptrend so a breakout is more likely to the upside. A close above $0.95 will confirm the breakout. Target based on vertical triangle distance is around $1.02 or 8.5%.

BluetonaFX - EURUSD Bear Flag Pattern SHORT IdeaHi Traders!
There is a bear flag pattern on the EURUSD 1D chart, and if we get a break of the flag channel, there is potential for continuation towards the yearly low at 1.04485.
Price Action 📊
The market is currently in the flag channel and has failed to break back above the 20 EMA, which is a bearish signal. We are looking for a momentum break and a close below the flag channel to potentially target 1.04485 for a re-test of the level.
Fundamental Analysis 📰
The US economy expanded at a 4.9% annual rate from July through September as Americans defied higher prices and rising interest rates. Economists have also said the US economy expanded last quarter at the fastest pace in nearly two years—more than twice the 2.1% annual rate of the previous quarter.
Support 📉
1.05352: PREVIOUS DAY'S LOW
1.04485: YEARLY LOW
Resistance 📈
1.05971: PREVIOUS DAY'S HIGH
Risk ⚠️
No more than 2% of your capital.
Reward 💰
At least 4% of your capital.
Please make sure to click on the like/boost button 🚀 as your support greatly helps.
Trade safely and responsibly.
BluetonaFX

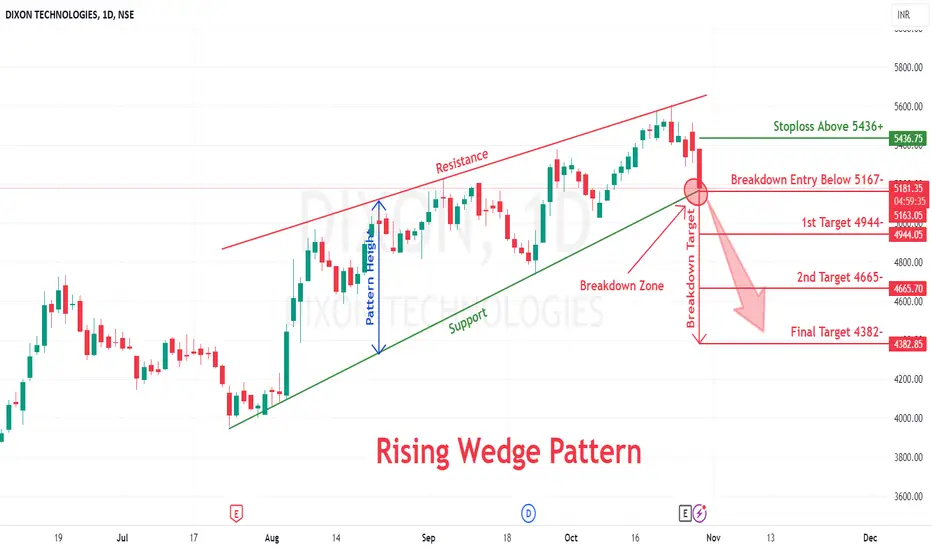
Rising Wedge breakdown in DIXONDIXON TECHNOLOGIES LTD
Key highlights: 💡⚡
✅On 1Day Time Frame Stock Showing Breakdown of Rising Wedge Pattern .
✅ Strong bearish Candlestick Form on this timeframe.
✅It can give movement up to the Breakdown target of 4382-.
✅Can Go short in this stock by placing a stop loss above 5436+.
Bullish Wolf Wave Pattern On SeedifyBullish wolf wave pattern / falling wedge forming on Seedify / SFUNDUSDT.

Decoding Market Patterns:10 Essential Price Patterns Every TradeIn the intricate world of trading, price patterns are the footprints left by market sentiment. Understanding these patterns is like deciphering a complex code, revealing insights into potential market movements. Today we will explore 10 essential price patterns every trader should recognize. Each pattern is a chapter in the dynamic story of market behavior, offering opportunities to identify trends, reversals, and strategic entry or exit points.
1. Bull Flag: The Flagbearer of Continuation
A Bull Flag is a continuation pattern, often seen in strong uptrends. It resembles a flagpole (the initial price spike) followed by a rectangular flag (consolidation phase). When the price breaks above the upper boundary of the flag, it signals a potential continuation of the uptrend.
2. Bear Flag: The Bearish Counterpart
The Bear Flag is the opposite of the Bull Flag. It appears in downtrends, with a flagpole representing the initial price drop followed by a consolidation period. When the price breaches the lower boundary of the flag, it indicates a potential continuation of the downtrend.
3. Head and Shoulders: The Classic Trend Reversal
The Head and Shoulders pattern is a powerful reversal indicator. It consists of three peaks – the central peak (head) is higher than the surrounding peaks (shoulders). When the price drops below the neckline (a line drawn through the lowest points of the shoulders), it suggests a potential trend reversal from bullish to bearish.
4. Inverse Head and Shoulders: The Bullish Resurgence
The Inverse Head and Shoulders pattern is the bullish counterpart of the Head and Shoulders. It occurs after a downtrend and indicates a potential reversal to an uptrend. The pattern consists of three troughs – the central trough (head) is lower than the surrounding troughs (shoulders). When the price rises above the neckline, it signals a potential shift from bearish to bullish.
The cool thing about chat patterns is that they are everywhere. You often see many different chart patterns on a singular chart, or smaller patterns that are a part of a larger pattern. The tricky part is finding them and appropriately identifying them.
5. Double Top: The Bearish Reversal Duo
A Double Top pattern occurs after an uptrend and signals a potential reversal. It consists of two peaks at nearly the same price level, indicating a struggle to push the price higher. When the price falls below the trough between the peaks, it suggests a possible shift from bullish to bearish.
6. Double Bottom: The Bullish Reversal Duo
The Double Bottom is the bullish counterpart of the Double Top. It occurs after a downtrend and signals a potential reversal to an uptrend. It consists of two troughs at nearly the same price level, indicating a struggle to push the price lower. When the price rises above the peak between the troughs, it suggests a potential shift from bearish to bullish.
7. Rising Wedge: The Rising Price Constrictor
A Rising Wedge is a bearish continuation or reversal pattern. It can form during a downtrend or in an uptrend where buying pressure becomes exhausted. The wedge is characterized by converging trend lines that slope upward. While the price may make higher highs and higher lows, the pattern tightens, indicating weakening momentum. When the price breaks below the lower trendline, it suggests a potential continuation of the downtrend or reversal of an uptrend.
Rising Wedge Reversal Example:
Rising Wedge Continuation Example:
8. Falling Wedge: The Falling Price Constrictor
The Falling Wedge is the bullish counterpart of the Rising Wedge. It forms during an uptrend or a downtrend, characterized by converging trend lines that slope downward. While the price may make lower highs and lower lows, the pattern tightens, indicating weakening selling pressure. When the price breaks above the upper trendline, it suggests a potential continuation of the uptrend.
Falling Wedge Continuation Example:
Falling Wedge Reversal Example:
9. Symmetrical Triangle: The Balance of Bulls and Bears
A Symmetrical Triangle is a neutral pattern that forms during a trend, indicating a period of consolidation. It is characterized by converging trend lines that slope in opposite directions. When the price breaks above the upper trendline, it signals a potential bullish move, and when it breaks below the lower trendline, it signals a potential bearish move.
10. Pennant: The Brief Consolidation Pause
A Pennant is a continuation pattern that forms after a strong price movement. It resembles a small symmetrical triangle, indicating a brief consolidation before the previous trend resumes. When the price breaks above the upper boundary, it suggests a potential bullish continuation, and when it breaks below the lower boundary, it suggests a potential bearish continuation.
Important Thing To Consider:
Price patterns are a tool that if practiced and executed properly can be a great asset for any trader. There are a few things that all traders should keep in mind when using price patterns to make trading decisions.
Context is critical: Price patterns don't exist in isolation; they occur within the context of larger market trends. It's essential to consider the prevailing market conditions, including the overall trend (bullish, bearish, or sideways), volume trends, and recent price action.
Confirmation is Key: While recognizing a price pattern is an important skill, relying solely on its formation might lead to premature or false trades. Traders should always wait for confirmation signals before taking action. Confirmation can come in the form of a price breakout above a pattern's resistance level, a significant increase in trading volume confirming the pattern's direction, or additional technical indicators aligning with the pattern's signal. Waiting for confirmation helps traders filter out false signals, reducing the risk of entering trades based solely on pattern
Risk management is paramount: No pattern, regardless of its historical accuracy, guarantees a profitable trade. Traders must always implement proper risk management strategies, including setting stop-loss orders and defining acceptable levels of risk per trade as a percentage of their trading capital. Risk management ensures that even if a trade based on a price pattern fails to materialize as expected, the impact on the trader's overall portfolio remains manageable.
Practice, practice, practice: Identifying price patterns is a skill that improves with practice and experience. Traders should dedicate time to studying historical charts, both in live markets and during backtesting. Regularly practicing pattern charting enhances the ability to spot patterns quickly and accurately. TradingView offers a great set of tools to help anyone get started by offering a full line of automated pattern recognition indicators for educational and research use. Utilizing these automated pattern recognition indicators is a great way to visualize patterns in the real world as patterns are often less clean than textbook examples.
Recognizing these price patterns equips traders with a valuable skill set for navigating a dynamic market. However, it's vital to remember that patterns, like pieces of a puzzle, offer meaningful insights when combined with other indicators and thorough analysis. No single pattern guarantees profits, and each should be evaluated within the context of the broader market conditions. By integrating pattern recognition into a holistic trading strategy, traders can unlock the door to more informed, confident, and strategic trading decisions. Happy trading!
Ben with LeafAlgo

CRV/USDT 1-Day TF: Bullish Momentum ResurfacesBINANCE:CRVUSDT
CRV/USDT has recently shown renewed bullish momentum on the 1-day timeframe. This suggests that market sentiment is shifting, with bulls gaining control.
It is important to monitor this development closely, as it may present a favorable opportunity for traders and investors.
Traders who are bullish on CRV/USDT may want to consider taking a long position with a stop loss below the recent swing low.
Risk Management
It is important to note that all investments carry risk, and there is no guarantee of profit. It is important to do your own research before making any investment decisions, and to risk only what you can afford to lose.
Disclaimer: This is not financial advice.

[INTRADAY] #BANKNIFTY PE & CE Levels(26/10/2023) Today will be gap down opening in BANKNIFTY . After opening if banknifty start trading below 42950 level then possible downside rally of 400-500 points upto 42550 Level. And this rally can extend for another 400 points if it gives breakdown of 42450 level. Any Major upside only expected in case banknifty starts trading above 43050 level.

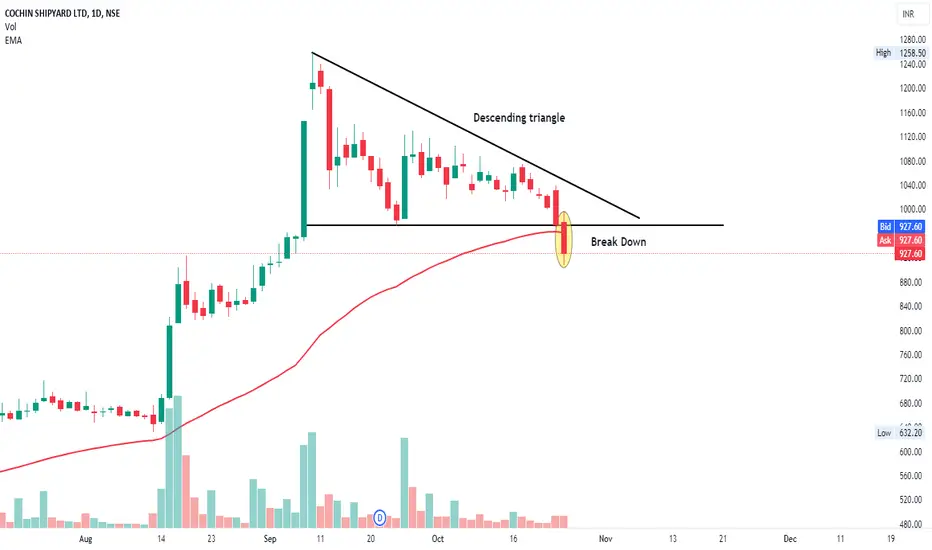
COCHINSHIP BREAK DOWNCOCHINSHIP BREAK DOWN
1. Descending triangle
2. Support Breakout
3.Below The 50EMA
TV18 BROADCAST breakodownTV18 BROADCAST breakodown
1. Descending Triange
2. Volume Buildup
3.Neck brakdown
