TITAN ' s Key Point | Breakout | Swing.This is the 4 hour Chart of the TITAN COMPANY.
Titan has formed a Cup and Handle pattern and given a breakout .
Two possible scenarios:
If the breakout sustains with volume, the rally may continue.
If it retests the breakout level, it would offer a safer entry before the next leg up.
If this level is sustain then we may see higher prices in Titan.
Chartpatterntrading

Narayana Hrudayalaya - Strong Fundamental & TechnicalFundamental plus Technical Analysis on a Financially Strong Company:
Narayana Hrudalaya Ltd is engaged in providing economical healthcare services. It has a network of multispecialty and super specialty hospitals spread across multiple locations.
Focus
Company plans to add 700 plus beds for the next 3-4 years at Bangalore Health City. It intends to invest upto Rs. 1,000 Cr in the West Bengal for setting up a superspecialty hospital.
Capex Plan
Company has planned a total capex of 1136 Cr for FY24 and till Q3 FY24 it has spent 477 Cr.
Stock P/E - 31.7
Industry PE - 56.3
EPS growth 5Years - 67.8 %
Buy Score - 4.56 (Buy Score above 0 for me, is considered very good and above 1, excellent.)
ROCE 5Yr - 19.6 %
Please note that this idea is meant to spread awareness and should NOT be considered a buy recommendation. Do your own research before making any financial commitments.

NATURALGAS at Best Support Zone This is the 4 hour chart of Natural Gas.
Natural Gas having a good Support Zone at 290-295 range.
Natural Gas has shown a reversal from its support zone.
Natural Gas is trading within a parallel channel support at 293 level Natural Gas.
Thank You !!

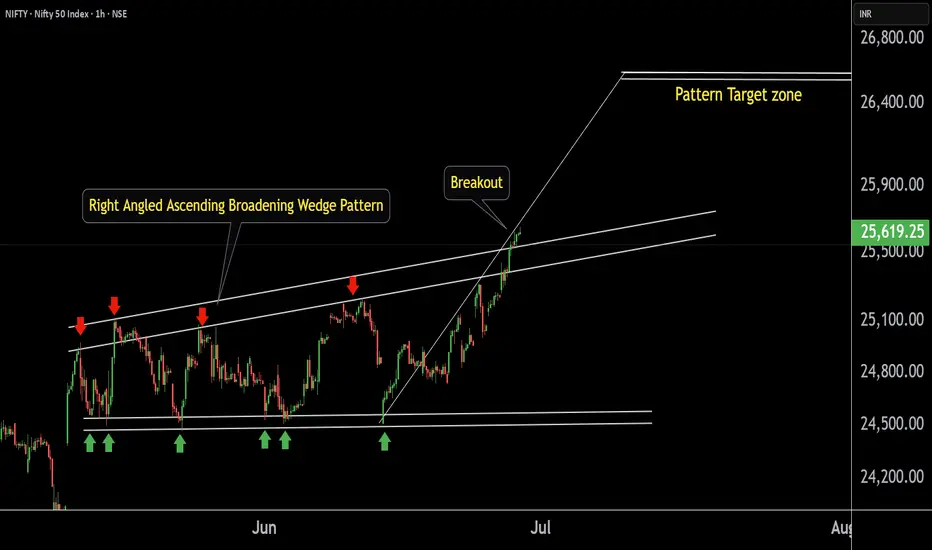
NIFTY 50 key level This is the 1 hour chart of NIFTY 50 .
NIFTY 50 has formed Right Angled Ascending Broadening Wedge Pattern.
Nifty 50 has given a breakout from its pattern.
If Nifty 50 sustains after a successful retest post-breakout, we may see higher prices in Nifty 50.
The target for this pattern is projected near the 26,600 level.
Thank You !!
RELIANCE INDUSTRIES at Key Zone !!This is the 1 hour Chart of RELIANCE INDUSTRIES.
Stock has formed a large Broadening Wedge pattern, with a projected target around the 1560 range.
Stock has formed a ascending triangle patterrn with a projected target around the 1560 range.
stock has given a breakout at 1460 range. If it successfully retests and holds this level as support , then we may see higher prices in RELIANCE INDUSTRIES.
Thank you !!

TUBE INVEST OF INDIA at Best Support This is the 4 hour Chart of TIINDIA.
TIINDIA is holding within the Fibonacci retracement golden zone.
If this level is sustain , then we may see higher prices in TIINDIA.
Thank You !!

ALLCARGO LOGISTICS at Best Support !!This is the 4 hour Chart of ALLCARGO LOGISTICS.
ALLCARGO is having good law of polarity at 33 range .
Price action confirms a retest of the support zone at 33 range.
Price action indicates a bullish HH-HL formation.
If the support level sustains, the stock has the potential to make a new high.
Thank You !!

BAJAJ FINANCE LTD at Best Support !!This is the 4 hour Chart of BAJFINANCE.
BAJFINANCE having a good support at 880-900 range.
BAJFINANCE is currently trading within an ascending channel pattern, indicating a structure of higher highs and higher lows, which reflects a sustained uptrend.
If this level is sustain, then we may see higher prices again BAJFINANCE.
Thank You !!

BERGEPAINT at Best Support !!This is the Daily Chart of BERGEPAINT .
BERGEPAINT having good law of polarity at 540-545 range.
EMA is also providing support for the stock around the 545 range.
If this level is sustain the , We may see higher price in BERGEPAINT.
Thank You !!

RAIN INDUSTRIES at Good Support.This is 4 hour chart of RAIN INDUSTRIES.
Stock is forming a Symmetrical Triangle Pattern.pattern lower boundary expected to act as a strong support level 142-145.
IF this level is sustain , then we may see higher prices in Rain industries.
Thank You !!

BEST XAUUSD BUY AND SELL SETUP FOR TODAY 📉📊 Gold (XAU/USD) Analysis – Key Levels in Focus! 📈🧐
Gold is currently trading around the 3,326 zone after a recent pullback. Price is approaching the key support level at 3,310, where a potential bullish bounce may occur, targeting the next resistance near 3,350. 🛑 However, if price fails to hold above 3,310, we may see further downside movement towards the 3,293 support. 📉 Traders should watch for reaction and confirmation around these zones before taking entries. ⚠️💡 A bullish reversal could trigger strong buying momentum, while a bearish break may lead to deeper correction. 🎯💰

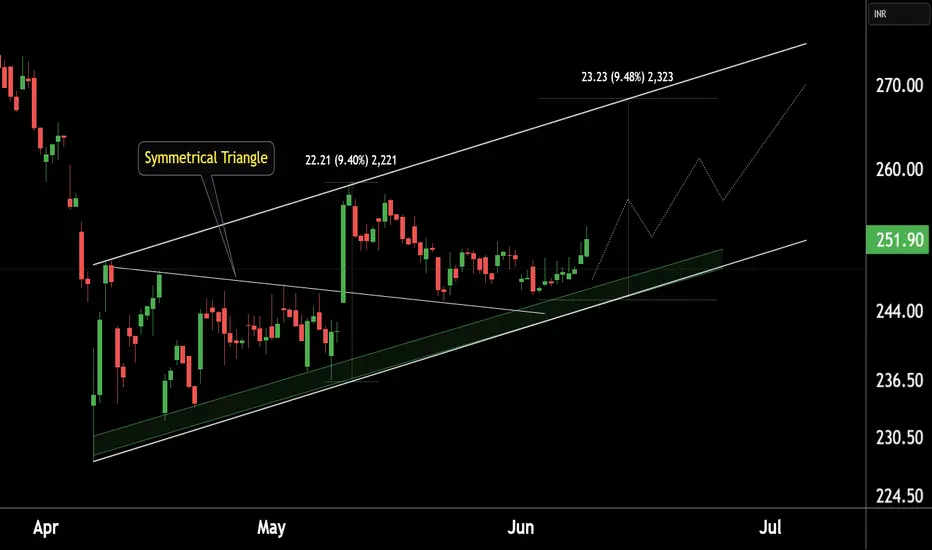
WIPRO at Best Support !!This is the 4 hour chart of Wipro ltd.
WIPRO has a strong support zone in the 245–248 range.
WIPRO is forming a symmetrical triangle pattern, with a potential target of 268, which also aligns with the channel's resistance zone at 268-270."
If this level is sustain , we may see higher prices in Wipro !!
Thank You
ETH Bullish | Inverse H&S | Cup and Handle PatternEthereum is still dragging its feet towards a new ATH, or at least, towards a high. But there are some positive signs showing up on the chart.
Make sure to check out yesterday's update on Bitcoin:
____________________________
BINANCE:ETHUSDT

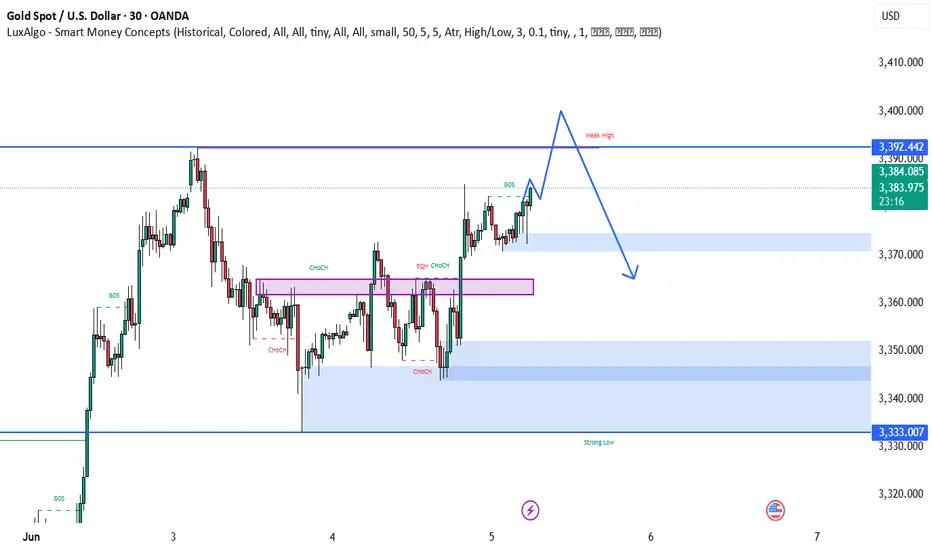
BEST XAUUSD M30 BUY AND SELL SUTUP FOR TODAY📊 Gold is currently showing bullish strength with a break above key structure levels and multiple CHoCH confirmations. Price is approaching a weak high near 3,392, which may act as a liquidity target before potential reversal. 🔄 After sweeping this high, a bearish move could unfold, aiming for the demand zones between 3,350–3,333 where buyers may step back in. 🧠 Traders should prepare for a liquidity grab scenario, with bullish continuation likely invalidated if price closes below the strong demand. ⚠️ Watch price action closely near the weak high and key imbalance zones. 🚀🔁📉
BEST XAUUSD M30 SELL SETUPNFOR TODAY 📉 Gold Analysis Summary – Bearish Setup Alert ⚠️
Gold is currently showing signs of weakness after a strong bullish push. A Change of Character (CHOCH) has confirmed a potential shift in trend. Price is approaching a supply zone (highlighted in purple), and rejection from this level could trigger a downward move. 🔄 The projected path suggests a potential lower high formation, followed by a drop towards the 3,348 and 3,331 key demand levels. 🧠 Watch for bearish confirmation near resistance before entering short positions. 📊💥

EURJPY SHORTwith safe haven assets expected to be bullish, i expect JPY to be strong against risk on currency like euro. EURJPY is expected to fall to complete a triange formation in the coming weeks before the bullish impulsive leg.

BEST XAUUSD M30 BUY & SELL SETUP FOR TODAY 📉📊 Gold (XAU/USD) Technical Outlook – Key Decision Zone Incoming! ⚠️📈
Gold prices are currently testing a crucial support zone around 3,251, following a strong bearish momentum. As shown on the M30 chart, the market is now at a make-or-break level, where two potential scenarios could unfold: either a bullish reversal toward the 3,280–3,300 area if price holds and confirms support ✅, or a bearish continuation if the level breaks, pushing price lower toward 3,220 or beyond ❌. Traders should watch for price action signals and wait for a clear breakout or strong bounce confirmation before entering any trades 🧠🔍. This is a high-volatility reaction zone — trade smart! 🎯📉📈

BEST GOLD M30 BUY SETUP FOR TODAY📉 Gold is currently showing signs of a potential pullback towards the key demand zone around 3,290–3,285 marked in purple. This area has previously acted as a strong support and could trigger a bullish reversal if price reacts positively here. 🟪 Once the price enters this zone and forms a bullish confirmation (like a rejection wick or bullish engulfing candle), we could see a strong upward move targeting 3,320+ 📈. Traders should stay alert for buying opportunities from this zone and avoid chasing the price before a clear confirmation! 🎯⚡

ZAGGLE : Chart Pattern Breakout ( Swing Pick )#ZAGGLE #breakoutstock #flagbreakout #chartpatternbreakout #flagandpole
ZAGGLE : Swing Trade
>> Chart pattern Breakout
>> Flag and pole breakout visible
>> Trending stock
>> Low Risk , High Reward Trade
>> Good Strength & Decent Volumes Building up
Swing Traders can Lock Profit at 10% and keep trailing
Disclaimer : Stock Charts shared are for Learning Purpose and not a Trade Recommendation. Do your Own Analysis or Consult ur Financial advisor or a SEBI Registered Advisor

USD/JPY 1H Analysis – Channel Breakout and Buy SignalOverview:**
The USD/JPY chart shows a **bullish breakout from a descending channel**, supported by technical indicators like the Ichimoku Cloud and a strong demand zone. This setup suggests a potential bullish reversal and upward momentum.
*Key Technical Points:**
* **Descending Channel Breakout:**
Price action has broken out of a falling channel, indicating a shift in market sentiment from bearish to bullish.
* **Strong Support Zone:**
Around 143.28 – 143.73, the price found significant support, which aligns with a previous demand zone. This area held firm, helping trigger the breakout.
* **Ichimoku Cloud:**
Price is emerging above the Ichimoku Cloud, signaling a potential start of an uptrend. If the price maintains above the cloud, bullish momentum may strengthen.
* **Resistance Levels:**
* **First Resistance:** Near 146.00 – a critical area to watch for short-term profit-taking.
* **Second Resistance:** Around 148.00 – a more extended target if bullish continuation holds.
---
### **Trading Idea:**
**BUY USD/JPY** on successful retest of the breakout or sustained move above the Ichimoku Cloud.
* **Entry:** 144.30–144.40 zone
* **Target 1:** 146.00
* **Target 2:** 148.00
* **Stop Loss:** Below 143.20 (under the support zone)
---
Conclusion:**
The chart presents a classic **bullish channel breakout** supported by the Ichimoku indicator and price action at a strong support zone. As long as the price holds above the breakout level and Ichimoku Cloud, the upside targets at 146 and 148 remain valid.
Let me know if you want this formatted as a trade plan or journal entry.
To ensure you do not miss the upcoming analysis, be sure to follow me!
Please leave a remark and a like!

BEST XAUUSD M3 BUY AND SELL SETUP FOR TODAY 📊✨ Gold (XAU/USD) Technical Outlook – 30-Min Chart ✨📉
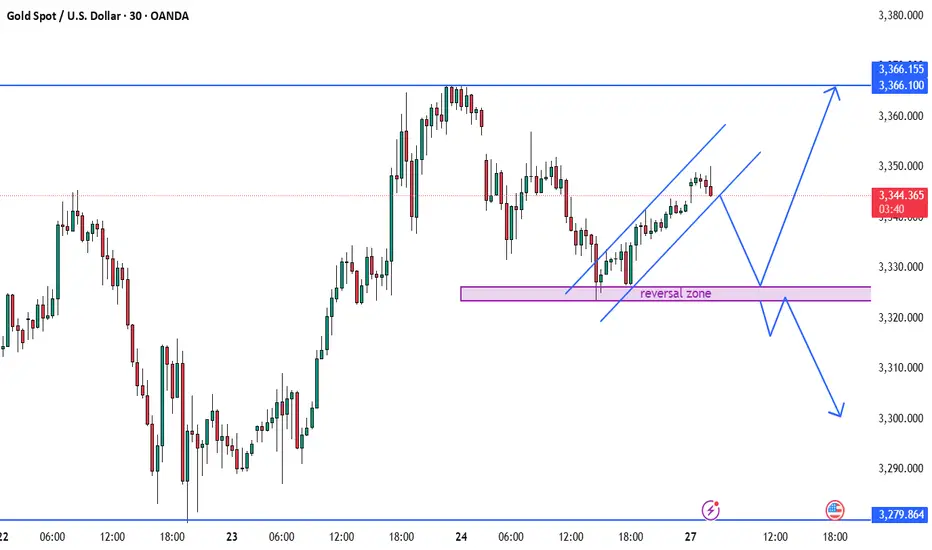
Price is currently trading within a rising channel after a bounce from the marked reversal zone 💜, suggesting a short-term bullish trend 📈. However, the chart outlines two key scenarios: if price breaks out upward, we may see a move towards the 3,366 resistance zone 🔼. Conversely, if the channel fails and price breaks downward, a retest of the reversal zone could trigger a deeper bearish move 📉, potentially targeting the 3,300 area or lower. Traders should watch for confirmation at key levels and react accordingly — not predict impulsively. 🧠⚖️📍
Top M30 XAU/USD Trade Setups for Today – Buy & Sell Opportuniti📊📉📈 Gold (XAU/USD) is currently trading within a key support zone 🟣, retesting after a previous bullish breakout. If the price holds this zone and forms strong bullish candles, we could see a move toward the 3,366 resistance level 🔵 and potentially higher toward 3,389 📈. However, if the price breaks below this zone with strong bearish momentum, a drop toward 3,280 🔽 becomes likely. Watch the price action closely within this zone, as it could lead to a decisive move. ✅ Patience and confirmation are crucial to avoid false breakouts. 💡

GOLD trending higher: Can buyers push towards 3,350$?Right now OANDA:XAUUSD is a classic case of a market trading within an ascending channel, with price action consistently respecting both its upper and lower borders.
The price has broken above a clear resistance zone and may pull back for a retest. This area also happens to coincide with the golden pocket of the recent swing and so it deserves special attention. If it holds as support, then that would be a confirmation of the bullish structure with the most likely possibility of a move towards 3,350, the middle side of the channel.
As long as the price stays above this support zone, the validity of the bullish setup is still there. If it does not, the short-term bullish outlook would therefore be interrupted and might be followed by further downside pullback.
Be sure to use proper risk management always.
