W9-20 NZDJPY BEARISH IDEA (HARMONICS REVERSAL PATTERN)Potential Bearish Entry
Dow Theory In Place - Lower High and Lower Low Expected in Place
Formation of Harmonic Bearish reversal Patte coupled with bearish divergence at potential reversal zone (PZR)
Entry at LL on the basis of harmonic reversal pattern, candle stick pattern (three black crows), and support and resistance.
SL & TP Levels are defined.
Chartpatterntrading

SELL TRADE SETUP ON XAUUSDHey Traders,
Gold fell from HKEX:2 ,490 mark on Friday amid FOMC data release.
I am expecting a much further sell-off from there and then wait for what the market got to do afterwards.
However, break of the bullish flag pattern should be waited on and then entry can be look for on 15Min timeframe for the retest.
Watchout Out.

Necklace Pattern Trading - "S Chand & Company"This has been highly dependable stock since last 1 month. When benchmark Index "Nifty" fell by 500 points, this stock was rock solid holding its swing high level & stayed in the range of just 20 points. This is my Necklace Pattern stock it will be interesting to see how story unfolds when it reaches its previous swing highs.

Momentum Pick - Banswara SyntexThis stock looks like re-claiming its high on weekly TF. Steady gains on daily basis continued with conviction suggest its move! There is a small hurdle of 150 & then it may see crossing its high 158 soon.
This is not a buy suggestion, its only for education purpose!

DYDX USDT Ascending Triangle Break out in 1 HR TF.BINANCE:DYDXUSDT DYDX USDT Ascending Triangle Break out in 1 HR TF According to my TA Analysis. DO your own Research taking any financial Decision.

#bitcoin map doesn’t lie #btcstarbrstLooking at this map so far it has not really lied breaking the light blue line will send us into a bull market “probably” rinse and repeat and re-tweet follow along

GBPUSD - Chart Patterns!Recently I have been liking to trade patterns instead
I feel like this is one for me

QNT USDT Break the Triangle in 1 HR TF. BINANCE:QNTUSDT QNT USDT Break the Triangle in 1 HR TF. Long setup 1:1 R/R Ratio.

SUSHI USDT Triangle Break out in 4 Hr TF. BINANCE:SUSHIUSDT SUSHI USDT Triangle Break out in 4 Hr TF. Long Entry break the previous H.H. Risk / Reward 1:2

HBAR as a Good Example of Common Patterns & Measured MovesHBAR presents a good example of how simple market pattern trading using measured moves still work quite well.
As these are moves in crypto, the measured targets exceed recommended lengths for a typical pattern trade, yet still line up quite well in continuing to use the same measurements beyond 1x -> 1.5 or 2x.
First, a parallel channel containing a double-bottom, saw a nearly 4x measured move up on the weekly. Its highest wick, breaking 4x.
Then a rising wedge that could also be called a double-top, worked out for a nearly 2.5x measured move down back into weekly support; stopping inches above the stronger area of support near the bottom.
Also, if you look at HBAR's most recent weekly highs, they stopped right around the 1x measured target of the upward move, and is now pushing on the 1.5x measured target of the downward move.
Both measurements are still providing direction on where price might make pit-stops.

GBPNZD LONG 1H TF 1H TF: Double bottom on the 30 min tf & 1 hr tf. Let's see if price will break resistance to the upside and turn it to support. I'd expect a bullish run if that happens.
Indicators: RSI tested MA and might push to the upside.
MACD: EMA crossover to the upside.

Symmetrical Triangle on XAU/USD @ D1Gold (XAU/USD) is currently consolidating inside a symmetrical triangle pattern on its daily chart. I will try to use it as a trend continuation breakout setup. My potential entry is marked by the cyan line, which is located at 10% of the triangle's base width above the upper border. My take-profit will be at the green line, which is located at 100% of the triangle's base width above the upper border. I will set my stop-loss to the triangle's lower angle (the red line at 1934.12). I will ignore bearish breakouts from this formation.

DOGE $ Squeeze Targetwe about to have another pump , if we hold our current support above the 0.08$ , this time we going to have the test near the 10 cent , and if we broke that level without any resistant we going to have huge pump towards the 15 cent .

Necklace Pattern Series - "Sterling Tools"Classic Necklace Pattern along with "W" i.e. double bottom formation at lower levels on M TF.
Check your own chart, this is only for educational purpose & Not a buy recommendation.

AVAXUSDT| ABC Wave Projection| Retesting Inv. H&S NecklineAVAX price breakout SMA50 with bullish pennant pattern, possible ABC pattern retesting mega inverted head & shoulder
TP 0.618 - 1.0 fibonacci retracement of wave B +25% upside
S1: SMA50 17.50 and S2: SMA 200 16.00

Trade After SL Hunting CandleBYBIT:BTCUSDT.P
after SL hunting market should go up
my view is bullish till next resistance..
good risk reward ratio
perfect bottom trade.
Lets hope for the Targets.

BABA in daily timeframealibaba chart after big drop seems going to bull faze
it break the important weekly resistance
in daily chart after pullback to EMA200 would going to up

Never Say Die Stock - "Data Patterns"Data Patterns is a vertically integrated defense and aerospace electronics solutions
provider catering to the indigenously developed defense products industry. The
company has proven in-house design & development capabilities and experience of
more than three decades in the defense and aerospace electronics space. They have clients like ISRO, DRDO & HAL etc. Reserves to Borrowing ratio is also attractive.
Source - Screener.in.
If it crosses 1440 level, it may give us a new high. This is a study purpose chart & NOT a By call or recommendation!

DOT USDT Long Entry 15 Min TF ABCD PatternBINANCE:DOTUSDT DOT USDT Long Entry 15 Min TF ABCD Pattern or also FIb Level Use.

NASDAQ PROJECTION ON 1ST WEEK OF FEBRUARYApex level as confluence of the Expansion WXY with the Triangle Pattern gonna be my sell zone. If price break 12750, consider to stop selling, might up to 135xx.

Necklace Pattern Series -"Career Point"This Stock is creating repeated Necklace patterns, i.e. rounded bottom in follow up manner. When such stock tries to reach higher high or tries to defend lower levels repeatedly, it may touch its past glory i.e. its previous Life Time High & explode further.
This chart is for study purpose & not a buy call!

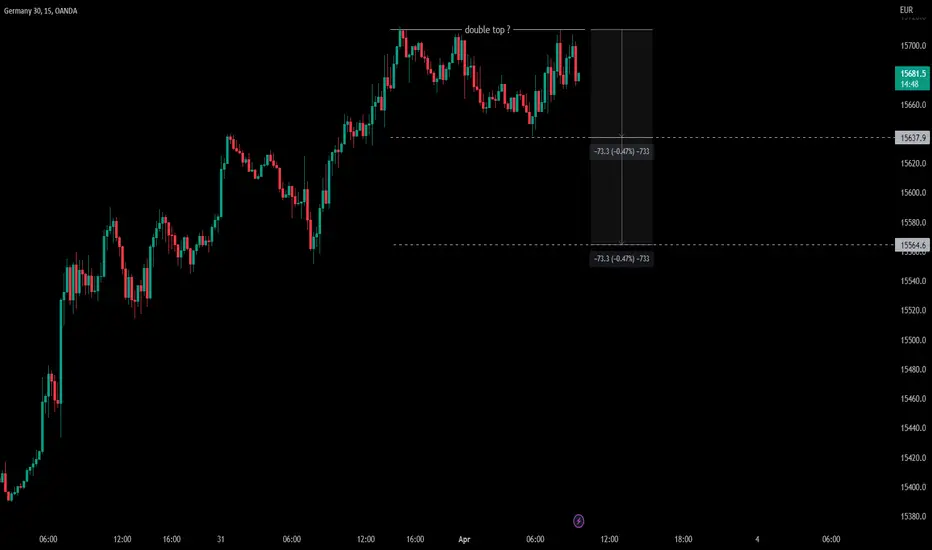
DAX 30: Double Top Pattern in short term?From a technical point of view, the $DAX30 index could form a Doublet Top Pattern on 15' chart.
Trade with care! 👍 ...and if you think that my analysis is useful, please..."Like, Share and Comment" ...thank you! 💖
Cheers!
N.B.: Updates will follow below
BEM | Leading Diagonal Pattern Projection - Wave B CorrectionA possible ABC correction after finishing mega leading diagonal wave pattern:
Wave B target 0.5 - 0.618 retracement of wave A and EMA 20 week resistance
A possible false breakout EMA200 week
Wave C - Targeting 0.786 fibonanci zone of major Wave 1
