MULN Reversal Bottom $we started to have a reversing from the bottom price 0.18$, the confirmation for a reversal is above the 0.24$, which is our current resistant area, after we break that level we going to have a test for 2 profit taking , first around the 0.28$ and the second around the 0.33$.
Chartpatterntrading


USD CAD Bearish Engulfing Div in USD CAD 1 HR TF.OANDA:USDCAD Bearish Engulfing Div in USD CAD 1 HR TF.

TSLA: Very Dangerous Situation.• TSLA is still dropping, and although it is in a support area, there’s no bullish reaction confirming a bottom sign yet;
• The key support is the $187, which is the baseline of a this congestion, and if TSLA loses it, we might see a bearish reversal structure;
• What’s more, the $187 could be the neckline of a Head & Shoulders chart pattern;
• If TSLA turns bearish, I see it filling the previous gap at $146 in the next few weeks;
• In order to avoid this scenario, TSLA would have to do a very good bullish reaction as soon as possible, and break its main resistance area;
• The main resistance area on TSLA is made by 3 resistances that are very close to each other: In the 1h chart, there’s the 21 ema and the purple trend line connecting the previous tops; In the daily chart, there’s the 21 ema. Only if TSLA breaks this resistance area we would see a frustration of this bearish thesis.
Remember to follow me to keep in touch with my daily analysis!

EURUSD IS APPROACHING A CONFLUENCE ZONE (FIB50 & TL)Make sense off the chat. it is clear that this asset will drop following the BEARISH engulfing candle
share your thought


EUR USD Bullish Trend in 1 HR TF OANDA:EURUSD In the 1 Hr TF, we see the Bullish Trend starting. The Hammer and Bullish engulfing candle shows on charts that is good sign for go Upside movement. Or break the previous H.H more confirmation to the Upside.
DNA - Falling WedgeIt`s in our DNA to create reliable and objective analysis for our dear followers, and we will continue doing so.
We can see a falling wedge occurring on this chart, and we therefore expect a move to the upside.
Also the RSI has shown bullish divergence lately.
We will wait for a breakout of the trend, to take our long position.
More details are shown on the chart.

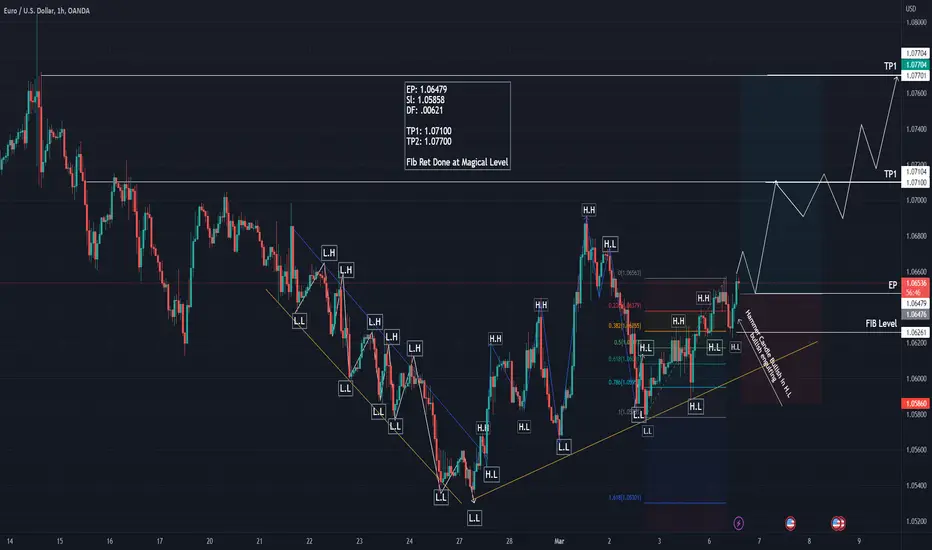
GBP USD BULLISH TREND IN 1 HR TF OANDA:GBPUSD In the 1 Hr TF, we see the Bullish Trend starting. The Hammer candle shows on charts that is good sign for go Upside movement. Fib Ret Level also Done at Magical Number.

TSLA: Dangerous Reaction in a "No Man's Land".• TSLA did a Bearish Engulfing candlestick pattern yesterday, and it is back to its 21 ema area;
• If TSLA loses this 21 ema, it could seek the next support at $187 again;
• TSLA is still in a congestion, and only a breakout of the $187 would reverse the bullish sentiment;
• On the other hand, it has to break the previous resistance at $214 in order to trigger this Bullish Flag and seek higher levels;
• So far, TSLA is in a ”no man’s land”, and any reaction inside this congestion shouldn’t be taken too seriously;
• What if TSLA loses the $187? Then the next target would be the gap around $146;
• TSLA is dangerously close to its support level, and the way it reacts in this area might dictate if we’ll see a downwards breakout or a bullish continuation to the resistance at $214. Either way, we’ll have our answer soon. I'll keep you updated every day on this.
Remember to follow me to keep in touch with my daily analysis!

[Tutorial] Price Action And How Can We Use It To Make MoneyWelcome to this video on Bitcoin and price action Part 1 of 3. But what exactly is price action, and how can it help you make informed trading decisions?
Price action is a technique used by traders to analyze market movements based on the price and
volume of a security, without relying on technical indicators or other external factors.
In this video, we'll explore some of the most commonly used price action patterns in Bitcoin trading
, including support and resistance levels, trend lines, candlestick patterns, price action patterns, and moving averages.
We'll also discuss how to use these patterns in combination with other forms of analysis to make informed trading decisions,
and how to manage risk when trading Bitcoin.

bull/bear idea If price breaks resistance at 22,590 I will open a long trade with 1% risk of my account value to try to make 3%.
If price breaks support at 22,240 I will open shorts risking 1% of my account value to try to make 3%.

GBP JPY Bearish Trend Starts in 1 Hr TFOANDA:GBPJPY We can see Bearish Trend start in 1 Hr TF. Shooting Star Showing good sign for rejection

AUDCHF Bearish Trend 1 HR TFOANDA:AUDCHF Bearish Trend 1 HR TF . You can see that Bearish trends continue in this pair. I'm Expecting AUDCHF create new L.L. Shooting Star Create in 1 Hr TF

Power of Inside Bar - Cingniti TechInside Bars if used wisely, can give us astonishing results in Trading.
Let's understand this scenario.
Stock Name - Cigniti Tech
After 20th Feb 2023, on D TF, this counter merely had any move! More or less it had inside Bars with totally squeezed close prices compared to earlier close. if you observe, closing prices are getting squeezed day by day with drying up sales volume. This indicates sellers are loosing control & buyers ay pitch in!
Following are reasons for my Long view -
1. Stock is in Up Trend.
2. Stock prices are above 200 EMA
3. 10 & 20 EMAs are above 200 EMA.
4. RSI has crossed 55
5. Nifty IT index is in uptrend, so sectors is booming.
So my entry would be on crossover of high of 7th Feb. Same setup & logic can be applied while entering stock on 3rd March, as its crossing previous high of 2nd march for a quick move on upside.


cmsinfo in an upward movementOn 26.12.2022 the stock bounced from a low of 270.10 with a big bullish candle on the 4 HTF.
This big bullish candle indicates the institutional buying meaning this would be a good demand zone.
The stock then made a high of 270.10 before moving in a sideways zone for the next one month and the downtrend had begun.
The stock moved towards the demand zone. Now on 28.02.2023 there was an entry of institutional orders which has taken the stock out of the demand zone.
With this buying coming into place we can anticipate the prices to move higher.
Buy @/above 295
Target = 310/320
Stop Loss = 270
Investments in stock market are subject to risks.
Past performance of stocks is not indicative of their future performance.
We make no representation/s or warranty/ies, express or implied, as to the accuracy, completeness or reliability of any information compiled herein, and hereby disclaims any liability with regard to the same, including, without limitation, any direct, indirect, incidental or consequential loss.
Investors are requested to review the stocks before investing.

Magic of Morning Start Pattern on Higher TF - Bank NiftyMorning & Evening Star gives magical results. Early identification in BNF long move was visible on daily TF, if we could have spotted it right! What a move later on!

Trendline Breakout in Latent View Analytics Ltd...Chart is self explanatory.
Disclaimer: This is for demonstration and educational purpose only. This is not buying or selling recommendations. I am not SEBI registered. Please consult your financial advisor before taking any trade.

SHUSHI USDT Bearish trend 1 HR TFBINANCE:SUSHIUSDT In the 1 Hr TF, we see the bearish Trend starting. The bearish engulfing candle shows on charts that is good sign for down side movement.
Or break the previous H.L more confirmation to down side.

LINK $ In My Mind - Bearish Trend. 1 Hr TF TABINANCE:LINKPERP In the 1 Hr TF, we see the bearish Trend starting. The bearish engulfing candle and Hanging Man Candle that is good sign down side.
Or break the previous H.L more confirmation to down side.

More upside coming soon? 📈See chart image. Entered long here. A little bit too late but it seems like it works so far. If you've got questions feel free to use the comment section here. Good trades, folks!

Trendline Breakout in FSN E-Commerce Ventures Ltd (NYKAA)...Chart is self explanatory.
Disclaimer: This is for demonstration and educational purpose only. This is not buying or selling recommendations. I am not SEBI registered. Please consult your financial advisor before taking any trade.
