GBPAUD 4Hits looks go to breaking the trend line and its a down of EMA200 guys...
take a short position with confidence(its a joke)______>>>>it is just analyse, nothing is certain
Chartpatterntrading

AMD key reversal and double-top signaling possible pull backAMD has made an impressive bull run during the past month from a low of 60.05 on January 6th to a high of 88.94 on February 2nd, for a total gain of 28.29 per share. This run was triggered by a key reversal, so it's possible that a key reversal will also signal its end.
I would pay close attention to today's bearish key reversal, and the double-top that formed near a resistance line going back to late 2020/early 2021.
Disclaimer: I am not a financial advisor, and the above statements are not investment advice. My comments are only intended for educational purposes. You are solely responsible for your own trading decisions.

TSLA: Trading at a Critical Level.• TSLA is still trending, and as of yesterday, there’s no top sign on it yet;
• It is breaking the previous resistance at $214, which is a bullish sign indicating a continuation of this rally, but TSLA must stay above the $214 today, otherwise, it might lose momentum, and the market might see it as a false breakout. We'll have our answer today;
• I see many comments on a Double Top, but in order for this to happen, we must see TSLA dropping fast, and losing the previous bottom at $187 in one single bearish leg in order to technically trigger a Double Top, and reverse the bullish sentiment;
• Either way, let’s pay attention to how TSLA will react today, since it seems we are breaking the $214 resistance. I’ll keep you updated on this.
Remember to follow me to keep in touch with my daily analyses!

SPX: This Channel Might Change the Trend.• SPX is inside a Descending Channel, as seen in the 1h chart;
• Despite the bearish momentum in the 1h chart, the trend is still bullish in the daily chart, as the SPX is still doing higher highs/lows and it is above the 21 ema;
• However, if it loses the 21 ema, or does a downwards breakout from this channel, then the bullish bias might reverse in the daily chart (mid-term trend);
• On the other hand, the index would have to do a clear upwards breakout from this channel in order to materialize a bullish continuation pattern;
• This bullish scenario would take us to 4,218, our next target, and an open gap from August last year;
• For now, let’s pay attention on how the index will react inside this channel.
Remember to follow me to keep in touch with my daily analyses!

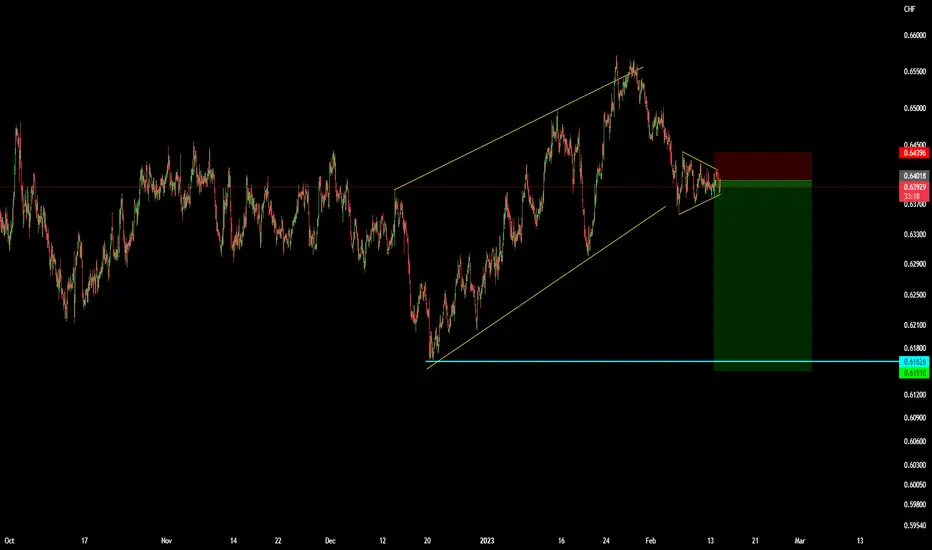
AUDCHF SHORTStrend continuation formation printed for potential shorts to 0.6161..Earlier price moved impulsively from the third touch of an ascending channel.. Keen to see how this short plays out.
MULN $ Squeeze Target we have to break our current resistant around the 0.47$ and hold above the 0.31$ to confirm the squeeze towards our 2 profit taking the 0.60$ and then the 0.76$.
the second support if we break the 0.31$ is the 0.25$ which is a confirmation that MULN will not have another sell off or a new low for this year if we held above it .

USDSEK Price forecastingUSDSEK price action has completed two touches on a potential expanding formation whilst forming a structure within in the form of an ascending channel. The potential third touch on the ascending aligns with the potential third touch on he outer expanding structure..Will be watching price action closely for potential shorts .

GBPCAD FINAL SUBWAVE OF THE FOURTH WAVEBased on the analysis above, the market is currently almost at the end of the final subwave of the fourth wave. The wave 4 contains three corrective waves (ABC) with subwaves formantion of 5-3-5 waves. As of now, expect the completion of the subwave 4 of the entire correction and its supposed to contain 3 corrective subwaves (ABC waves). After the bullish anticipation will follow. Stay Tuned for moore updates...

Sunday analysis - S&P 500 falling wedge As we can see the falling wedge pattern has been playing out over the course of a year. We have now broken the wedge pattern and the trendline and now retesting the previous lower high. Could the S&P now see a new high this year or is this a false breakout or a market trap? I will be keeping an eye on this pattern in the next weeks to see how this plays out.

Double Top at LTCUSDT. It is going downOn the medium-term timeframes LTCUSDT, another figure is identified by my publicly available scripts.
This time it's a double top. Therefore, with sufficient probability, we can expect that the next significant movement will be - DOWN.
All figures on this chart are built automatically by my scripts available for free to every tradingview user on my page: www.tradingview.com

Double Top on GBP/USD @ D1A double top pattern has formed on the daily chart of the GBP/USD currency pair. You can use it as a short trade setup on a bearish breakout. The two tops are marked with the upper yellow line; the neckline is marked with the lower yellow line. My potential entry level is at the cyan line (10% of the pattern's height below the neckline). My potential take-profit level is at the green line (100% of the pattern's height below the neckline). My potential stop-loss is not shown on the chart and will be set to the high of the breakout candle or to the high of the preceding candle should the breakout one trade mostly outside the pattern's borders. I will ignore bullish breakouts from this trend-reversal pattern.

Short SOLUSD FOR SHORT TERM. 1:3 RRSolana is an open-source blockchain platform that aims to provide fast, secure, and scalable decentralized solutions. Solana's native cryptocurrency is called SOL, and it serves as the primary token for transactions and fees on the Solana network.
If you are looking to trade Solana (SOL) on a 15-minute time frame with a 2% risk, it means that you would be analyzing price movements of SOL over 15-minute increments and limiting your potential losses to 2% of your trading account. This is a common approach in risk management for traders and investors, as it helps them to control their exposure to losses and keep their trading capital safe.
It's important to note that no investment strategy is foolproof and there are always risks involved when trading cryptocurrencies. Before making any trade, it's advisable to carefully consider your investment objectives, risk tolerance, and market conditions to determine if Solana (SOL) is a suitable investment for you. Additionally, it's important to do your own research, understand the technology and economics behind Solana, and stay up-to-date with the latest developments in the Solana ecosystem.

It's AAVE---Long IDEAHello everyone;
This Idea is for AAVE/USDT, spot pair, BUT It's Tradable on AAVE's Laveraged token as well .
So Aave has multi divergences at various Time frames, BuT we are Looking at ones on D and W charts,
I Marked Them with brush, They are visible on RSI,AwsomeOS and...
We are Also at 50% FIB Support, And of course a Giant BAT Pattern which is pretty much complete!
-So You can open your orders NOW or after confirmation on spot or ETF .
I Marked The First and second Targets on it,it may go Higher But ..
GOOD LUCK!

EURGBP - SHORT IDEA! BREAKOUT THEN RETEST!ok, hi traders! we're coming to a 4H support level on our 4H chart, however on the daily it's currently bearish and making it's way down towards that crucial daily support area/touching the trendline.
as you can see on my chart, i'm looking for that breakout + retest confirmation before any sells! the target I am looking to reach is a very strong 4H/DAILY zone that I would love to see A counter reversal!
all we can do is let's see what the wave shall be and let's surf it! good luck traders! manage risk accordingly!
thank you, comment and share knowledge with me!

GOLD broke out of channel, potential shortsGOLD broke impulsively from the reversal ascending channel and at the moment it has been forming a continuation pattern from which i will be looking for a third touch rejection within the continuation pattern as illustrated by the brush tool.

NIFTYDo you know this ?
If price breaks out from a channel and then subsequently moved back in to the channel and now if it again breaks down from the channel the fall will be almost equal to previous break down.
