Play In A Range...NSE:CIEINDIA trade at 585. Support at 520, Resistance at 620
You can watch it next Resistance at 720-740.
Chartpattren

Breakout with Volume...NSE:TV18BRDCST trade at 51.55. Support is at 47.70 and Resistance is at 54.30
When its break Resistance level you can watch it @ 59 and after this 68.

#SPX intermarket analysisAs observed, the SPX and Copper have shown a strong positive correlation over the past few weeks, often forming tops and bottoms simultaneously.
Given that Copper recently failed to break above a long-term bearish channel upper line and has broken its structure to the downside, we might expect a similar move in the SPX.
However, when trading SPX based on this intermarket analysis, it's crucial to wait for a price confirmation in the SPX itself before taking any action.

ADD in Your Watchlist...NSE:KEI trade at 4630. Support is @ 4385 & Resistence is @ 4790.
on the daily chart time make a gap up breakout. you can wait for its fillup otherwise when it cross above 4790, its next resistence @ 5050 after that its on blue sky zone....

Ready for DARVAS BOX Breakout...NSE:CEATLTD trade at 2845. Support @ 2500 Resistence @ 3000
on the weekly chart made a DARVAS BOX Pattern, after its breakout you can watch for next resistence @ 4000

VOLUME BREAKOUT...NSE:ALLCARGO trade @ 71.40 Suppport @ 58.50 Resistence @ 78.50
on the chart seen a higher volume breakout. You can watch it as a Next Resistence @ 98

Take a chance for New All Time High...NSE:POLYCAB trade a 6750. resistence is @ 6900 & support is 6300. You can watch for it New Life Time High @ 7300.

UMA - Three D(r)ives Down PATTERNUMA is approaching an ideal buy-back zone whilst forming an important chart pattern - the Three Dives Down Pattern.
This pattern goes by many names including Three Drivers, Three Drives Down and Three Dives Down (which is the one I prefer to use). This pattern is bearish for the SHORT term, but bullish for the NEAR and LONGER term.
It's important to note that this analysis is from a macro timeframe, with the aim on identifying the key buy-back or re-accumulation zone. From the daily and lower timeframes, the price could easily increase by large amounts however, keep in mind we're looking for an accumulation zone not for swing trades in this post.
________________________________
BINANCE:UMAUSDT

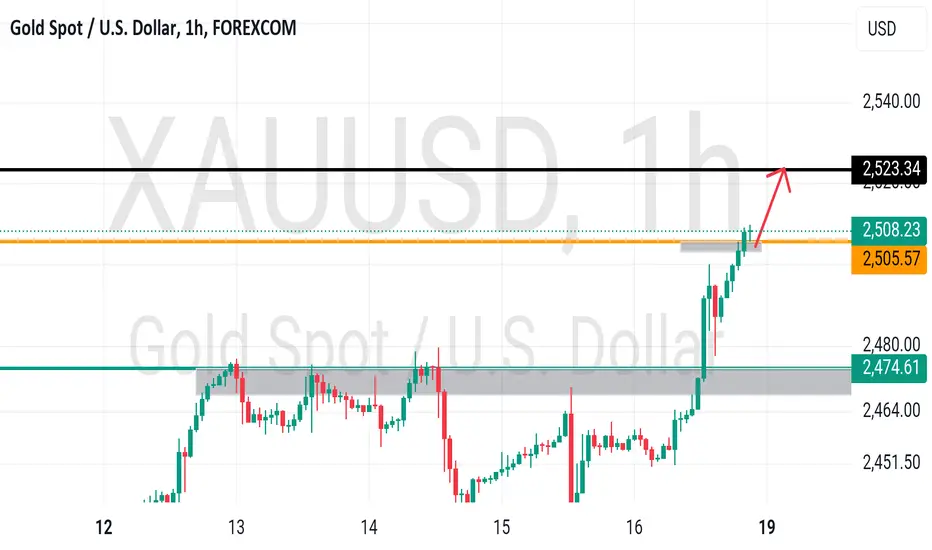
Gold Short-Term Dip with Long-Term Bullish PotentialGold presented an excellent opportunity for traders today, with the market favoring the bears. Despite this short-term bearish momentum, the long-term pattern for gold remains bullish when considering the broader fundamentals.
Notably, gold has recently created an all-time high (ATH), which further strengthens its bullish outlook in the long run. Currently, gold is trading around the $2,480 level, where it has found a key support zone. The price action at this level suggests a potential rebound.
I anticipate that gold will bounce back from this support and make its way towards the $2,500 level, where it will likely retest the resistance. Traders should keep a close eye on this support level, as a successful rebound could signal a continuation of the long-term bullish trend.
However, if the bears manage to break this support, we could see the market fall to the $2,445 level. Keep your eyes open when the market opens, as it may provide hints about the next move for gold. Caution is advised, as market dynamics can shift quickly, and it’s essential to stay updated with the latest market developments.

GBPUSD... Most expensive area of the month? Next??#GBPUSD... Market just reached at his most expensive area of the month and that is 1.2960
It's the area that is holding so many times in history you can check in week and day chart as well.
Keep close that level guys because it can change the pound next price action and overall chart point of view.
Don't hold your short above that area.
Good luck
Trade wisely

SURYA ROSHNI - W PATTERNSURYA ROSHNI - W pattern
1. W pattern
2. RSI > 50
3. RS(55) > 0
ENTRY - 715
SL - 10 %
TGT - 833

USDCAD.. support broke? What's next??#USDCAD... Market just below his major supporting area that was actually 1.3660
Keep lcose it because of market hold it now then further drop on table..
Stay sharp ..
Good luck
Trade wisely

Forming of Rounding Bottom...BLS International Service Ltd forming a rounding bottom pattern. who breakout above 430. Its next Resistence is at 550....

GOLD... At his one n only support? What's next??#GOLD.. after breakouy in last week market now at his immediate supporting area that is 2504 05
Keep close that level.
That is one n only support of gold for now.
And keep in mind below that cut n reverse still exist..
Good luck
Trade wisely
USDJPY.. at major support? What's next??#USDJPY.. market just near to his major supporting levels.
That is around 144.60 to 146 figures around 30 50 pips region is supporting region.
Market should hold it for create again upside volume.
If market hold that region in that case you can see a bounce from here otherwise not ..
Only below 144.60 can be invalidate buying otherwise not at all.
Good luck
Trade wisely

GOLD - at his ultimate resistance, holding or not??#GOLD.. so far perfect move as per our analysis, and now market at his ultimate resistance area that is around 2479 to 2484 around 5 points.
that region can change the scenarios of gold.
keep close it because if market it in that case you can see a drop towards your further downside areas that's are mentioned.
but keep in mind above resistance region keep cut n reverse in hand.
good luck
trade wisely

GOLD... one n only level, holding or not ??#GOLD.. Market at his one of the most important resistance area that is 2475 76
Keep close that level guys that can change the overall scnerio of market.
I know about middle east mess but market have 2475 76 as a most expensive area of the month and week..
Keep close it and don't hold your buying positions only below that level..
Good luck
Trade wisely

BTCUSDT.. at most expensive support, hold or not??#BTCUSDT.. well guys market at his most expensive supporting area around 58k
Keep close that region in yellow that will be your area.
As you can see market holding this area from last sessions.
If market clear that level then further drop expected towards our next areas.
Good luck
Trade wisely

#GER30 bearish continuation moveAfter an impulsive bearish move in the GER30 last week, the price is now forming a bullish corrective move and a rising wedge pattern, which typically has a bearish bias.
Additionally, the price has reached the 1-hour 200 EMA, which could act as dynamic resistance. There's also a bearish divergence between the price and the momentum oscillator on this timeframe.
These factors together suggest a bearish outlook.

#EURGBP buying opportunityAs can be seen in the chart, the price appears to have completed a bearish corrective move, signaled by a change in market structure to the upside and the formation of a bullish divergence.
Now, we could look for buying opportunities during minor bearish corrections.

Parallel Channel Breakout in VOLTASStock: VOLTAS
Current Price: 1560
Chart Pattern: Parallel Channel Breakout
Overview
VOLTAS has recently demonstrated a technical breakout from a well-defined parallel channel pattern. This breakout is an indication of potential bullish momentum, suggesting that the stock could experience significant upward movement. The breakout occurred at the 1560 level, which serves as a critical point of reference for further trading actions.
Trade Setup
Breakout Level: 1560
The breakout level represents the point at which the stock price moved above the upper boundary of the parallel channel, signaling a potential trend reversal or continuation in the upward direction.
Entry Strategy:
Go Long: Enter the trade at or slightly above the breakout level of 1560. This ensures that the breakout is confirmed and the trade is initiated in the direction of the new trend.
Target Levels
Initial Target: 1625
This target is set based on a conservative estimate of the stock's movement post-breakout. It represents an intermediate price level where profit-taking or partial exits might be considered.
Final Target: 1684
The final target is derived from the height of the parallel channel pattern. This level projects the full potential upside based on the channel’s dimensions, assuming the breakout sustains.
Risk Management
Stop Loss: 1500
A stop loss at 1500 is recommended to manage risk and protect against significant adverse movements. This level is strategically placed below the breakout point to allow some price fluctuation while still maintaining a controlled risk profile.
Technical Analysis
Pattern Confirmation: The breakout from the parallel channel is a bullish signal, indicating that the stock has moved beyond its previous range of consolidation. This suggests the potential for further upward momentum.
Upside Potential: The height of the parallel channel, when projected upward from the breakout level, provides a target range for potential price movement. The final target of 1684 is calculated based on this pattern’s projected extension.
Summary
Action: Go Long
Entry Point: At or above 1560
Stop Loss: 1500
Initial Target: 1625
Final Target: 1684
Additional Notes:
Continuously monitor market conditions and stock performance.
Adjust stop loss and target levels as needed based on ongoing technical analysis and market developments.
Consider using trailing stops to lock in profits as the stock price moves toward the target levels.
Disclaimer: This recommendation is based on technical analysis and educational purpose. Always conduct your own research and consider consulting with a financial advisor before making trading decisions.

#NIFTY Intraday Support and Resistance Levels - 12/08/2024Nifty Opening Outlook:
Opening: Expected to be flat near the 24,400 level.
Upside Potential:
If Nifty starts trading and sustains above 24,400, an upside rally up to 24,600 is anticipated.
Downside Potential:
If Nifty starts trading below 24,300, a downside movement is possible.

GOLD - is it retest?? Or again ATH??#GOLD... well guys a new week with important data's is going to start in few hours.
On chart we have our channel that is most important as you can see in history.
That channel can create a bubble for at least 50 points to eitherside.
So keep close that channel if that is market retest then again drop expect f below that.
But keep in mind that if market enter again in his channel the. Cut n reverse should be my next option.
Good luck
Trade wisely
