Btcusdt ..Trend line The uptrend line is still intact and unbroken, and we are still in the uptrend. I predict $40,000 for btc ...
Chartpattren

JUST A REMINDER CHART FOR BEGINNERS
Here are some Educational Chart Patterns JUST A REMINDER CHART FOR BEGINNERS
I hope you will find this information educational & informative.
>Head and Shoulders Pattern
A head and shoulders pattern is a chart formation that appears as a baseline with three peaks, the outside two are close in height and the middle is the highest.
In technical analysis, a head and shoulders pattern describes a specific chart formation that predicts a bullish-to-bearish trend reversal.
>Inverse Head and Shoulders Pattern
An inverse head and shoulders are similar to the standard head and shoulders pattern, but inverted: with the head and shoulders top used to predict reversals in downtrends
An inverse head and shoulders pattern, upon completion, signals a bull market
Investors typically enter into a long position when the price rises above the resistance of the neckline.
>Double Top (M) Pattern
A double top is an extremely bearish technical reversal pattern that forms after an asset reaches a high price two consecutive times with a moderate decline between the two highs.
It is confirmed once the asset's price falls below a support level equal to the low between the two prior highs.
>Double Bottom (W) Pattern
The double bottom looks like the letter "W". The twice-touched low is considered a support level.
The advance of the first bottom should be a drop of 10% to 20%, then the second bottom should form within 3% to 4% of the previous low, and volume on the ensuing advance should increase.
The double bottom pattern always follows a major or minor downtrend in particular security and signals the reversal and the beginning of a potential uptrend.
>Tripple Top Pattern
A triple top is formed by three peaks moving into the same area, with pullbacks in between.
A triple top is considered complete, indicating a further price slide, once the price moves below pattern support.
A trader exits longs or enters shorts when the triple top completes.
If trading the pattern, a stop loss can be placed above the resistance (peaks).
The estimated downside target for the pattern is the height of the pattern subtracted from the breakout point.
>Triple Bottom Pattern
A triple bottom is a visual pattern that shows the buyers (bulls) taking control of the price action from the sellers (bears).
A triple bottom is generally seen as three roughly equal lows bouncing off support followed by the price action breaching resistance.
The formation of the triple bottom is seen as an opportunity to enter a bullish position.
>Falling Wedge Pattern
When a security's price has been falling over time, a wedge pattern can occur just as the trend makes its final downward move.
The trend lines drawn above the highs and below the lows on the price chart pattern can converge as the price slide loses momentum and buyers step in to slow the rate of decline.
Before the lines converge, the price may breakout above the upper trend line. When the price breaks the upper trend line the security is expected to reverse and trend higher.
Traders identifying bullish reversal signals would want to look for trades that benefit from the security’s rise in price.
>Rising Wedge Pattern
This usually occurs when a security’s price has been rising over time, but it can also occur in the midst of a downward trend as well.
The trend lines drawn above and below the price chart pattern can converge to help a trader or analyst anticipate a breakout reversal.
While price can be out of either trend line, wedge patterns have a tendency to break in the opposite direction from the trend lines.
Therefore, rising wedge patterns indicate the more likely potential of falling prices after a breakout of the lower trend line.
Traders can make bearish trades after the breakout by selling the security short or using derivatives such as futures or options, depending on the security being charted.
These trades would seek to profit from the potential that prices will fall.
>Flag Pattern
A flag pattern, in technical analysis, is a price chart characterized by a sharp countertrend (the flag) succeeding a short-lived trend (the flag pole).
Flag patterns are accompanied by representative volume indicators as well as price action.
Flag patterns signify trend reversals or breakouts after a period of consolidation.
>Pennant Pattern
Pennants are continuation patterns where a period of consolidation is followed by a breakout used in technical analysis.
It's important to look at the volume in a pennant—the period of consolidation should have a lower volume and the breakouts should occur on a higher volume.
Most traders use pennants in conjunction with other forms of technical analysis that act as confirmation.
>Cup and Handle Pattern
A cup and handle price pattern on a security's price chart is a technical indicator that resembles a cup with a handle, where the cup is in the shape of a "u" and the handle has a slight downward drift.
The cup and handle are considered a bullish signal, with the right-hand side of the pattern typically experiencing lower trading volume. The pattern's formation may be as short as seven weeks or as long as 65 weeks.
>What is a Bullish Flag Pattern
When the prices are in an uptrend a bullish flag pattern shows a slow consolidation lower after an aggressive uptrend.
This indicates that there is more buying pressure moving the prices up than down and indicates that the momentum will continue in an uptrend.
Traders wait for the price to break above the resistance of the consolidation after this pattern is formed to enter the market.
>What is the Bearish Flag Pattern
When the prices are in the downtrend a bearish flag pattern shows a slow consolidation higher after an aggressive downtrend.
This indicates that there is more selling pressure moving the prices down rather than up and indicates that the momentum will continue in a downtrend.
Traders wait for the price to break below the support of the consolidation after this pattern is formed to enter in the short position.
> Channel
A channel chart pattern is characterized as the addition of two parallel lines which act as the zones of support and resistance.
The upper trend line or the resistance connects a series of highs.
The lower trend line or the support connects a series of lows.
Below is the formation of the channel chart pattern:
>Megaphone pattern
The megaphone pattern is a chart pattern. It’s a rough illustration of a price pattern that occurs with regularity in the stock market. Like any chart pattern, there are certain market conditions that tend to follow the formation of the megaphone pattern.
The megaphone pattern is characterized by a series of higher highs and lower lows, which is a marked expansion in volatility:
>What is a ‘diamond’ pattern?
A bearish diamond formation or diamond top is a technical analysis pattern that can be used to detect a reversal following an uptrend; the however bullish diamond pattern or diamond bottom is used to detect a reversal following a downtrend.
This pattern occurs when a strong up-trending price shows a flattening sideways movement over a prolonged period of time that forms a diamond shape.
Detecting reversals is one of the most profitable trading opportunities for technical traders. A successful trader combines these techniques with other technical indicators and other forms of technical analysis to maximize their odds of success.
Technicians using charts search for archetypal price chart patterns, such as the well-known head and shoulders or double top /bottom reversal patterns, study technical indicators, and moving averages and look for forms such as lines of support, resistance, channels and more obscure formations such as flags, pennants, balance days and cup and handle patterns.
Technical analysts also widely use market indicators of many sorts, some of which are mathematical transformations of price, often including up and down the volume, advance/decline data and other inputs. These indicators are used to help assess whether an asset is trending, and if it is, the probability of its direction and of continuation. Technicians also look for relationships between price/ volume indices and market indicators. Examples include the moving average, relative strength index and MACD. Other avenues of study include correlations between changes in Options (implied volatility ) and put/call ratios with a price. Also important are sentiment indicators such as Put/Call ratios, bull/bear ratios, short interest, Implied Volatility, etc.
There are many techniques in technical analysis. Adherents of different techniques (for example Candlestick analysis, the oldest form of technical analysis developed by a Japanese grain trader; Harmonics; Dow theory; and Elliott wave theory) may ignore the other approaches, yet many traders combine elements from more than one technique. Some technical analysts use subjective judgment to decide which pattern(s) a particular instrument reflects at a given time and what the interpretation of that pattern should be. Others employ a strictly mechanical or systematic approach to pattern identification and interpretation.
Contrasting with technical analysis is fundamental analysis, the study of economic factors that influence the way investors price financial markets. Technical analysis holds that prices already reflect all the underlying fundamental factors. Uncovering the trends is what technical indicators are designed to do, although neither technical nor fundamental indicators are perfect. Some traders use technical or fundamental analysis exclusively, while others use both types to make trading decisions.
Trade with care.
If you like our content, please feel free to support our page with a like, comment

Shibausdt ,,, chart patternsWe have two scenarios ahead. On the weekly logarithmic chart, Shiba is under the cloud, and as long as it is under the cloud, I still can't say for sure that it is progressing, but on a daily time frame. , everything is different, but you just have to be careful. , the descent scenario. It's not out of the question, but with the chart going down quickly and coming back up strongly, like before, it's likely.

Psychographic Analysis - Life Cycle of InvestorImagine an investment as a journey with twists and turns. Knowing its different stages is like having a map for investors. It helps them decide if they want a thrilling ride with big potential rewards or a smoother path with steady stability, based on their comfort with risk. For investors, understanding the life cycle is crucial because it directly impacts the investor's risk appetite.
✨Personality characteristics of investors
✨Risk/Return Trade-Offs for Investors:
🔸 Risk/reward trade-offs are related to the relationship that exists between the degree of risk an investor takes and the potential reward for the investment. larger-risk investments have the potential for greater returns, but they also have the potential for greater losses as well. Lower-risk investments, on the other hand, have the potential for lower profits, but also for fewer losses.
🔸 The risk tolerance and investment objectives of investors will change over time. Younger investors who are just starting out are more likely to be on the risk/reward spectrum, willing to take on more risk in exchange for the chance of larger profits. This is because they have a longer time horizon with which to invest and recoup from losses. Investors may grow more risk-averse and migrate to the left side of the spectrum as they near retirement. They may need to start withdrawing from their assets to fund their retirement, so they want to protect their money and avoid large losses.
✨Phases of the Investment Life Cycle:
↪️ Here is a breakdown of the investment life cycle and how risk/reward trade-offs may change at each stage:
1️⃣ Accumulation Phase
In the initial stage, known as the accumulation phase, individuals find themselves with a modest net worth relative to their liabilities. Their investment portfolio tends to be limited and less diversified. Goals often include funding education, purchasing a home, and laying the groundwork for future financial independence. With a long time horizon and potential income growth, investors in this phase can afford to explore high-return, high-risk capital gain-oriented investments.
2️⃣ Consolidation Phase
As individuals progress through their mid-to-late careers, they enter the consolidation phase. Characterized by income surpassing expenses, this period, although still distant from retirement, prompts a shift towards capital preservation. Investors start balancing high capital gain investments with lower-risk assets, creating a more stable and resilient portfolio.
3️⃣ Spending Phase
The spending phase marks a transition when living expenses are no longer sustained by earned income but by accumulated assets, such as investments and retirement funds. With a decreased likelihood of returning to work, stability becomes paramount in the investment portfolio. Preferences shift towards investments generating steady income through dividends, interest, and rentals. Despite the reduced time horizon, some growth-focused investments are retained to hedge against inflation.
4️⃣ Gifting Phase
In the final phase, the gifting phase, investors realize an abundance of assets beyond personal needs. At this juncture, the purpose of investments may evolve, focusing on leaving a lasting legacy or supporting charitable causes.
📊 Importance:
It's like having a guide for your financial journey when you understand the investor life cycle. It assists you in choosing, depending on your comfort level with danger, between an exhilarating, high-risk ride and a more steady, smooth road. Understanding the various investment phases is essential as it influences your willingness to accept risk. It's similar to changing your game plan as you move through different stages of life, such as the exuberant early years and the more measured approach as you near retirement. Put simply, understanding the investor life cycle assists you at every stage in reaching your financial objectives and making wise decisions.
By @Money_Dictators on @TradingView Platform

Imxusdt ,,, Triangle pattern In this 30-minute time chart, we see a nested triangle pattern, which can either go down or up, but it is more likely to go up because One can see the divergence in ( RSI ), which can grow as soon as the trend line breaks. and continue to climb

#CADCHF buying opportunityAs depicted in the chart, the price successfully broke above a range-bound area yesterday. This pattern, known as the "line formation" in Charles Dow's trading strategy, represents the only tradable Daily time frame pattern based on Dow's principles. We are currently waiting for the price to retest the previously broken resistance, with the expectation that it will now act as support.
To maintain our position and adjust our stop loss in line with this bullish trendline, it is essential for the price to remain above our short-term trend.
In order to manage our Risk-to-Reward ratio effectively, we have decided not to initiate a position until the price reaches our designated support level. At that point, we will be on the lookout for bullish price confirmations.
by the way If you've found this analysis helpful, please take a moment to like, comment, or share your thoughts with me.

An obvious and strong position for the ascent of Toncoin...In continuation of the previous analysis (link below) of Toon Coin in today's weekly time frame, this climb becomes active.
With this move, TenCoin can go up to the price of about 4 dollars. Tone Coin seems to work very classically and technically. Because his movements are very patterned and technical.
Let's go to $4...

Bullish Flag Pattern Reversal in ICICIPRULIICICI PRUDUNTUAL LIFE INSURANCE LTD
Key highlights: 💡⚡
📊On 1Day Time Frame Stock Showing Reversal of Bullish Flag Pattern.
📊 It can give movement upto the Reversal target of Above 598+.
📊There have chances of Breakout of Resistance level too.
📊 After Breakout of Resistance level this stock can gives strong upside rally upto above 785+.
📊 Can Go Short in this stock by placing stop loss below 472- or last swing Low.

Descending Triangle Pattern Reversal in SRFSRF LTD
Key highlights: 💡⚡
📊On 1Day Time Frame Stock Showing Reversal of Descending Triangle Pattern.
📊 It can give movement upto the Reversal target of Above 2405+.
📊There have chances of Breakout of Resistance level too.
📊 After Breakout of Resistance level this stock can gives strong upside rally upto above 2890+.
📊 Can Go Long in this stock by placing stop loss below 1930- or last swing Low.

bullish for 60% up move1) very good 2023 Q2 results
2) stock at listed price level
3) results as good news for the stock and sentimental good for this stock
4) sentimental and chart-two combination can give better result
5) 185 level next target in 9-12 month
6) 125 is short-term target
7) no recommendation for buy-and-sell

AUD/CAD ↗️ Long Trade Setup ↗️Hello Everyone 🙋🏽♂️
🔴 0.87555
🟢 0.90485
We are not responsible of any losses for anyone, our trades are profitable more for long terms and we take losses as everyone,
manage your lot size as well and your SL and TP and my opinion is 0.01 lot for each 500 $.
Don't forget to hit the like bottom and write a comment to support us.
Follow us for more 🙋🏻♂️
Best Regard / EMA Trading .
Disclaimer:
----------------
It's not a financial advise, As everyone we take losses sometime but for long term trading we are profitable traders, so manage your account well with SL and TP and your lot size to keep your account safe and stay in the market .

[INTRADAY] #BANKNIFTY PE & CE Levels(02/11/2023) Today will be gap up opening in BANKNIFTY . After opening if banknifty sustain above 42550 level then possible upside rally of 400-500 points upto 42950 Level. And this rally can extend for another 400 points if it gives breakout of 43050 level. Any Major downside only expected in case banknifty starts trading below 42450 level. also possible Reversal Downside 42950 level.

#DXY more bullish outlookHello, everyone. I hope you're all having a great week.
Let's analyze the DXY chart and try to make some predictions for the upcoming week.
Last week, the price was rejected from the important low indicated on the chart and also established a new 4-hour high, as evident in the chart. Consequently, the market structure in the 4-hour time frame is now in alignment with the higher time frame, daily market structure, and they both exhibit a bullish trend.
Given this scenario, our primary interest lies in taking long positions in high-probability trading zones. These zones could be around the short-term low marked with an arrow or during a pullback to the broken short-term bearish trendline.
In the meantime, as we await the price to reach these levels, we will closely monitor the market. Once the price approaches these areas, we will be looking for confirmation signals before considering our trades.

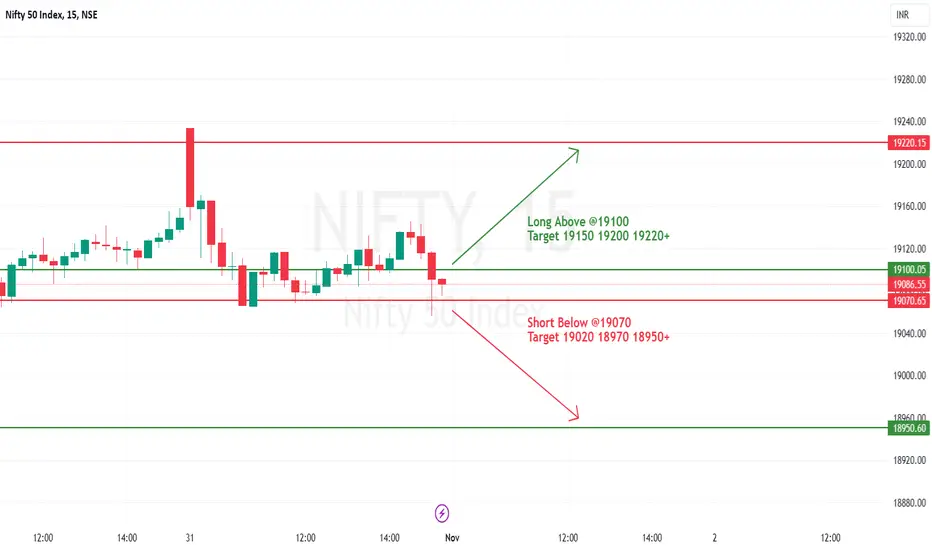
#NIFTY Intraday Support and Resistance Levels - 01/11/2023Nifty will be gap down opening in today's session. After opening nifty start trading below 19070 level and then possible downside rally up to 18950 in today's session. in case nifty trades above 19100 level then the upside target can go up to the 19220 level.
AUD/USD ↗️ Long Trade Setup ↗️ Hello Everyone 🙋🏽♂️
🔴 0.63080
🟢 0.63790
We are not responsible of any losses for anyone, our trades are profitable more for long terms and we take losses as everyone,
manage your lot size as well and your SL and TP and my opinion is 0.01 lot for each 500 $.
Don't forget to hit the like bottom and write a comment to support us.
Follow us for more 🙋🏻♂️
Best Regard / EMA Trading .
Disclaimer:
----------------
It's not a financial advise, As everyone we take losses sometime but for long term trading we are profitable traders, so manage your account well with SL and TP and your lot size to keep your account safe and stay in the market .

#DXY Possible scenarioHello, traders. Let's take a look at the DXY chart and discuss the possible movements of this chart for the next couple of days.
As we know, the price recently broke below an important bullish channel for the first time since July 4th when this major bullish run began.
However, as you can see, it failed to break below the previous low, which has been identified as an important support level. Based on Dow theory, the bullish trend is still intact since we have not violated the most recent lower low.
So, we currently have two conflicting signals. One is bearish due to the breakdown of the long-term bullish channel, while the other is bullish because the price hasn't breached the last low.
Furthermore, following the rejection of the low, the price moved higher impulsively, suggesting that buyers are still active. This is another bullish indication. However, the formation of a descending triangle chart pattern, which is bearish in nature, provides a mixed signal.
For trading and as a personal opinion, the current price area may not be the best entry point into the market. Additionally, any upside breakout of the triangle chart pattern could potentially be a false breakout and may not be an optimal trading opportunity. However, if the price retraces lower to test the previous low and fails to break below it, we might consider taking a long position on the US dollar.
If you've found this analysis helpful, please take a moment to like, comment, or share your thoughts with me.

#NIFTY Intraday Support and Resistance Levels - 30/10/2023Nifty will be gap up opening in today's session. After opening nifty sustain above 19080 level and then possible upside rally up to 19200 in today's session. in case nifty trades below 19030 level then the downside target can go up to the 18910 level.

in INJ BULL FLAG making. 1H TFin 1 hour time frame as you can see clearly making BULL FLAG on 1 hour time frame.

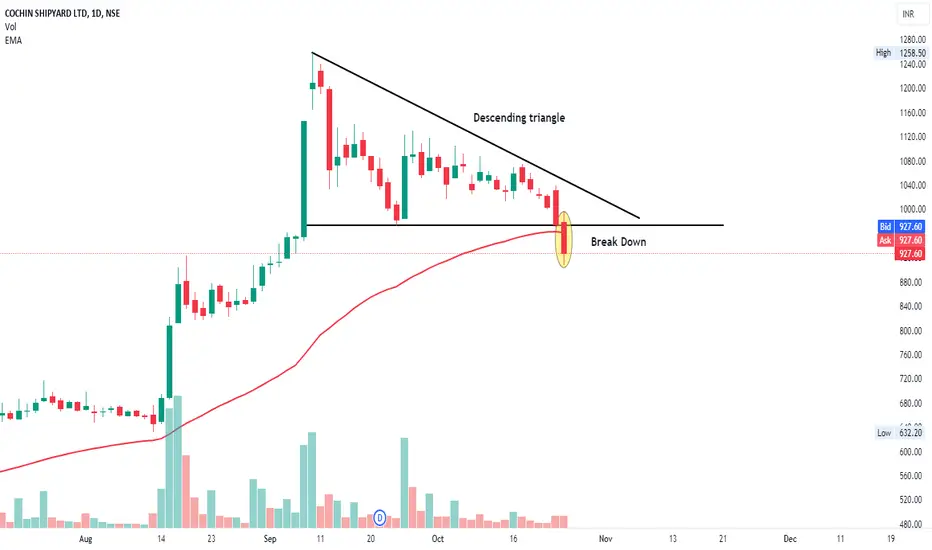
COCHINSHIP BREAK DOWNCOCHINSHIP BREAK DOWN
1. Descending triangle
2. Support Breakout
3.Below The 50EMA
TV18 BROADCAST breakodownTV18 BROADCAST breakodown
1. Descending Triange
2. Volume Buildup
3.Neck brakdown

EUR/USD (D1) : SETUP SELL - Oct.04Hello Traders,
🔹EU was broked down the strong support zone, trend will be continuously
🔹My target for short entry is RR= 1:2
You can short when price pullback to support before (now it is new resistance)
Manage your capital correctly and carefull,
Goodluck to you !

[INTRADAY] #BANKNIFTY PE & CE Levels(10/10/2023) Today will be gap up opening in BANKNIFTY . After opening if banknifty sustain above 44050 level then possible upside rally of 400-500 points upto 44450 Level.Any Major downside only expected in case banknifty starts trading below 43950 level.

AMD Daily timeframeafter valid breakout from wedge patern in daily timeframe with candle we can enter to long position with 4 risk to reward that its good
maybe price want to meet trend line again.. pay attention to this
good luck
