AUDUSD > Perfect Setup for Buy Entry!!Analysis of #AUDUSD
Hi traders, today we will have a look at #AUDUSD
The AUDUSD might be forming a perfect setup for a buy entry, as you can see we have an uptrend, and now the market might be coming to test its trendline support, near 0.6450.
Also, we have a possible bullish harmonic bat pattern that might complete the D leg also near my trendline support, which is one of my favorite ways to use harmonic patterns.
as you can see if the market comes to test trendline support it will complete the D leg for my Bat pattern, which will be a very good reason to enter buy trade if the rules are met
I hope you guys found this helpful, if you are new here click on follow, to get these ideas delivered straight to your email inbox, I will see you guys at the next one
Thanks for your continued support!
Chartpattren

ADAUSDT ShortTime Frame: 4H
Symbol: ADAUSDT
Entry: 0.3149
TP: 0.3013
SL: 0.3277
Bias: Short
From our experience of the crypto market , we can assume that there is a little expectation of a major price move. Price will more or less oscillate between extreme ranges as per our short term prediction.

ADAUSDT ShortTime Frame: 4H
Symbol: ADAUSDT
Entry: 0.3112
TP: 0.2983
SL: 0.3196
Bias: Short
The range-bound crypto pairs are signifying a neutral bias in nine out of ten cases. However, we are interested in some short term opportunities as we have projected our trading plan .

EURUSD > Double top, might see further move downAnalysis of #EURUSD
Hi traders, today we will have a look at #EURUSD
The EURUSD yesterday tried to break out to the upside only to fail and close back below the previous structure high, and not we can consider this a double top.
now I expect the market to keep moving down as explained in my previous analysis to test its key market support level near 1.0100, which will be an excellent level to buy if the market reaches this level
I hope you guys found this helpful, if you are new here click on follow, to get these ideas delivered straight to your email inbox, I will see you guys at the next one
Thanks for your continued support!

GBPUSD > The Market Might Continue Down!Analysis of #GBPUSD
Hi traders, today we will have a look at #GBPUSD
The GBPUSD broke out of this consolidating wedge pattern, I am expecting the market to keep on falling down to test the support level near 1.16500-1.1600
I am watching the market to see if i can get in a sell trade to target the next level of support.
I hope you guys found this helpful, if you are new here click on follow, to get these ideas delivered straight to your email inbox, I will see you guys at the next one
Thanks for your continued support!

RELIANCE WILL BE BOOM?????I have shared my view looks very bullish, What do you think guys do comment.

ADAUSDT ShortTime Frame: 4H
Symbol: ADAUSDT
Entry: 0.3051
TP: 0.2888
SL: 0.3164
Bias: Short
For this instrument our bias is bearish. We are looking for a selling trade opportunity.

ADAUSDT ShortTime Frame: 4H
Symbol: ADAUSDT
Entry: 0.3107
TP: 0.2845
SL: 0.3303
Bias: Short
This pair will drop further and the selling spree is in favor. We can sell.

ADAUSDT ShortTime Frame: 4H
Symbol: ADAUSDT
Entry: 0.3144
TP: 0.2893
SL: 0.3316
Bias: Short
For crypto pairs we have a neutral bias in most cases .However, in some areas we have projected long and some areas short depending upon the overall short time market impetus and inclination.

ADAUSDT LongTime Frame: 4H
Symbol: ADAUSDT
Entry: 0.3165
TP: 0.3383
SL: 0.2984
Bias: Long
For this instrument our bias is long and we expect a bullish opportunity from the current price context.

GBPUSDAfter Breaking Above 1.1750 RESISTANCE, GBPUSD Started to consolidate and confirmated this break as new suppport twice Now the pair looc ready for up continuation and it can rise to the next important resistance arount 1.22. I'm bullish as long as support it intact and buy dips against this level could be a good strategy with a very good R:R
Talha Shaheen

GBPUSD > Beautiful Bearish Harmonic Bat Pattern!! Analysis of #GBPUSD
Hi traders, today we will have a look at #GBPUSD
The GBPUSD might be forming this beautiful bearish harmonic bat pattern on the lower time frame, if someone is into day trading this is a good setup I will say, however I may or may not take it, depending on how the market arrives at the resistance zone or the D leg completion.
I hope you guys found this helpful, if you are new here click on follow, to get these ideas delivered straight to your email inbox, I will see you guys at the next one
Thanks for your continued support!

AUDUSD > Interesting Buy Entry for A Good RRR!! Analysis of #AUDUSD
Hi traders, today we will have a look at #AUDUSD
The AUDUSD previously had this reversal pattern which looks like a bullish head and shoulders to me, as you can see the market broke the neckline resistance and now might be coming to visit the zone again
as you know this area now will act as a support level for AUDUSD and could be a very good zone to start looking for a buy entry depending on how the market will get there
I hope you guys found this helpful, if you are new here click on follow, to get these ideas delivered straight to your email inbox, I will see you guys at the next one
Thanks for your continued support!

EURUSD > Still Looking for A Buy Entry!! Following up #EURUSD
Hi traders, today we will have a look at #EURUSD
the EURUSD moved as predicted in my previous idea "you can check it following the link below", and still moving to the downside to test its previous resistance zone which now has become a support zone.
the market might visit the zone near 1.0100, and if it did that will be looking for a vailed buy entry to get in abuy trade for possible continuation to the upside.
I hope you guys found this helpful, if you are new here click on follow, to get these ideas delivered straight to your email inbox, I will see you guys at the next one
Thanks for your continued support!

ADAUSDT ShortTime Frame: 4H
Symbol: ADAUSDT
Entry: 0.3024
TP: 0.2748
SL: 0.3178
Bias: Short
Recent price study exposes a positive expectation for pairs that run counter to United States Dollar. As we see the strength of dollar is in a declining mode and considering the scope of dollar price changes , the other currencies are oscillating accordingly.

ADAUSDT ShortTime Frame: 4H
Symbol: ADAUSDT
Entry: 0.3040
TP: 0.2702
SL: 0.3232
Bias: Short
For crypto we anticipate shorting opportunity. Our bias is bearish considering the current price study , we believe that the overall propensity of crypto price will remain bearish.

GOLD - H&S confirmed? As it is the case with all USD pairs, Gold is no different. A Sharp rise, multiple rejections then a downtrend.
Looking at the 4hrs chart we see a Head and Shoulders bearish pattern formed and confirmed after breaking below the neckline. Considering that DXY is likely going to confirm an Inverse H$S we see Gold continuing bearish momentum:
1) Testing 100MA at 1731.5 - if it did not rebound then 2 & 3 as well.
2) Pullback to Fibo levels
3) Testing the demand zone between 1703 & 1713
Love, Lacasafxfamily

ADAUSDT ShortTime Frame: 4H
Symbol: ADAUSDT
Entry: 0.3318
TP: 0.3048
SL: 0.3509
Bias: Short
We are bearish for this pair. There is a high probability of a strong price fall following by the current price oscillations that we have seen recently.

XAUUSD > The Best Place for A Buy!!Analysis of #GOLD
Hi traders, today we will have a look at #XAUUSD
the GOLD performed in line with the fundamental news we got recently about CPI, PPI, I still expect this move to continue to the upside, but the market needs to calm down and find more buyers, so expect a somewhat short-term move to the downside.
As you can see on my chart, we previously had a solid key market resistance near 1720-1730,
I do believe if the market reaches back to test this zone we will see a bullish reaction where I will drop a one-time frame looking for a buy entry with a good reward to risk if the rules are met.
I hope you guys found this helpful, if you are new here click on follow, to get these ideas delivered straight to your email inbox, I will see you guys at the next one
Thanks for your continued support!

EURUSD > You Dont Want to Miss out On These Levels!!Analysis of #EURUSD
Hi traders, today we will have a look at #EURUSD
the EURUSD was not able to close above 1.0500 as you can see on my chart, while I still believe the EURUSD has more room to the upside I think in the short term we can see EURUSD falling back to test its support level near 1.0500-1.0100.
looking at the chart you can see the zone I highlighted newer 1.0500-1.0100 represents the previous resistance which I expect will be good support for the EURUSD.
if the market reaches my support zone I will drop a one-time frame looking for valid reversal patterns or harmonic patterns together in a buy trade with good reward to risk if the rules are met.
I hope you guys found this helpful, if you are new here click on follow, to get these ideas delivered straight to your email inbox, I will see you guys at the next one
Thanks for your continued support!

ADAUSDT ShortTime Frame: 4H
Symbol: ADAUSDT
Entry: 0.3233
TP: 0.2980
SL: 0.3400
Bias: Short
We have no major directional bias. Dollar will remain strong in spite of all difficulties. We assume that the dollar will strengthen further and the other currencies related to it will decline in recent weeks.

Ethusdt short update : 451usdt, 21% profit ✅we can short ethereum after its upward correction
i think this market goes to touch lower rate.
be care about long position on crypto market.
trade actived, risk free your trade and wait to get a good porofit guys.

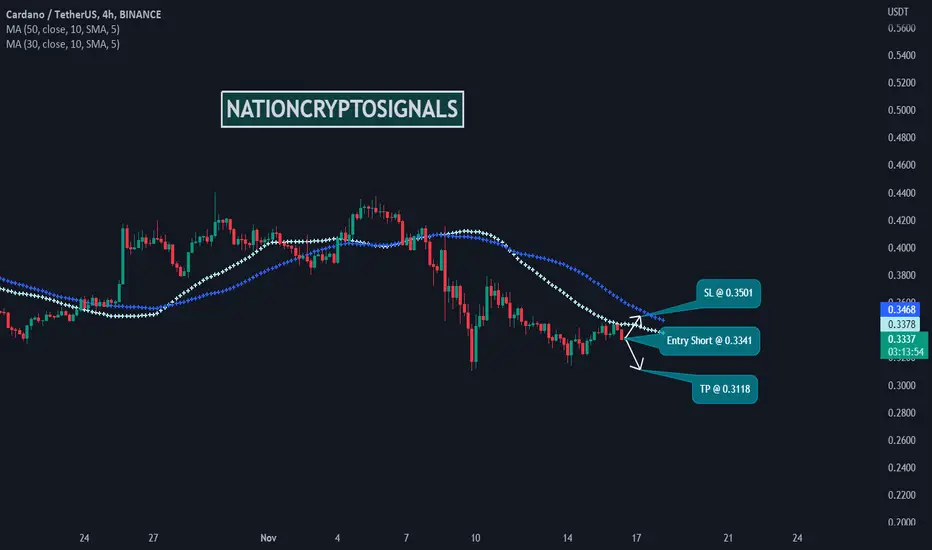
ADAUSDT ShortTime Frame: 4H
Symbol: ADAUSDT
Entry: 0.3341
TP: 0.3118
SL: 0.3501
Bias: Short
Crypto pairs are in constant drive for a bearish price trajectory. As we see the price pattern is oscillating between dynamic support and resistance for several weeks in same range , we have projected our set ups according to our expectation from the ranges.