GER40 > In-Depth Detailed Analysis Of Best Levels to Buy!!Analysis of #GER40
The GER40 is pushing down after the FED's hawkish comments from yesterday, not to mention today's hawkish comment from ECB president Lagarde.
as you can see on my chart I have highlighted three spots where I think the german index will correct, by simply using the FIB extension and seeing if it correlated with another level of interest.
>> - The first level is near the 13000 key market level, as you can see it fib 0.618 extensions, and the previous swing high and trendline support.
>> - The second level is near the 12874 key market level and the previous structure support level, also very important fib 1:1 extensions.
>> - The third level is near 12621, trendline support, previous swing low, structure support, and fib very important level 1.618 extension
Thanks for your continued support!
Chartpattren

NZDJPY Daily, will go upRisk reward ratio at picture is not good.
Yeah really not good.
But i think it's big opportunities to get reach the target, minimum TP1.

Slope breakdown. Active coin, large volumesThe asset fell for a long time. Got a little selling. A strong inclined level has also formed, which the price has impulsively broken through and is trying to gain a foothold. Volumes are rising. There are grounds for a reversal. I expect a retest of the incline and movement towards the marked targets.

EURNZD > A Nice Bullish Harmonic Gartley Pattern!!Analysis of #EURNZD
Analysis of #EURNZD
The EURNZD formed a nice bullish harmonic Gartley pattern and now it's at good entry points, but I was hoping to get in this trade yesterday and exist it today, sadly the confirmation was very late
today we have the FED rate decision, and it is all about the press conference and what are the projections for December, so maybe I will look at this spatter tonight after the FED is done.
stay safe
Thanks for your continued support!

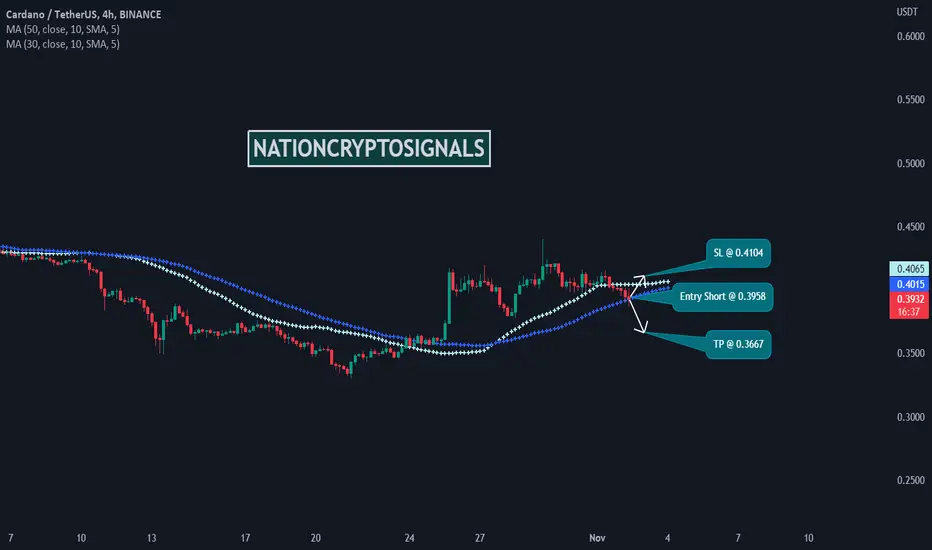
ADAUSDT ShortTime Frame: 4H
Symbol: ADAUSDT
Entry: 0.3958
TP: 0.3667
SL: 0.4104
Bias: Short
The current price pattern of the forex pair is denoting a paradigm shift because of recent price fluctuation. The study of recent support and resistance proves that the course of price action will abide by our projected trajectory.
GBPUSD > Trading Plan, for Buy and SellAnalysis of #GBPUSD
The GBPUSD is on an uptrend after the recent events that happened, I suspect the pound is running out of steam.
Looking at my chart I have highlighted 2 important levels for sell and buy, as you can see
we have an important key market resistance level near 1.1800, a good level to start looking for a sell entry.
On the other hand, we have a strong shelve support level near 1.1400 also trendline support where I believe we will see traders coming back to the market to buy the GBPUS, which would be a good buy entry
Thanks for your continued support!

ADAUSDT ShortTime Frame: 4H
Symbol: ADAUSDT
Entry: 0.4081
TP: 0.3823
SL: 0.4347
Bias: Short
For this instrument our goal is to capitalize from the narrow range. We strongly believe that history repeats itself and there will be no exception here.

EURUSD > Trading plan ahead of FOMC!!Analysis of #EURUSD
The EURUSD moved as predicted in my last idea as you can see if you checked the link on my chart or below this idea.
Now the EURUSD is in the middle, between trendline support, and tend line resistance, for me, I will now stay on the sideline and watch the market.
>> if the market comes and tests the resistance trendline, I will look for a sell.
>> if the market comes and tests support trendline will look for a buy
Thanks for your continued support!

ADAUSDT ShortTime Frame: 4H
Symbol: ADAUSDT
Entry: 0.4138
TP: 0.3885
SL: 0.4339
Bias: Short
The crypto pairs are narrowed down by lack of momentum and volatility recently. However we see some clear price actions last week which signify a sharp up and down swings in various crypto pairs due to some fundamental and technical factors.

GBPNZD > Possible head and shoulders pattern!!Analysis of #GBPNZD
The GBPNZD might be forming a bearish head and shoulders pattern, it is still early to say, but we can set an alert and wait and see.
if the market indeed formed a head and shoulders pattern and broke neckline resistance, we can drop a one-time frame and look for a trend continuation pattern to get in a buy trade targeting the next level of support
Thanks for your continued support!

NZDUSD > Classic Simple Trendline Buy Entry!!Analysis of #NZDUSD
The NZDUSD is not in an uptrend against the dollar and we can expect this trend to continue in the short term, that is why I am looking for a buy entry here.
as you can see on my chart we have clearly defined trendline support and trendline resistance which has been tested many times before.
if the market comes and tests my trendline support I will drop a one-time frame and look for a valid response to get a buy trade, for example, double, bottom, head, and shoulder pattern, or harmonic pattern to use as a reason to buy the market
Thanks for your continued support!

Nifty 50 As Predicted Wave C Based on my previous Nifty 50 chart,
As I predicted Wave C has almost reached close to Fib Retracement 1.272 level. We have to keep in mind that India Vix at its very low, I don't think wave C could make more than 18000 level.
Hope you traders will like it. Thanks for viewing ":-)

EURUSD > The Best Place for Buy Entry!!Analysis of #EURUSD
if you have been following my analysis on EURUSD you know I have predicted the breakout and the move to the upside.
as you see the market now coming to test its previous trendline resistance which is now become a support trendline level.
the market now might come to test its support zone near 0.9900, also the previous swing high, which also was a resistance zone.
if the EURUSD drop to test my support \ demand zone I will drop don't time frame look for bullish confirmation before committing to a buy trade that meets my rules
Thanks for your continued support!

NAS100 > Possible Bullish Head and Shoulders Pattern!!Analysis of #US100
The NASDAQ is forming the second shoulder in a bullish head and shoulders pattern, which could be the start of a bottoming process.
The Aggressive Entry Would Be to Enter Now in A Small Position with A Stop Below the Head.
The Better and More Conservative Entry Is to Sit and Wait for A Confirmation of Breaking the Neckline Resistance Then Look for A Trend Continuation Setup for Targeting the Next Level of Resistance Near 12800.
Thanks for your continued support!

EURJPY > Possible Move to Move to The Downisde!!Analysis of #EURJPY
The EURJPY tested its trendline resistance and now moving to the downside, still not a lot of interest in buying yen at this point, but we can expect the market to start moving to the downside very fast if we start getting signs of a weak dollar.
I am waiting for confirmation to get into a small sell trader if the rules for entry are met
Thanks for your continued support!

ADAUSDT ShortTime Frame: 4H
Symbol: ADAUSDT
Entry: 0.3839
TP: 0.3579
SL: 0.4013
Bias: Short
We are bearish for this instrument. The dynamic resistance is strong and therefore a price drop can be expected.


ADAUSDT ShortTime Frame: 4H
Symbol: ADAUSDT
Entry: 0.4067
TP: 0.3825
SL: 0.4249
Bias: Short
Due to some fundamental factors the crypto pairs have seen a spree in price movement. Though there is no explicit bias today we have planned our trading bias according to given chart projection.

XAUUSD > Bullish Head and Shoulders Pattern!!Analysis of #XAUUSD
The GOLD formed a bullish head and shoulders pattern, if gold breaks the neckline resistance,
I expect the gold to keep on going up to test its trendline resistance near 1680-1685.
if the market indeed continues up to test resistance, we can look for a sell on the lower time frame if the rules for entry are met.
Thanks for your continued support!

US30 > What Do I Expect Next for The Dow!?Analysis of #US30
The US30 may soon test its strong bearish structure resistance level and strong demand zoon near 32488-32500, where the market fell almost 12.50%.
if the market my structure resistance zone we can wait for bearish confirmation on the lower timeframe before getting n a sell trade if the rules for entry are met.
Thanks for your continued support!

AUDCHF > Possible Move to The Downside from Here!!Analysis of #AUDCHF
The AUDCHF is near its trendline resistance presenting us with an excellent bearish opportunity for a sell trade near the strong key market level of 0.8800.
I am already in a sell trade on another Aussie pair, so I am not considering getting in here but I predict a possible bearish move to target the next level of support
Thanks for your continued support!

ADAUSDT ShortTime Frame: 4H
Symbol: ADAUSDT
Entry: 0.4032
TP: 0.3754
SL: 0.4197
Bias: Short
For the crypto related instruments we think of a bearish bias as the short bullish tempo will decline and create a good selling opportunity in the end. Any sudden price drive is always inundated by reverse moves all the time.

AUDCHF > Bearish Harmonic Bat Pattern!!Analysis of #AUDCHF
The AUDCHF is forming a bearish harmonic bat pattern that might complete near a strong supply zone to provide a reason to get in a sell entry if the rules for entry are met.
Thanks for your continued support!
