Gold (XAU/USD) Bearish Outlook: Key Levels to WatchBuddy'S dear friend SMC Trading Signals Update 🗾 🗺️
This chart represents the price action of Gold (XAU/USD) on a 1-hour timeframe, showing potential areas of resistance, support, and liquidity zones. Here’s a breakdown of the analysis:
Analysis of the Chart:
1. Resistance Level (3,023-3,030 zone)
The price has reacted multiple times (red arrows), indicating strong selling pressure.
A fair value gap (FVG) is present, suggesting potential mitigation before further movement.
2. Current Price (3,011.76)
The price is trending downward after rejecting the resistance level.
It is approaching the diamond zone, a potential short-term support before continuation.
3. Key Support Levels:
Diamond Zone (~3,000 region)
Could cause a temporary bounce before further decline.
Order Block (~2,952-2,938 zone)
This is a strong demand zone and a potential target area for price action.
4. Target Levels:
The analyst expects a downward move toward 2,952, aligning with a liquidity grab scenario.
5. RSI Indicator:
RSI is at 44.27, suggesting bearish momentum, with the possibility of further downside.
A break below 40 RSI may confirm more selling pressure.
Mr SMC Trading point
Risk Management Considerations:
Entry: A possible short entry could be around the FVG level (~3,020-3,030) if price retraces.
Stop Loss: Above 3,035 to avoid being trapped in a fake breakout.
Take Profit: Around 2,952-2,938 as per the target point.
USD Update & Impact on Gold:
If USD strengthens, gold may drop further due to their inverse correlation.
Key upcoming economic data (interest rate decisions, inflation reports) could increase volatility.
Pales support boost 🚀 analysis follow)
Chartpattren

USD/JPY Bullish Outlook – Targeting Key Resistance at 150.155USD/JPY Technical Analysis – Bullish Outlook Toward Resistance
Chart Insights:
The price is currently in a recovery phase after a significant drop.
A Fair Value Gap (FVG) zone has been identified, suggesting a potential pullback before further movement.
The target point aligns with the resistance level around 150.155, which acts as a key supply zone.
Potential Scenario:
Price may retrace into the FVG zone around 148.704 – 148.956.
A bullish rebound from this level could drive price toward the resistance at 150.155.
If price reaches the resistance level, further rejection or continuation will depend on market conditions.
Key Levels:
Support Zone: 148.167 – 148.315
FVG Area: 148.704 – 148.956
Resistance Zone: 150.007 – 150.155 (Target area)
Conclusion:
The current structure suggests a bullish bias if price respects the FVG zone for a push higher. However, a break below the FVG could signal further downside movement.

This chart represents a Bitcoin (BTC/USD) price analysis on a 30This chart represents a Bitcoin (BTC/USD) price analysis on a 30-minute timeframe. Here’s a breakdown of the key elements:
Supply Zone (Resistance) at ~$85,599
The price has approached this supply zone, which could act as a resistance level.
The expectation is that the price may struggle to break above this level and could reverse downward.
Demand Zone (Support) at ~$81,500 - $81,755
This is labeled as the "diamond zone," which could act as a strong support area where buying interest may emerge.
The price is anticipated to decline towards this level.
Projected Price Movement
The blue arrows suggest a bearish scenario.
The price might initially react to the supply zone, then break below the trendline, confirming a downtrend.
The target for this downward move is the demand zone around $81,500.
Trendline Break
A rising trendline is drawn, which currently acts as support.
If the price breaks below it, it would confirm a bearish momentum shift.
Conclusion
This chart suggests a short-selling opportunity near the supply zone, targeting the demand zone. However, traders should watch for confirmations such as a rejection from resistance and a break below the trendline before entering a trade.

#VANAUSDT is forming a confident bounce from key levels📉 LONG BYBIT:VANAUSDT.P from $8.180
🛡 Stop loss $8.000
1H timeframe
❗️Before entering the trade, closely monitor the levels. If the price consolidates above $8.180 with volume, this confirms the entry signal.
✅ Overview BYBIT:VANAUSDT.P :
➡️ On the chart, we can see that after a downward movement, the price formed a local bottom around $8.000, followed by an upward impulse.
➡️ A structure resembling a reversal pattern has appeared: the price broke through a slanted resistance (blue line) and consolidated above $8.180, indicating weakening sellers.
➡️ The price is now moving toward a resistance zone marked as POC (Point of Control) at $8.353, which could be the first target.
➡️ The entry is set at $8.180, aligning with the breakout level, supported by increasing volume and a short-term uptrend.
The volume profile on the left shows a low-liquidity zone above the current price (between $8.345 and $8.590), which may allow the price to quickly reach the TP levels.
🎯 TP Targets:
💎 TP 1: $8.345
💎 TP 2: $8.590
💎 TP 3: $8.775
⚡️ Plan:
➡️ Monitor the price reaction at TP1 ($8.345) — a pullback is possible. It’s recommended to close part of the position.
➡️ Wait for confirmation of the breakout above $8.180 (already happened, price is above).
➡️ Enter LONG after a retest (with volume) — in this case, the retest has already occurred, and the price is moving up.
➡️ Place the stop below the last low — at $8.000.
BYBIT:VANAUSDT.P is forming a confident bounce from key levels, and if it holds above the entry zone, we expect an upward movement!

GBPUSD Selling Opportunities SpottedWe are basically anticipating for more selling momentum as price formed a wedge at a resistance level. Also, lower timeframe price action shows more bearish activities.

BTCUSDT TRDAING POINT UPDATE > READ THE CHAPTIAN Buddy'S dear friend
SMC Trading Signals Update 🗾🗺️ crypto Traders SMC-Trading Point update you on New technical analysis setup for crypto BTC USDT list time post signals 💯 reached target 🎯✔️ New technical analysis Setup two said fisrt make close above ground that expect bullish trend 🚀 target point 88k 90k. Next patterns if close below 👇 ⬇️ 83k 80k strong 💪 support level up trand target point 88k 90k fisrt entry risk 🙏. Good luck 💯💯
Key Resistance level 87k + 80k + 90k
Key Support level 83k - 80k
Mr SMC Trading point
Pales support boost 🚀 analysis follow)

EUROUSD TRADING POINT UPDATE > READ THE CHAPTIAN Buddy'S dear friend
SMC Trading Signals Update 🗾🗺️ Euro USD Traders SMC-Trading Point update you on New technical analysis setup for Euro USD ) Euro USD Technical patterns support level pullback up trend 📈🚀 1.08254 strong 🪨 support level target 🎯 point Resistance level 1.09580 good luck 💯💯
Key Resistance level 1.09580
Key Support 1.08254
Mr SMC Trading point
Palee support boost 🚀 analysis follow)

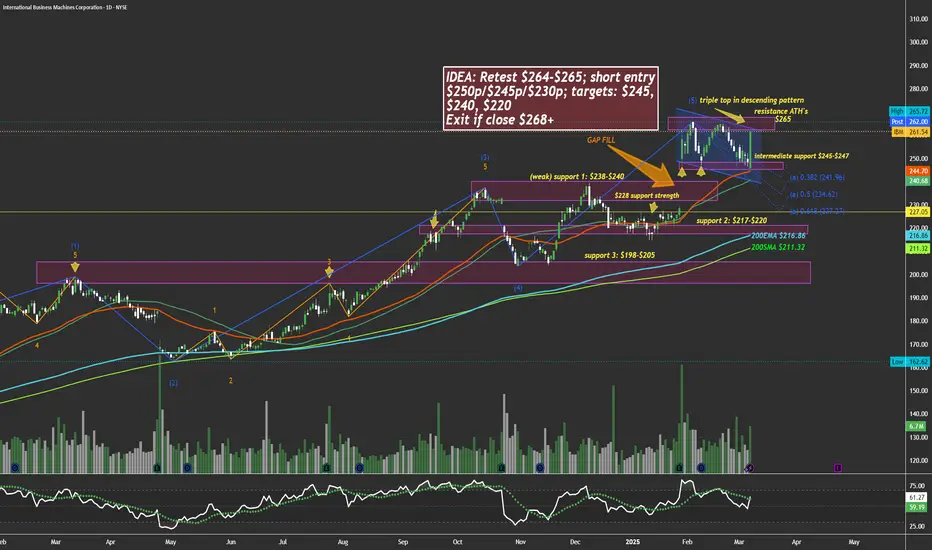
$IBM too hot, due for a chillHi, constructed a chart here showing many levels. I personally think NYSE:IBM will face some downside weeks to come. My trade plan is written in the idea box. The two lines that aren't labeled are 50ema and 50sma.
WSL
GOLD TRADING POINT UPDATE > READ THE CHAPTIAN Buddy'S dear friend
SMC Trading Signals Update 🗾🗺️ Gold Traders SMC-Trading Point update you on New technical analysis setup for Gold 🪙 list time post signals 💯 reached target point 3059. ). Analysis update on gold. Gold look 👀 patterns chart 📉 sellers recover and strong 💪. 30M time frame 🖼️ looking short trend 📉 target 🎯 point 3001 that entry buying said good luck 💯
Key Resistance level 3042 + 3046
Key Support level 3006 - 3001
Mr SMC Trading point
Palee support boost 🚀 analysis follow)

Gold/EUR (XAU/EUR) – Bearish Reversal Zone IdentifiedThis Gold to Euro (XAU/EUR) 4-hour chart shows a breakout from a descending channel, followed by a strong bullish rally. The price has now reached a key resistance zone, where sellers might step in to push prices lower.
Key Observations:
Downtrend Channel Breakout: The price was previously moving in a downward sloping channel but has now broken out, signaling bullish momentum.
Resistance Zone: The price is currently testing a significant resistance level, indicated by the marked "Sell" area.
Potential Reversal: If selling pressure increases at this resistance, we could see a price decline toward the identified target support zones.
Key Support Levels:
First Target Zone: Around 2,750 EUR
Second Target Zone: Near 2,675 EUR
Trading Plan:
Sell Setup: Look for bearish confirmation (such as rejection wicks or a lower high formation) before entering a short position.
Stop Loss: Above the resistance zone to avoid false breakouts.
Take Profit: Based on the highlighted support areas.
If bulls continue pushing beyond resistance, it could invalidate the sell setup, leading to further upside movement. Traders should monitor price action closely for confirmation.

JPY/USD Breakout from Falling Channel – Bullish Trading SetupOverview of the Chart:
The Japanese Yen (JPY) against the U.S. Dollar (USD) 1-hour chart showcases a well-defined market structure, transitioning from a downtrend within a falling channel to a breakout with bullish momentum. The chart highlights critical support and resistance levels, a confirmed breakout, and a forecasted price movement that could indicate further bullish continuation.
This analysis will break down the chart patterns, technical indicators, and potential trade setups, providing a professional outlook on price action behavior.
Technical Breakdown of the Chart
1. Falling Channel Pattern – Downtrend Phase
The price had been trading within a descending channel, marked by two parallel trendlines (blue lines), indicating a controlled downtrend.
A falling channel is a bullish reversal pattern, as it signals that bearish momentum is weakening.
Within the channel, price action consistently created lower highs and lower lows, adhering to the structure of the pattern.
The red dashed trendline inside the channel acted as a dynamic resistance, rejecting price movements multiple times before the breakout.
📌 Key Observation: The falling channel pattern suggests accumulation, where selling pressure gradually diminishes, paving the way for a bullish reversal.
2. Support Zone & Bullish Breakout
The price eventually reached a strong horizontal support level (highlighted blue zone at the bottom), which acted as a critical demand area.
This support level had previously led to strong rebounds, making it a significant zone for potential reversals.
Bullish breakout confirmation:
A strong bullish candle closed above the upper boundary of the channel, breaking the trendline resistance.
The breakout suggests a shift in market structure from a downtrend to an uptrend, as buyers regained control.
The price has now moved above the previous resistance, confirming the bullish momentum.
📌 Key Takeaway: The breakout is a strong signal that sellers have lost control, and a potential bullish trend could emerge.
3. Resistance Zone – Key Barrier for Buyers
The next area of interest is the resistance level (highlighted in a blue rectangular zone).
This level has historically acted as a strong supply zone, where price previously struggled to break through.
If the price manages to sustain above this level, it would confirm bullish continuation toward higher price targets.
📌 Technical View: If buyers break past this resistance, it could lead to a strong bullish rally, reinforcing the new uptrend.
4. Target Projection & Forecasted Price Movement
The chart outlines a forecasted bullish path using a zigzag projection (black lines). Here’s the expected price action:
Short-Term Movement:
Price might face temporary resistance near the blue resistance zone.
A minor pullback or consolidation in this area is expected before further movement.
Retest of Support:
If price pulls back, it could retest the broken channel resistance or the support zone.
A successful retest and bounce would validate the strength of the breakout.
Bullish Continuation:
If the resistance zone is broken, price is likely to continue toward the target level of 0.006842, a previous swing high.
This level acts as the final upside target based on historical resistance levels.
📌 Key Insight: The market structure suggests that price will follow a higher-high, higher-low pattern, which is characteristic of an uptrend.

Silver (XAG/USD) – Rising Wedge Breakdown & Bearish ContinuationTechnical Analysis & Market Outlook
The Silver (XAG/USD) 1-hour chart presents a clear rising wedge formation, a well-recognized bearish reversal pattern. This formation develops when price action creates higher highs and higher lows within a contracting range, signaling a potential exhaustion of bullish momentum.
Currently, Silver has broken below the lower trendline of the wedge, confirming a bearish breakout. This move suggests that the recent uptrend is weakening, and sellers are beginning to take control. A retest of the broken support level as new resistance could provide an ideal entry for a short position.
Key Technical Levels & Trading Plan
1️⃣ Resistance & Supply Zone: 34.00 - 34.20
Price has struggled to break above this region multiple times, confirming strong selling pressure.
The market rejected this level sharply, leading to the current downside movement.
A stop-loss can be placed slightly above this zone to protect against unexpected reversals.
2️⃣ Support Level & Retest Zone: 33.50
Previously, this level acted as a strong support, but the breakdown confirms a shift in market structure.
If price retests this level and faces rejection, it could serve as an optimal entry point for short trades.
3️⃣ Short Entry Confirmation
Traders should look for price rejection from the 33.50 zone before entering a short position.
A bearish candlestick pattern (e.g., bearish engulfing, pin bar, or a lower high formation) would further validate the entry.
4️⃣ Bearish Target: 31.90 - 32.00
The projected downside move aligns with the measured move of the wedge breakdown and previous support zones.
If price maintains bearish momentum, further downside potential exists beyond this target.
5️⃣ Stop-Loss Placement: Above 34.20
Setting a stop-loss above the recent resistance ensures protection against invalidation of the bearish setup.
This placement accounts for potential price spikes or false breakouts.
Trade Execution Strategy:
📌 Entry: Short on a retest of the 33.50 level, ensuring confirmation via price rejection.
📌 Stop-Loss: Above 34.20 to avoid premature stop-outs.
📌 Take-Profit: Targeting the 31.90 - 32.00 zone for an optimal risk-to-reward ratio.
Conclusion & Risk Management:
The breakdown from the rising wedge signals a shift in market sentiment, favoring a bearish move. Traders should remain patient for a retest of broken support to confirm the validity of the trade. Proper risk management with a well-placed stop-loss and a defined target ensures controlled exposure to market fluctuations.
📊 Overall Bias: Bearish 📉
🔍 Key Watch Areas: Retest of 33.50 for Short Confirmation

EUR/GBP Bearish Trading Setup | Resistance Rejection & BreakdownMarket Context & Overview
The EUR/GBP currency pair is currently showing signs of bearish momentum, as illustrated in this 1-hour trading chart. The price is facing a strong resistance zone while forming a descending trendline, indicating that sellers are gaining control over the market. Given this technical setup, traders can anticipate a potential breakdown leading to further downside movement.
This analysis highlights key price levels, technical indicators, and potential trade opportunities based on current price action. The bearish outlook is supported by the market structure, which is displaying signs of a potential trend reversal from the resistance zone.
🔹 Key Technical Levels
1️⃣ Resistance Zone (0.84200 - 0.84300)
This area has acted as a strong selling zone in previous price action.
Multiple rejection points indicate that buyers are struggling to push beyond this level.
This resistance aligns with the descending trendline, further strengthening the bearish bias.
2️⃣ Support Level (0.84000)
The current support level has provided temporary demand, preventing immediate downside movement.
If the price breaks below this support, it will confirm a bearish continuation.
3️⃣ Major Resistance Zone (0.84495)
This is the all-time high resistance zone in the short-term structure.
A break above this level would invalidate the bearish setup and could lead to bullish momentum.
4️⃣ Target Level (0.83735)
If the price successfully breaks below 0.84000, the next target would be 0.83735.
This level aligns with previous swing lows, making it a realistic downside target for short positions.
5️⃣ Stop Loss Placement (Above 0.84201)
A stop-loss above 0.84201 ensures protection against false breakouts.
If price breaks above this level, it could signal a shift in market structure.
🔹 Technical Insights & Market Sentiment
1️⃣ Descending Trendline: The price is respecting a descending trendline, indicating a bearish bias.
2️⃣ Multiple Resistance Rejections: Price has tested the resistance zone multiple times without breaking through.
3️⃣ Bearish Price Action: The recent candles show lower highs, reinforcing the downtrend.
4️⃣ Volume Analysis: A drop in buying pressure at resistance signals potential weakness among buyers.
5️⃣ Fundamental Factors : GBP strength due to macroeconomic factors could add further pressure on EUR/GBP.
🔹 Trade Plan & Strategy
📌 Entry Criteria
Ideal entry near 0.84150 - 0.84200 if price shows rejection at resistance.
Alternatively, enter after a confirmed breakdown below 0.84000 for safer confirmation.
🎯 Profit Target
First target: 0.83735
If bearish momentum continues, price could extend towards 0.83600 as an extended target.
🛑 Stop Loss Placement
Above 0.84201 to minimize risk.
This ensures the trade remains valid while avoiding market noise.
🔹 Risk-Reward Ratio & Trade Management
✅ Risk-Reward Ratio (RRR): Approximately 2:1, making this a favorable setup.
✅ Trade Management:
If price starts reversing before hitting the target, consider trailing stop-loss to secure profits.
If price consolidates around support, watch for breakout confirmations before entering.
🔹 Final Thoughts & Market Sentiment
This trading setup suggests a strong bearish opportunity based on price action, resistance rejection, and trendline confluence. The break below 0.84000 will be the key trigger for further downside movement. If price remains below resistance, a sell position with a stop-loss above 0.84201 and a target of 0.83735 offers a high-probability trade setup.

EUR/USD Chart Pattern Analysis (1H Timeframe) – Bearish SetupThe EUR/USD 1-hour chart presents a compelling bearish setup, characterized by a rejection from a key resistance zone, a weakening support level, and a potential trendline breakdown. These technical elements suggest an increased probability of downward movement if bearish momentum persists.
Key Technical Components:
Resistance Rejection & Selling Pressure:
The price action tested a well-defined resistance zone, which aligns with previous swing highs.
A rejection from this level indicates that sellers have stepped in, preventing further upside movement.
This area serves as a supply zone, reinforcing a bearish outlook as long as price remains below it.
Support Level at Risk of Breakdown:
The market is currently testing a support zone, which has previously acted as a demand area.
A break below this support would confirm increased selling pressure, likely triggering a more significant decline.
The support level is structurally weak, as the price has already tested it multiple times, increasing the likelihood of a breakdown.
Ascending Trendline Violation:
The ascending trendline has been a key dynamic support for the recent uptrend.
If the price breaks below this trendline with strong volume, it would signify a potential trend reversal, shifting market sentiment from bullish to bearish.
A confirmed breakdown would further validate the bearish continuation scenario.
Sell Stop Placement & Profit Targets:
A Sell Stop order is positioned below the support zone to capture a breakdown trade.
The first Take Profit (TP1) is set at 1.08312, a level that has historically acted as support and resistance.
The second Take Profit (TP2) is placed at 1.07659, representing a more extended bearish move toward the next major demand zone.
Conclusion & Trading Strategy:
Bearish Scenario: If the price breaks below the support level and ascending trendline, it could trigger a sell-off, leading to a potential downside move toward TP1 and TP2.
Bullish Rebound Possibility: If the support level holds and buyers regain control, the price may attempt to retest the resistance zone. However, the bearish structure remains dominant unless the price breaks above resistance.
Final Outlook:
Traders should closely monitor price action at the support and trendline intersection. A confirmed breakdown below these levels, preferably with increased volume, would reinforce the bearish outlook. Proper risk management and stop-loss placement above the resistance zone are recommended to mitigate potential reversals.
Would you like me to refine it further for professional publication or trading forums? 🚀

JPY/USD – Bullish Breakout After Falling Wedge!Let's take a deep dive into the JPY/USD price action and technical setup on the daily chart. The market has presented us with a falling wedge breakout, a strong bullish reversal signal. This pattern indicates a potential shift from the previous downtrend into an uptrend.
1️⃣ Falling Wedge Pattern – Bullish Reversal Signal
The falling wedge is a classic bullish reversal pattern. It forms when price action makes lower highs and lower lows within two converging trendlines. The key characteristic of this pattern is the decreasing selling pressure, leading to a breakout to the upside.
We observed a clear breakout from the wedge, indicating bullish momentum.
Buyers have stepped in strongly, pushing prices above the resistance zone.
This signals a potential trend reversal from bearish to bullish.
2️⃣ Breakout Confirmation & Key Levels
Once the price broke above the wedge, it faced a crucial resistance zone (marked in blue on the chart). After breaking this level, it has now turned into support—a strong technical confirmation.
Resistance Turned Support: The previous resistance is now acting as support, giving further confidence in the bullish move.
Retest Expected: After breakouts, the price often comes back to retest support before continuing higher. If it holds, it’s a good entry opportunity.
3️⃣ Entry, Stop Loss & Take Profit Targets
Based on the technical setup, here’s how we can approach this trade:
🔹 Entry: Ideal entry is around the current support zone after a successful retest.
🔹 Stop Loss: Placed below the support level at 0.006574 to minimize risk.
🔹 Take Profit (TP): The target price is set at 0.007126, aligning with the previous swing high.
4️⃣ Trade Outlook & Expected Movement
If the price holds above support, we expect a bullish continuation towards the target.
A minor pullback is possible before the next move higher.
If the price breaks below the support zone, it may invalidate the bullish setup.
📌 Final Thoughts
This setup is a high-probability bullish trade, backed by the falling wedge breakout and retest of a key level. However, always manage risk properly and wait for confirmation before entering the trade.
What do you think? Do you see further upside, or is this a false breakout? Drop your thoughts below! 👇
#JPYUSD #ForexTrading #TechnicalAnalysis #TradingView #BullishBreakout #ChartPatterns

Probability o Rising WedgeBINANCE:BTCUSDT BTC/USDT is currently "forming a rising wedge pattern" , which could indicate a continuation of the downtrend. Since the last peak at $110,000, Bitcoin has been experiencing a decline.
At the moment, BINANCE:BTCUSDT BTC/USDT is highly volatile, with daily price swings of up to 10%. This volatility increases the likelihood of fake breakouts and rapid reversals, especially due to external factors like news.

Ethereum's Current Consolidation: Will It Move Up or Down...?BINANCE:ETHUSDT Ethereum Consolidating Between $1820 and $1950: Will It Break Upside or Downside..?
Ethereum has been trading in a consolidation range between the $1820 and $1950 levels since last week. As the price oscillates within this range, market participants eagerly await a breakout in either direction. The big question is: will Ethereum break upwards or downwards? Let's analyze two potential scenarios based on key price levels and liquidation points.
Scenario 1: Upside Breakout and Potential Rally
One key level to watch is the $1950 resistance. Ethereum has struggled to break past this level, but if the price manages to break above and sustain above $1950, there is a significant upside potential.
Why? At the $1994 level, there is approximately $1.16 billion in liquidations waiting to happen. If Ethereum pushes past the $1950 resistance and approaches this $1994 mark, the surge of liquidations could provide the momentum for a continued rally.
In this scenario, a good strategy would be to wait for a retest of the $1950 level as support, confirming the breakout. If the price holds above this level, it may be a good time to enter a long position, riding the potential bullish move.
Scenario 2: Downside Breakout and Further Decline
On the other hand, if Ethereum fails to hold above the $1820 support and breaks below this level, a downside move could be on the horizon. The next significant support lies around the $1785 level, where around $900 million in liquidations are waiting.
A break below $1820 could trigger a sharp decline toward this liquidation point at $1785. In this case, entering a short position after a retest of the $1820 resistance-turned-support could offer a solid opportunity for traders looking to capitalize on the downtrend.
Conclusion
Ethereum’s consolidation between the $1820 and $1950 levels presents two distinct scenarios. If the price breaks above $1950 and sustains that level, there is upside potential, with liquidation at $1994 offering a bullish catalyst. However, a break below $1820 could open the door for further downside, with liquidations at $1785 triggering a possible downtrend.
Traders should keep a close eye on these levels for confirmation and act accordingly based on the direction Ethereum takes in the coming days.

GOLD TRADING POINT UPDATE >READ THE CHPTAIAN Buddy'S dear friend 👋
SMC Trading Signals Update 🗾🗺️ Gold Traders SMC-Trading Point update you on New technical analysis setup for Gold 🪙 list week profitable profomans reached target point 2961 ) New technical analysis setup for Gold 🪙 a short trend 📉 analysis setup. Guys 🤝 Gold 🪙 1 Time Frame 🪟 patterns chart 📉. Looking for selling zone ☺️ 🤝 FVG level 3006$ 2996$ rejected point below 👇 ⬇️ target point 2832 - 2818. ) again back 🔙 that entry buying said. Update you next analysis Guys 🤝 now follow it' good luck 💯
Key Resistance level 2996+ 3006
Key Support level 2832 - 2818
Mr SMC Trading point
Pales Support boost 🚀 analysis follow)

BTCUSDT TRADING POINT UPDATE >READ THE CHPTAIANBuddy'S dear friend
SMC Trading Signals Update 🗾🗺️ crypto Traders SMC-Trading Point update you on New technical analysis setup for crypto BTC USDT. ) list time post signals 💯 reached target point ) 👉 New technical analysis setup BTC USDT looking for bullish trend 📈 FVG level support level. 83k 82k support level 87k 88k resistance level ). Guys 🤝 good luck 💯💯
Key Resistance level 87k + 88k
Key Support level 83k - 82kà
Mr SMC Trading point
Pales support boost 🚀 analysis follow)

EUROUSD TRADING PINT UPDATE >READ THE CHPATIAN Buddy'S dear friend
SMC Trading Signals Update 🗾🗺️ SMC-Trading Point update you on New technical analysis setup for Euro USD) Euro USD) Technical patterns choch looking for Bullish patterns support level 1.0866 Resistance level 1.09361 ) good luck guys 🤝
Key Resistance level 1.09361+ 1.09483
Key Support level 1.08802 - 1.08666
Mr SMC Trading point
Pales support boost 🚀 analysis follow)

GOLD TRADING PONT UPDATE >READ THE CHAPTIANBuddy'S dear friend 👋.
SMC Trading Signals Update 🗾🗺️ Gold Traders SMC-Trading Point update you on New technical analysis setup for Gold 🪙 Gold Traders Gold 1H time. Look 👀 first take FVG level that take entry buying said target point 2959 New ATH wait for FVG level good luck 🤞
Key Resistance level 2930 + 2959
Key Support level 2909 - 2902 - 2896
Mr SMC Trading point
Pales support boost 🚀 analysis follow)

GOLD VIEW 3H READ THE CAPTAINHello 👋 gold traders
3-hour timeframe of Gold Spot (XAU/USD) with technical analysis levels and moving averages. Here’s a breakdown of the key points:
Key Observations:
1. Support & Resistance Levels:
Support Level: Around 2,909.870 - 2,902.340 (marked as the buying zone).
Resistance Level: 2,930.173.
Target Point: 2,960.607.
2. Exponential Moving Averages (EMAs):
30 EMA (Red Line): 2,909.870 (Short-term trend).
200 EMA (Blue Line): 2,884.578 (Long-term trend, acting as strong support).
3. Price Action:
The price is currently in a consolidation phase around the resistance zone.
If the price breaks above 2,930, we might see a bullish move toward the target at 2,960.
If the price fails to break resistance, a pullback to the buying zone (support level at 2,909-2,902) is possible.
Trading Strategy Ideas:
Bullish Scenario (Breakout Above 2,930): Look for long positions targeting 2,960.
Bearish Scenario (Rejection at Resistance): A retest of the buying zone (2,909 - 2,902) before another push higher.

GOLD TRADING POINT UPDATE > READ THE CHAPTIANBuddy'S dear friend 👋
SMC Trading Signals Update 🗾🗺️ Gold Traders SMC-Trading Point update you on New technical analysis setup for Gold 🪙 Gold Traders Gold 3 time frame 🖼️ looking FVG rejected point below 👇 2929+ 29209. Technical patterns). Weekly basis setup. )
Key Resistance level 2929 + 2957
Key Support level 2891 - 2848
2832
Mr SMC Trading point
Pales support boost 🚀 analysis follow)
