(BTC/USD) Short Trade Setup: Key Resistance Rejection with Targe1. Entry Point: 104,855
This is where the trader plans to enter a short position (sell).
Price is slightly below this level at the moment (103,775).
2. Stop-Loss Zone: ~104,807
Highlighted in purple above the entry.
Indicates where the trader will exit if the market moves against them to limit losses.
3. Resistance Point: 103,086
This level has been tested multiple times and may act as a ceiling for prices.
If broken and held, it might invalidate the short setup.
4. Target Point: 93,159
This is the take-profit level for the short trade.
Represents a drop of approximately -10.76% from the entry point.
5. Trend Analysis:
The chart shows an uptrend leading into a potential distribution or topping pattern near the resistance zone.
A potential bearish move is anticipated, hence the short strategy.
6. Support Zones:
Highlighted in purple near the target area (around 93,159).
Historically strong buying areas.
Interpretation:
The trader expects the current resistance level to hold, prompting a downward correction toward the target zone at 93,159. If price moves above 104,807, the setup is invalidated, hence the stop-loss placement.
Chatpatterns

1. EUR/USD Buy Setup1. Entry Point:
Marked at: 1.12243
This is the suggested price level to enter a long (buy) trade.
2. Stop Loss:
Set at: 1.11542
Placed below a support zone, it limits the downside risk if the trade moves against the position.
3. Target Points:
EA Target Point One: 1.13891
EA Target Point (Final): 1.15929
These levels are profit-taking zones, with the first being a conservative target and the second being a more extended move.
4. Technical Indicators:
Moving Averages:
A red shorter-term moving average (possibly 20 EMA)
A blue longer-term moving average (possibly 200 EMA)
Price is currently below both, indicating bearish momentum, though the long setup is anticipating a reversal.
5. Support/Resistance Zones:
Purple Zones: Highlighted as key demand and supply areas.
The lower purple zone supports the entry and stop-loss area.
The upper purple zones mark resistance areas aligning with the target levels.
6. Current Price:
Around 1.12459, slightly above the entry zone.
Conclusion:
This setup is a bullish trade idea with a clearly defined:
Entry (1.12243),
Stop-loss (1.11542), and
Two take-profit levels (1.13891 and 1.15929).

(BTC/USD) 1H Trade Setup – Key Entry, Stop Loss & Dual TargetEntry Point: 95,431
Stop Loss: 95,264
Target Points:
Upside (Target 1): 100,674 (Potential gain: +5.36%)
Downside (Target 2): 86,614 (Potential loss: -7.57%)
Trade Setup:
Risk-Reward Ratio:
Approx. 1:0.7 (Not ideal; the reward is smaller than the potential loss)
Support Zones:
Highlighted in purple beneath the entry zone — this indicates a historically strong support area.
Resistance Zones:
The upper purple zone marks the next significant resistance around 100,000–100,795.
Technical Indicators:
50 EMA (Blue Line): Indicates mid-term trend support, currently holding price action.
Price Action: BTC appears to be retracing toward support after a bullish rally.
Interpretation:
The setup implies a long (buy) position with a very tight stop loss.
The price is nearing a support zone, and if it holds, there's potential for an upward move to the target at 100,674.
However, if price breaks below 95,264, a sharp drop to 86,614 is anticipated.

USDJPY Buy Opportunity Above 143.525Entry Point: 143.525 (unchanged)
Stop Loss: 141.847 (unchanged)
Target Point One (TP1): 145.063 (unchanged)
Final Target (TP2): Now refined to 147.883 instead of 147.894 — a small, precise update.
📈 Pattern and Structure:
Cup-and-handle formation still intact, indicating a continuation pattern.
Support confirmation at the 143.5 zone, showing a potential base for a bullish reversal.
The chart shows strong upside projection toward the resistance band near 147.8–148.0, highlighted with the upper purple zone.
📊 Risk-Reward Profile:
Risk (Entry to SL): 143.525 – 141.847 = 1.678
Reward (Entry to TP2): 147.883 – 143.525 = 4.358
Reward-to-Risk Ratio: 4.358 / 1.678 ≈ 2.6R — a favorable risk/reward setup.
🧠 Trade Notes:
Entry is slightly above a demand zone.
First target is conservative, near a known resistance.
Final target aligns with prior highs and the broader ascending wedge’s upper bound.
Timing suggests the bullish push may unfold over the next few sessions (likely May 6–8 range, as curved arrow indicates a rounded retest/bounce scenario)

S&P 500 Bearish Reversal Setup: Short Entry Below Key ResistanceEntry Point: Around 5,678.79
Stop Loss: Around 5,833.61 (above recent resistance zone)
Target Point: Around 4,831.37 (indicating a bearish target)
2. Technical Patterns:
The price hit a resistance zone (highlighted in purple) and reversed—this is often a bearish signal.
The trendline break (marked with the orange dot and blue arrow down) suggests a potential trend reversal.
The moving averages (likely 50 EMA and 200 EMA) indicate the price is still above the support zone but weakening.
3. Risk/Reward Ratio:
Risk (Stop Loss – Entry): ~154.82 points
Reward (Entry – Target): ~847.42 points
Risk/Reward Ratio: Approximately 1:5.5, which is favorable for shorting.
4. Trade Sentiment:
Bearish bias based on the breakdown from the resistance zone and confirmation from chart patterns.
If the price fails to hold above 5,682.87, a short trade may be validated with the target at 4,831.37.

(XAU/USD) Bullish Trade Setup – Targeting $3,506.52 with Entry aEntry Point: $3,221.19
Stop Loss: $3,169.80
Resistance Zone: Around $3,277.98 to $3,280.64
Target (TP) Point: $3,506.52 (Approx. 9.05% upside)
📊 Technical Indicators and Markings:
Moving Averages:
Likely a 50-period (blue) and 200-period (red) moving average.
Price is currently below both MAs, signaling a short-term downtrend.
Support & Resistance Zones:
Strong support around $3,207.67–$3,221.19 (entry area).
Resistance at $3,244.25–$3,280.64.
Stop-loss is strategically placed below support to limit downside risk.
Target Area:
Projected upside target is $3,506.52, with a potential 9.05% gain from the entry.
This is marked as the EA (Expert Advisor) Target Point, possibly suggesting this is a strategy from an automated trading system.
Orange Circles:
Likely indicate swing highs and lows, used to identify trend patterns and potential reversal points.
📈 Trading Idea Summary:
Bullish Setup: Buying at support, aiming for breakout above resistance to reach target.
Risk-Reward Ratio: Favorable, assuming price holds above $3,207.
Watch for Confirmation: Price needs to break above resistance around $3,280 for momentum continuation.

GBP/USD Short Trade Setup: Reversal from 1.34370 with Target at Entry Point:
Marked at 1.34370, where the analyst anticipates a reversal or price rejection.
Stop Loss:
Positioned above at 1.34975, covering a 2.62% risk margin. This is a protective level in case the price moves against the trade.
Target (Take Profit):
Set at 1.31015, just above a strong support zone around 1.30818. This is where the analyst expects the price to eventually fall.
Resistance Point:
Noted around 1.33007 – 1.32859, acting as an intermediate level of interest and possible price reaction zone.

GBPUSD...4hchatpatternYou're looking at a GBP/USD *short (sell) trade* with the following parameters:
- *Entry:* 1.3343
- *1st Take Profit (TP1):* 1.30045
- *2nd Take Profit (TP2):* 1.29270
Here’s a quick analysis based on this setup:
### Risk-Reward Snapshot:
- *TP1* distance: ~339 pips
- *TP2* distance: ~416 pips
- These targets suggest a medium- to long-term bearish outlook on GBP/USD.
### Considerations:
- Check for *support levels* around 1.3000 – it’s a psychological level and could cause a bounce.
- Watch for upcoming *economic news* (e.g., UK inflation data, BoE/Fed decisions) which may heavily impact volatility.
- *Stop-loss* is not mentioned — consider setting one based on recent highs or ATR (Average True Range) to manage risk.
Would you like a technical chart review or news-based outlook for GBP/USD to support this trade idea?

Gold (XAU/USD) Intraday Buy Setup with High Reward-to-Risk Ratio1. Entry Point Zone: Around 3,271.79 USD
This is identified as a potential buy entry area, marked in purple.
2. Stop Loss: Below the entry point at 3,257.71 USD
Risk management level in case the trade moves against the setup.
3. Target Point One: Between 3,313.75 and 3,317.07 USD
A short-term take-profit level, likely based on previous resistance.
4. Final Target (EA Target Point): Around 3,373.04 USD
A more ambitious take-profit, possibly based on a major resistance level or Fibonacci extension.
5. Trade Range:
Risk: 3,271.79 - 3,257.71 = 14.08 USD
Reward to First Target: ~42 USD

(XAU/USD) 1H Chart: Long Setup Targeting 3,500 with Key Support Entry Point: Suggested near 3,301.51 USD (marked with the purple support zone).
Stop Loss Zone: Below 3,266.87 to 3,221.67 USD (marked in blue and purple). This is where you limit your loss if the trade goes wrong.
First Target (Target Point One): 3,376.65 USD.
Final Target (EA Target Point): 3,523.55 USD (~8.26% potential gain from entry).
Main Setup Idea:
The price is consolidating around the support zone.
There's a plan to buy (go long) at the purple zone (Entry Point) and aim for the two target points

EUR/USD Bullish Breakout Trade Setup – Targeting 1.18089Entry Point: 1.13860
Stop Loss Zone: 1.13642 to 1.12578
Resistance Point: 1.14320
Target (TP) Point: 1.18089
🔍 Observations
Support Zone: Marked in purple near the entry and stop-loss area, suggesting a strong demand zone.
Resistance Zone: Around 1.14320, indicating a potential breakout level.
Trend: Short-term uptrend after a consolidation range.
Risk/Reward Ratio: Quite favorable, targeting a move of approximately 470+ pips (4.20% gain) from entry to target.
📊 Technical Indicators
Moving Averages:
Red (likely 20 EMA): Price recently crossed above, showing bullish momentum.
Blue (likely 50 or 200 EMA): Serving as dynamic support.
Price Action: Formation suggests a potential breakout from resistance toward the 1.18 target.
🧠 Conclusion
This is a long (buy) setup expecting a bullish breakout:
Buy entry above the support zone.
Stop-loss placed below major support (1.12578).
Target set significantly higher, aligning with prior structure or resistance at 1.18089

BTC/USD) Short Setup: Triple Top Formation Targeting 86,023 USD You’re seeing a potential Head and Shoulders structure (or at least a triple top) — with the orange circles marking failure to break higher around $95K.
The neckline (support) is slightly diagonal down toward the $94K region.
A breakdown is anticipated once the neckline fails.
2. EMAs Interaction:
30 EMA (red) is currently flattening, showing weakening momentum.
200 EMA (blue) is far below, around 88,181 USD, acting as a major support zone — and it aligns with the projected EA TARGET POINT.
EMA compression usually precedes a strong move.
3. Zones and Key Price Levels:
Entry Point: ~95,145.60 USD → high-probability short sell.
Stop Loss: ~96,000–96,957 USD → protects against unexpected breakout.
Target: ~86,023 USD → aligns with past accumulation zone and EMA200.
4. Risk/Reward Ratio:
Potential reward is about 9–10%.
Risk (from entry to stop) is about 1–2%.
Excellent Risk/Reward (>4:1).
5. Momentum and Volume (implied, not shown):
Given the topping pattern and lack of higher highs, buying momentum is weakening.
If volume increases on a breakdown, confirmation will be strong.
📊 Strategic Points:
Aspect Analysis
Trend Still bullish, but topping signs visible
EMA Behavior Short-term EMA flattening, long-term EMA rising slowly
Pattern Formed Triple Top / Head and Shoulders
Risk/Reward Very good (>4:1)
Recommendation Short bias around entry level, with strict stop-loss
⚡ Quick Trading Plan:
Entry: Short at ~$95,145
Stop Loss: ~$96,000–96,957
Target: ~$86,023

ETH/USD Breakout Trading Setup – Long Entry with 16% Target PoteEntry Point: $1,593.08
Target Point: $1,807.83
Stop Loss: $1,472.68
Risk/Reward Ratio: Roughly 2.1:1
Indicators Used:
EMA 30 (Red Line) at $1,593.08 (near entry point)
EMA 200 (Blue Line) at $1,605.09
Analysis:
1. Consolidation Phase:
ETH is in a sideways range after a prior downtrend, consolidating within the purple support zone.
This zone (~$1,555 to ~$1,593) has been tested multiple times, suggesting a strong base.
2. Bullish Breakout Anticipation:
The setup expects a breakout above consolidation, targeting a 16.11% move to $1,807.83.
A breakout strategy is being applied, assuming ETH will reverse from this consolidation area a

Bitcoin Bearish Reversal Setup: Rising Wedge Breakdown Targeting1. Entry Point:
Marked around $86,853, this is where a potential short (sell) trade might have been initiated.
2. Stop Loss:
Placed above $88,783, protecting the trade in case the market goes against the position.
3. Target Point (Take Profit):
Aiming down toward $74,443.76, suggesting a large bearish move is anticipated.
4. EMA Indicators:
30 EMA (Red Line) at ~$84,271: Indicates short-term trend.
200 EMA (Blue Line) at ~$83,496: Indicates long-term trend.
Price is currently trading above the 200 EMA but slightly below the 30 EMA, showing mixed short-term momentum.

USD/JPY Bullish Reversal Setup – Long Entry at 141.964 Targeting ahemdsaeed25: USD/JPY Long Setup – Eyeing 150.537 Target"
"Potential Bullish Reversal on USD/JPY"
"Swing Trade Alert: USD/JPY Long from 141.964"
"USD/JPY Breakout Play – Buy Zone Identified"
Let me know your tone preference (technical, casual, professional, etc.) and I can tailor the title further.
ahemdsaeed25: This chart is for the USD/JPY (U.S. Dollar / Japanese Yen) pair on the 1-hour timeframe, and it's displaying a bullish setup with a clear trade idea. Here's a breakdown of the analysis:
Key Components:
Current Price: Around 142.574.
Entry Point: 141.964
Stop Loss: 140.547
Take Profit / Target Point: 150.537
Reward-to-Risk Ratio: Favorable (approximately 5.94% upside, large potential move).
Indicators:
EMA 50 (Red Line): 142.798 — acting as near-term dynamic resistance.
EMA 200 (Blue Line): 144.699 — major resistance and a trend filter (downward trend visible).
Zone Analysis:
Support Zone (Purple Box near 141.964 - 140.547): This is the accumulation/buy zone.

Gold (XAUUSD) Trade Setup: Bullish Breakout Toward $3,637 TargeCurrent Price: $3,309.18
EMA 30 (Red Line): $3,265.00
EMA 200 (Blue Line): $3,163.35
Trend Direction: Strong uptrend (price above both EMAs)
Timeframe: 1-hour (short-term analysis)
📍 Key Levels
Entry Point: Around $3,266.63 (just above EMA 30)
Stop Loss: Around $3,265.00
Target (EA Target Point): $3,637.23
Potential Profit: +$365.01 or +11.16%
🔍 Technical Patterns & Zones
Rising Channel: Price is moving within a rising wedge or channel, indicating bullish momentum but with narrowing range — a potential reversal signal if broken.
Support Zone: Highlighted purple box around the entry point; likely a demand zone.
Resistance Zone: $3,637.23 area marked as the EA Target Point — previous resistance or Fibonacci extension level.
✅ Bullish Signals
Price is consistently making higher highs and higher lows.
EMAs are aligned in a bullish formation (short EMA above long EMA).
Clear breakout above consolidation range recently.
Trade setup shows favorable risk-to-reward ratio.
⚠️ Risks / Caution
Rising wedge can sometimes break down — watch for volume drop or divergence.
Potential pullback to the entry zone is expected (indicated by the arrow).
News Events: Symbols below the chart indicate upcoming USD economic data, which could bring volatility.
📈 Strategy Summary
Buy on pullback to $3,266.63 with tight stop at $3,265.00.
Target: $3,637.23 — potential 11% gain.
Risk: Minimal if stop is respected, tight stop-loss.

EUR/USD Bullish Setup – Targeting 1.16950Entry Zone (Buy Area): Between 1.12729 and 1.13101
Stop Loss: 1.12100
Target (TP1): 1.16950
Risk-Reward Ratio (R:R):
Risk: 1.13101 - 1.12100 = 101 pips
Reward: 1.16950 - 1.13101 = ~385 pips
R:R ≈ 1:3.8 — excellent risk-to-reward
📈 Technical Observations
Bullish Momentum: Strong bullish candles leading into the setup suggest buyers are currently in control.
Support Zone (Entry Area):
The purple zone has acted as a previous resistance, now turned support.
Price may retest this zone before moving higher (as indicated by the blue path on the chart).
Moving Averages:
Red (likely 50 EMA) and blue (possibly 200 EMA) are showing a bullish crossover.
Price is above both MAs, reinforcing a bullish trend.
Projected Move:
The setup anticipates a pullback before a continuation to the upside toward 1.16950.
🧠 Trade Idea Summary
This is a buy-the-dip strategy within a bullish trend.
Entering on the pullback allows for:
Tighter stop loss
Better entry price
Higher R:R ratio
⚠️ Risk Considerations
A break below 1.12100 would invalidate the setup.
Monitor for bearish reversal patterns or news around the EUR/USD that might shift sentiment.

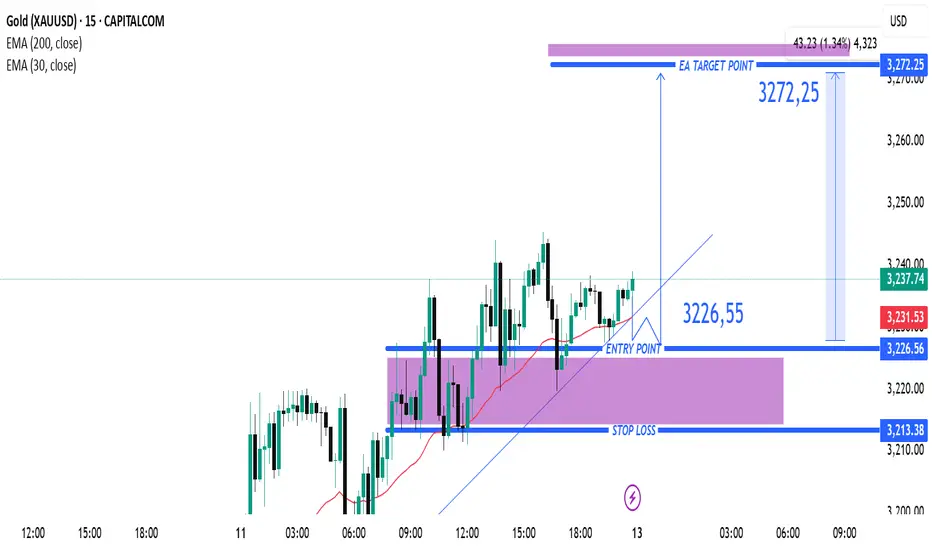
Gold (XAUUSD) 15-Min Buy Setup: Bullish Breakout with High Risk-Instrument: XAUUSD (Gold vs. US Dollar)
Timeframe: 15 minutes
Indicators:
EMA 200 (Blue): 3,170.78 (long-term trend indicator)
EMA 30 (Red): 3,231.53 (short-term trend indicator)
---
Key Levels:
Entry Point: 3,226.55 (highlighted with a blue arrow and line)
Stop Loss: 3,213.38 (purple zone bottom)
Target (Take Profit): 3,272.25
---
Trade Setup:
Type: Long (Buy) Position
Risk-to-Reward Ratio:
Risk: ~13.17 points (from 3,226.55 to 3,213.38)
Reward: ~45.7 points (from 3,226.55 to 3,272.25)
R/R Ratio: Approximately 3.5:1, which is favorable
---
Market Context:
Price is curren
Silver (XAG/USD) Bullish Trade Setup: Entry, Target & Stop-Loss Entry Point: ~32.35619
Take Profit (Target Point): 33.31252
Stop Loss: 31.87803
EMA 200 (Blue): 31.65932 – indicating long-term trend support.
EMA 30 (Red): 32.28304 – indicating short-term trend.
Current Price: 32.38220
The price is above both EMAs, which is typically bullish.
---
Analysis
1. Bullish Bias:
Price has broken and is holding above the entry zone.
Both EMAs are aligned in a bullish configuration (short-term EMA above long-term EMA).
The market structure shows higher lows and sideways consolidation, suggesting potential for a breakout.
2. Risk-Reward Ratio:
Risk (Entry to Stop Loss)

DXY Bullish Reversal Setup – Long Entry from Support Zone TowardEMA 30 (Red Line): Currently at 99.700 — tracks short-term trend, and price is hovering near this level.
EMA 200 (Blue Line): At 100.935 — indicates long-term trend, acting as dynamic resistance above.
📈 Trade Setup
✅ Entry Point:
Price: 99.699
Rationale: This level has been tested multiple times, forming a support zone. A bounce here signals a potential long entry.
🎯 Target Point (Take Profit):
Price: 102.738
Distance: ~3.04 points or 3.43% potential move upward.
Note: Marked as EA TARGET POINT, which suggests a calculated area possibly based on previous resistance or algorithmic strategy.
🛑 Stop Loss:
Price: 98.624
Reasoning: Just below the defined support zone (highlighted purple area), ensuring protection against downside breakouts.
📊 Risk-to-Reward Ratio
Entry: 99.699
Target: 102.738 → Gain of ~3.04
Stop: 98.624 → Risk of ~1.08
R/R Ratio: ~2.8:1 — favorable setup
📌 Overall Sentiment
This chart indicates a bullish reversal setup from a strong support zone, possibly targeting a mean reversion or trend reversal toward the 200 EMA and beyond.
However, keep in mind:
The price is currently below both EMAs, so the trend is still bearish.
The trade is counter-trend, relying on support holding and momentum shifting.

Gold (XAUUSD) Bullish Breakout Setup – Targeting 3,394.56 After EMA 30 (Red Line): Currently at 3,109.56
EMA 200 (Blue Line): Currently at 3,064.85
Price is above both EMAs, indicating bullish momentum in the short and long term.
📈 Trade Setup:
Entry Point: Around 3,162.15
Stop Loss Zone: Below the purple support box around 3,109–3,141 (right above the 30 EMA)
Target (Take Profit): 3,394.56 — marked as "EA TARGET POINT"
📊 Strategy Outlook:
Bullish Setup: The price recently broke out of a resistance zone (purple area) and retested it, confirming the breakout.
The risk-to-reward ratio appears favorable, as the target is significantly higher than the stop loss.
The upward price projection suggests confidence in a strong bullish continuation.
⚠️ Things to Watch:
Volume confirmation and price action near the entry level.
If price closes below the 30 EMA, it may invalidate the setup.
Always consider broader macroeconomic or fundamental factors when trading gold (e.g., USD strength, interest rates, geopolitical tension).

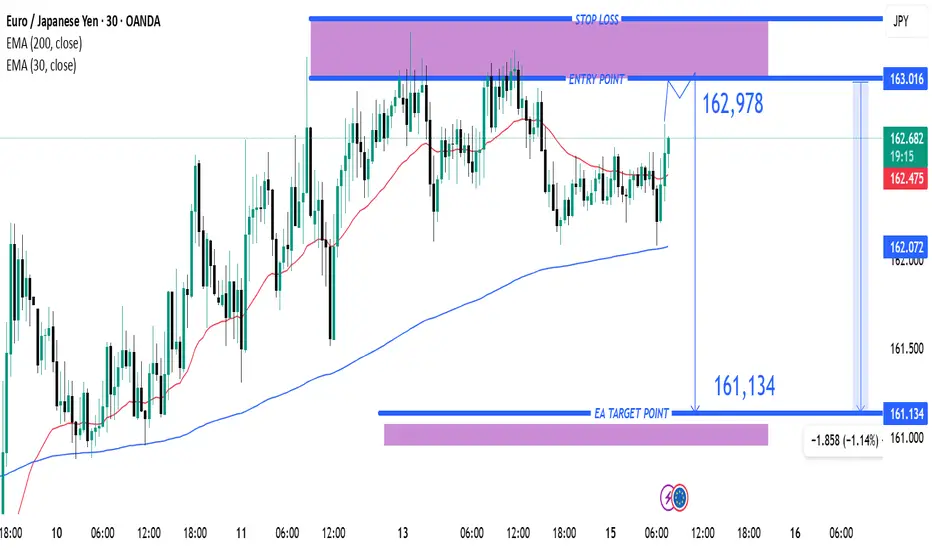
EUR/JPY Short Setup – Bearish Reversal Targeting 161.134 with TiEMA 30 (red): Currently at 162.470
EMA 200 (blue): Currently at 162.071
Trade Setup:
Entry Point: Around 162.978
Stop Loss: Slightly above 163.016 (highlighted in purple zone)
Target (Take Profit): 161.134 (labeled as “EA TARGET POINT”)
Analysis:
Trend: The pair has been trending upwards recently, as shown by the price staying above the 200 EMA.
Current Price: 162.604, just below the proposed entry.
Risk/Reward:
Risk: ~3.8 pips (entry to stop loss)
Reward: ~184.4 pips (entry to target)
This implies a favora
WTI Crude Oil Bearish Reversal Setup – Short from Resistance ZonEntry Point: 62.66 USD
Stop Loss: 65.26 USD
Target Point (Take Profit): 55.09 USD
Indicators:
EMA 200 (blue): 60.92 USD — long-term trend indicator
EMA 30 (red): 60.75 USD — short-term trend indicator
Analysis:
1. Bearish Setup:
The price is approaching a key resistance zone marked by the purple shaded area near 62.66.
The strategy is to short from this level, anticipating a drop to the 55.09 target area.
2. Risk/Reward:
Risk (SL - Entry): 65.26 - 62.66 = 2.60 USD
Reward (Entry - TP): 62.66 - 55.09 = 7.57 USD
Risk-to-reward ratio: ~1:2.9, which is favorable.
3. Support/Resistance Confirmation:
Multiple touches at the resistance zone (or
