CADJPY - Bullish Shark checkback I'd engaged this Bullish Shark 🦈 Trading setup an hour or more earlier at 99.60. It's sad to see that first target doesn't have a Profit Factor of 2 like it usually does.
Please do not chase the trade even if you agree.
Checkback

USDCAD - Trendline BreakTrendline Break could be a trading opportunity for traders looking to short the USDCAD. Friends that had shorted the USDCAD on the 4-hourly chart before might have a second chance trading opportunity.(check link within tradingview)

EURUSD-Weekly Market Analysis-Dec22,Wk2The Overall Trend of EURUSD is a Bullish Trend. There are a couple of ways you can engage in this trade.
Wait for market retest at 5-0Pattern at 1.0515 for a buying opportunity or a shorting opportunity at 1.0581 by using the Type2 Bearish Shark Pattern as a counter-trend trade that could form a combo trade with EURUSD Bearish Crab Pattern on the Daily Chart.

USDCAD - Bearish ButterflyLast night during our live session in trading view(www.tradingview.com). I've mentioned that there's no need to chase after the USDCAD trade as there's a rate hike decision happening in less than an hour.
If it's your trade to take, you will have another opportunity.
Missing a trade is better than getting into a trade you aren't supposed to take.
I'm waiting for the current candlestick candle close to engage this trade.

NZDUSD - Bearish SharkBearish shark trading opportunity on the daily chart.
watch closely on this trading setup on NZDUSD D1 chart I'm not engaging based on the Daily chart, if not I would have done so. I will check out the H1 chart in waiting for the opportunity

GBPUSD - Bullish GartleyA Bullish Gartley Pattern has standout. Usually setup like this will have a V-Bottom than a retest. I still prefer a retest before engaging on the trade.
You make your own call, don't follow blindly.

USDJPY - Bearish Crab checkbackA Bearish Crab Pattern has been completed. I'm waiting for the USDJPY to checkback at 144.56 and wait for a shorting opportunity. This could give counter-trend traders and opportunity to jump onto the trade.

AUDCAD - Bearish Shark 🦈 The Bearish Shark Pattern has went to the 2nd entry level, as a Shark Pattern Trader, you have to be aware that this harmonic patterns can have as much as 3 different entry zone.
Conservative Trader can consider to wait for retest of 0.8947 to engage the trade.

GBPAUD - Bullish BatThe overall trend of GBPAUD is a Bearish Trend. You must know that the bearish trend is pretty strong with the current market condition.
However, there is a counter-trend trading opportunity; a bullish bat pattern has been completed, and at this moment, it is having its retest. You can wait for a 3-bar reversal pattern before engaging the trade.

USDCAD - Bearish Deep GartleyA Bearish Deep Gartley Pattern check back. What!?! It's rare, but it does happen.
I"m waiting for the candlestick to close and confirm a long shadow for my aggressive trade. This trade could potentially give me a lower risk and higher returns, if you know what you are looking for.

EURJPY - Bullish Bat checkbackBeing conservative in approach means there is a chance for you to miss your trade. The Bullish Bat and AB=CD Pattern retest price could go as early as 135.02 a much more conservative trader might wait as far as 134.06 before engaging the trade.
This is a perfect example for you to decide on your trade plan. Engaging early could be that you have a higher chance of catching the move, but it also means it puts you 96pips at a disadvantage should that be a valid setup.

CADJPY - Bullish Bat checkbackA Bullish Bat Pattern has formed on the CADJPY 4-hourly chart. I'm waiting for the market to check-back at 103.85 before engaging the trade.
Aggressive trader could decide for yourself if this setup is for you.

AUDUSD - Bearish Bat checkbackA Bearish Bat check back at 0.7034. If I were you, I will be waiting for the check back to have a better Profit Factor. The wait is worth it.

EURUSD - Bullish Shark checkbackIf you are looking for a reliable setup for a countertrend move, we have spotted a Bullish Shark Pattern that has checked back.
If you are looking to stretch the target to the daily chart, Bearish Bat Pattern, I find that could be far-fetched for the time being, but I leave that decision to you.

AUDUSD - Bearish SharkTraders are obsessed with corelation in trading, and for many years that relationship has been weaken to a state of pointlessness.
As you can see the the NZDUSD has not completed the Bearish Shark Pattern setup, but the AUDUSD has a completed Bearish Shark, traders can now wait for a checkback at 0.7556.
If you head to the 4-hourly chart, the candle is seated within the buy zone, 0.7459.

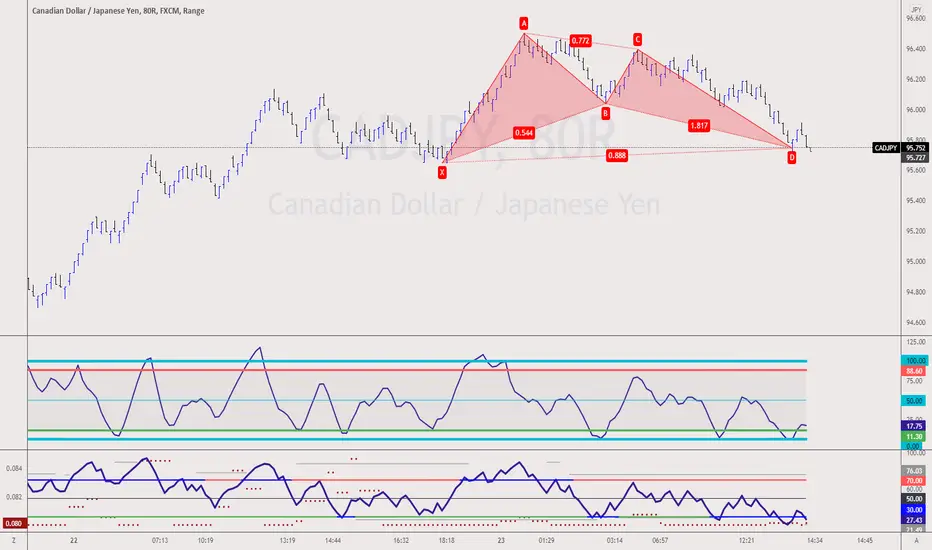
CADJPY - Bat PatternA Bullish Bat Pattern retest on the 8Range Bar. Overall the CADJPY is in a Bullish Trend. If you have plans to hop in the trend trading setup, now is the time.
AUDCAD - Bearish Shark checkbackA Bearish Shark retest on the AUDCAD gave me an opportunity to reverse my trade. You see, I was in a Bullish Trade(you can check out the related ideas titled AUDCAD - Bullish Bat at the bottom of the @TradingView post)
The market seems not able to close beyond Point D of the Bearish Shark Pattern on the 1hourly- chart for an extended period of time.
I've been receiving comments and DMs if AUDCAD appreciates because of Gold and Oil. Well, it is not, the AUDCAD appreciated because I've longed it! ;P
Well, jokes aside, over the years, the correlation between the currency pairs has been weakened. If you are still treating AUD like the Gold movement, you are trading like 10years ago.
I've learned that during chaotic market conditions, it is best to trade via technical analysis.
If I'm wrong about this trade, I get stopped out, and I will wait for the next trading opportunity. It's that simple.
Check out the link at the bottom for our upcoming event or invitation to our community.

AUDCAD - Bearish SharkWill I engage in this Bearish Shark check back on the AUDCAD, time will time. Really. I'm waiting for the 11am(GMT+8) candle open to decide.

USDJPY-Weekly Market Analysis-Mar22,Wk1Congratulation if you have caught the Bearish Deep Gartley Pattern that completed at X, that would have brought you 175pips of profit .
If you have missed that, the USDJPY has a Bearish Shark Pattern completed at 115.75 on the 4hourly chart. It seems that you have just missed the trade, but don't fluster. In most cases, you can expect a retest on the Shark Pattern before it reach its countertrend trading setup, the infamous 5-0pattern.

EURUSD - Bullish Bat PatternA Bullish Bat Pattern is spotted on the EURUSD, this is a sideway market movement. At this moment, I'm waiting for a retest at 1.1164 for a buying opportunity.
If you are interested in this trade, you have to be aware that this trade could take from 3days to 2weeks to complete, there is a weekend risk influenced by the War between Russia and Ukraine(although it still has not shown up in the FX Market)
To avoid weekend risk, you can decide to engage the trade after Market Open on Monday(GMT+8)

GBPUSD-Weekly Market Analysis-Feb22,Wk2GBPUSD has a Bearish Shark setup, if you are a trend trader you can wait for the market check back at 1.3604 for a shorting opportunity within the sell zone.

GBPAUD - Bullish Butterfly checkbackA bullish butterfly pattern checks back and it retests the previous candle wick that complete the butterfly pattern with RSI Divergence.
If this is for you. a Deep Gartley Pattern and Shark Pattern formed on the daily chart for a buying opportunity.
Based on the daily chart it is a trend trading(buying) opportunity for trader.

EURUSD - Bullish Bat retestWe have a Bullish Bat Retest with an RSI Divergence. This is 1 of my favourite combination for an aggressive trade.
Well, I'm in for this. Not quite sure if this will be the trade for you.
Share with me why or why not you will be in this trade?
