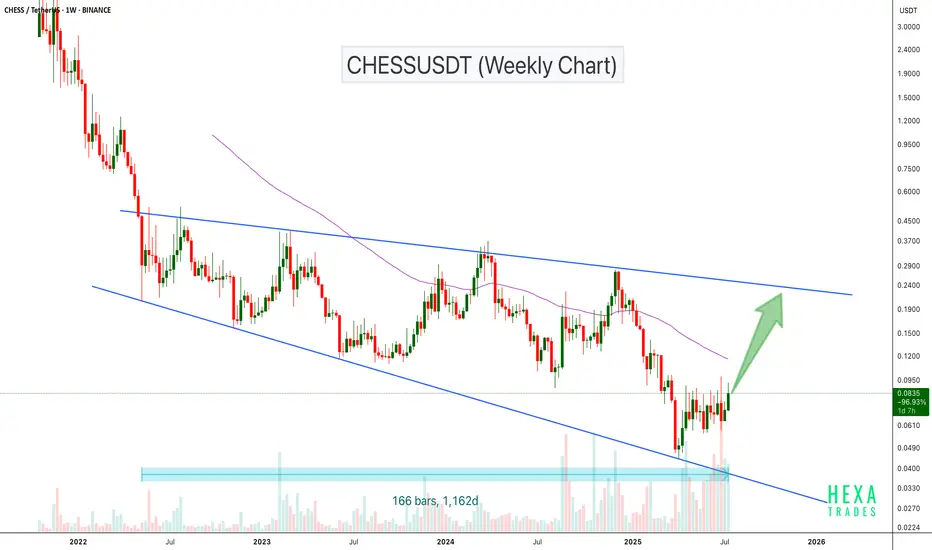
CHESSUSDT Bouncing from Broadening Wedge SupportBINANCE:CHESSUSDT has been trading inside a broadening wedge pattern for the past 1,150 days, showing long-term consolidation. The price recently bounced from the lower support of the wedge with rising volume, a potential sign of a bullish reversal.
If momentum continues, CHESS could move toward the upper wedge resistance in the $0.20–$0.25 range. A breakout above that zone may trigger a much larger trend shift.
Cheers
Hexa
CRYPTO:CHESSUSD
Chessusdtlong
Ultimate Breakout Strategy for CHESS/USDT
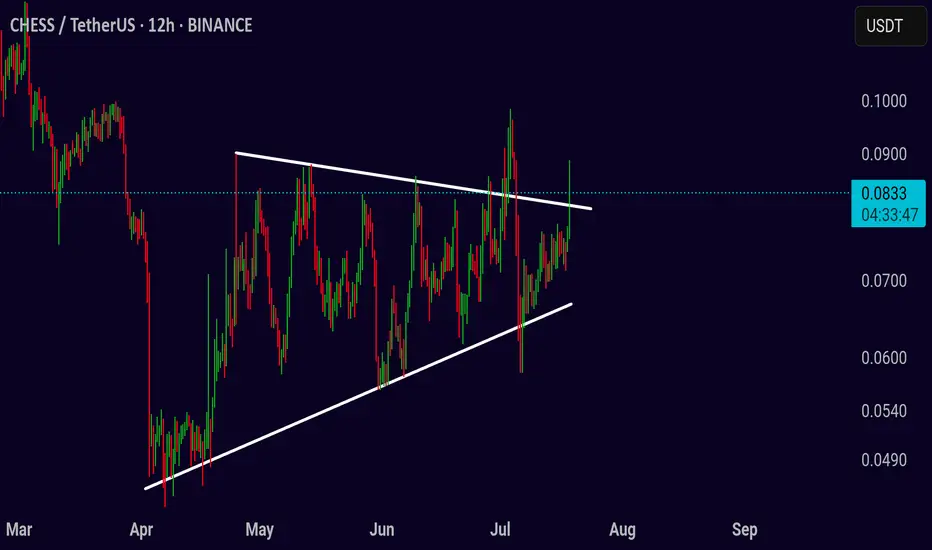
The CHESS/USDT chart is currently consolidating in a symmetrical triangle pattern, signaling that a breakout could be imminent. As the price squeezes within converging trendlines, the next move is critical. Will the price push higher or drop lower? Let’s take a closer look at the potential setups.
Bullish Breakout Opportunity
If the price breaks above the upper resistance at 0.085, this could signal a bullish breakout. A strong move above this level could lead to further upward momentum, targeting levels at 0.095, 0.105, and even 0.115. Placing a stop loss at 0.075 ensures you’re protected if the price fails to maintain the breakout and reverses. Keep an eye on volume—this will be a key indicator to confirm the breakout’s strength.
Bearish Breakdown Risk
If the price fails to break above the resistance and drops below 0.075, it could signal a bearish breakdown. In this case, consider shorting the market with targets at 0.070 and 0.060. A stop loss just above 0.082 can be used to limit risks. Be sure to monitor volume closely to confirm the move, as low volume can lead to false breakdowns.
Pro Tip:
Volume plays a crucial role in validating breakouts and breakdowns. Look for a significant increase in volume when the price breaks key levels. A well-executed risk management plan with proper stop losses will help you stay in control no matter which direction the price moves.
Stay disciplined and follow the price action closely to make the most out of the upcoming move in CHESS/USDT. Whether it’s an upside breakout or a downside breakdown, this strategy prepares you for both scenarios.
#CHESS/USDT – Breakout Confirmed ?#CHESS
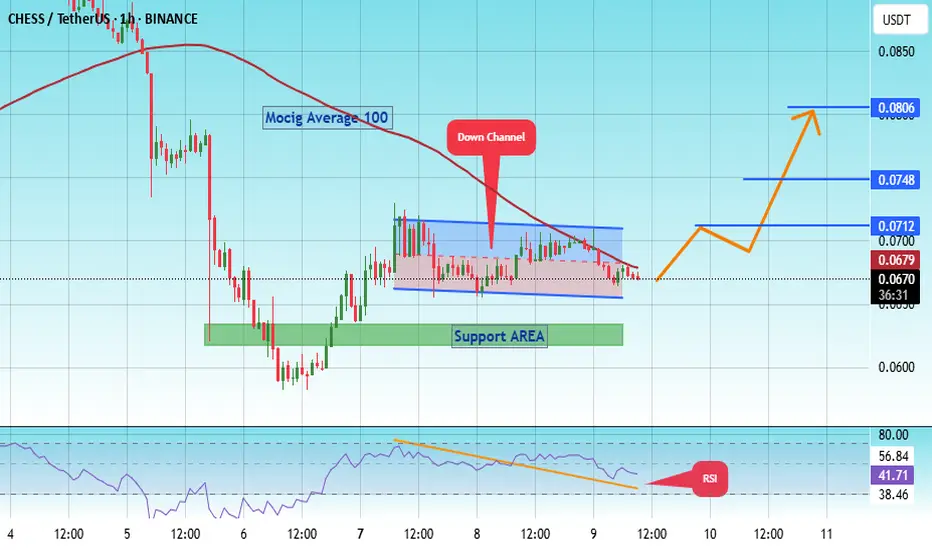
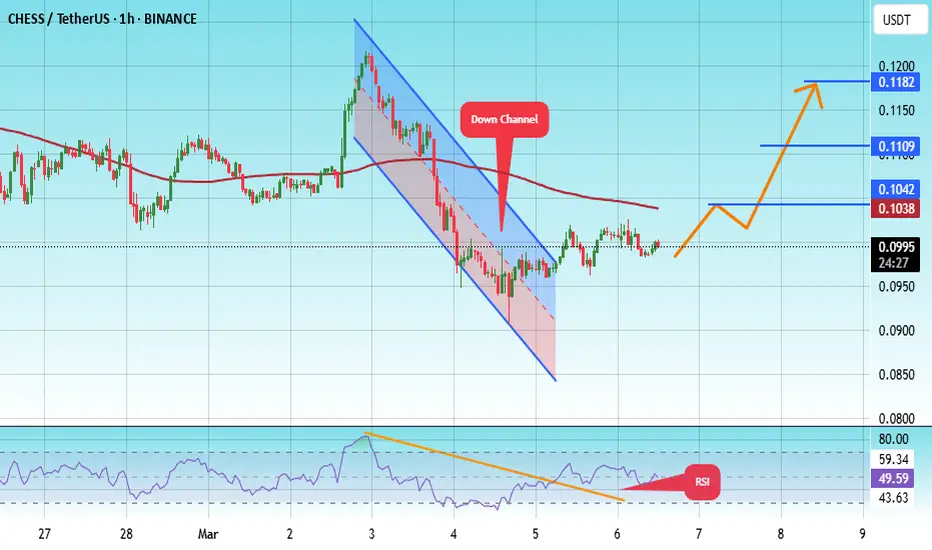
The price is moving within a descending channel on the 1-hour frame, adhering well to it, and is on its way to breaking it strongly upwards and retesting it.
We have a bounce from the lower boundary of the descending channel. This support is at 0.0655.
We have a downtrend on the RSI indicator that is about to break and retest, supporting the upside.
There is a major support area in green at 0.0623, which represents a strong basis for the upside.
Don't forget a simple thing: ease and capital.
When you reach the first target, save some money and then change your stop-loss order to an entry order.
For inquiries, please leave a comment.
We have a trend to hold above the 100 Moving Average.
Entry price: 0.0670.
First target: 0.0712.
Second target: 0.0748.
Third target: 0.0806.
Don't forget a simple thing: ease and capital.
When you reach the first target, save some money and then change your stop-loss order to an entry order.
For inquiries, please leave a comment.
Thank you.
CHESSUSDT Forming Bullish Ascending TriangleCHESSUSDT is shaping up to be a very promising opportunity for traders keeping an eye on altcoins with breakout potential. The chart pattern forming here resembles an ascending triangle, which often signals bullish continuation when confirmed with a strong breakout above the resistance line. The price action shows higher lows and consistent tests of the resistance, suggesting buyers are gradually overpowering the sellers. With good volume backing this setup, the conditions are ripe for a significant move to the upside.
One of the key things driving attention to CHESSUSDT is its strong community and the DeFi ecosystem it supports. As DeFi protocols gain traction again, assets like CHESS that play a role in decentralized governance and yield optimization can see renewed investor interest. This aligns well with the technical breakout potential, adding confidence to the expectation of a 70% to 80% gain in the coming weeks.
Technical traders should watch for a decisive candle close above the resistance zone for confirmation of the breakout. Monitoring volume surges during the breakout will also be essential to validate the move. With the broader crypto market stabilizing, a confirmed breakout on CHESSUSDT could attract momentum traders and investors looking for undervalued DeFi tokens.
✅ Show your support by hitting the like button and
✅ Leaving a comment below! (What is You opinion about this Coin)
Your feedback and engagement keep me inspired to share more insightful market analysis with you!

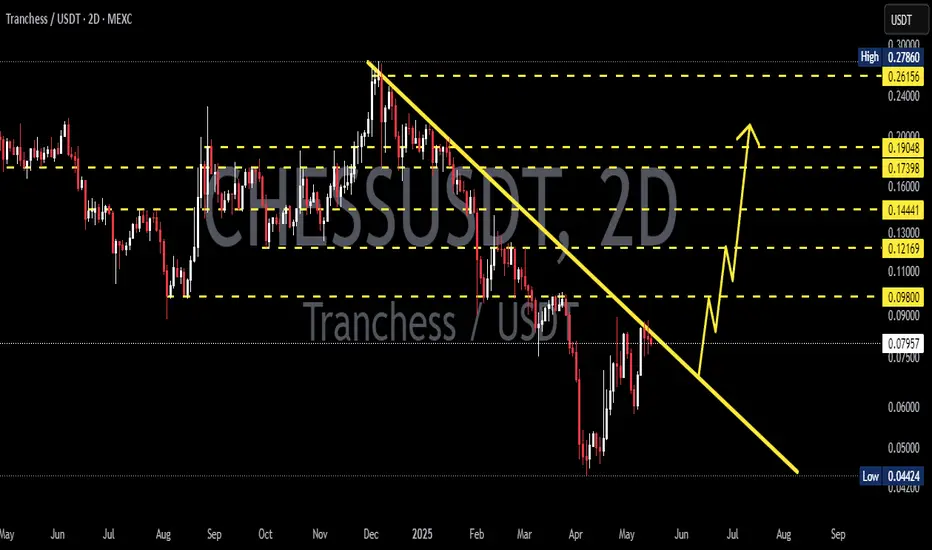
CHESS/USDT – Breakout Confirmed, Bullish Structure in PlayCHESS has officially broken out of a long-term descending trendline and a multi-week consolidation base. This signals the end of a prolonged downtrend and the beginning of a potential bullish expansion.
Technical Analysis:
Breakout: Price broke above the falling trendline and horizontal range ($0.07–$0.085), confirming a bullish structure.
Structure: Ascending triangle breakout + clear higher lows and higher highs forming.
Volume: Strong breakout candle with above-average volume suggests follow-through potential.
Retest Zone: Previous resistance near $0.085 now acting as support, offering a possible re-entry zone.
Key Levels:
Support Zones
$0.085 – Previous resistance, now flipped support
$0.070 – Ascending trendline zone
$0.056 – Range base and invalidation zone
Resistance / Target Levels
$0.100 – Minor psychological round number
$0.121 – Previous consolidation resistance
$0.173 – Key breakout target
$0.276 – Macro bullish target if trend continues
Trade Plan:
Entry: Any retest between $0.085–$0.090
Stoploss: Below $0.070 (conservative) or tight below $0.078 (aggressive)
Targets: $0.100 → $0.121 → $0.173 → $0.276
Risk Management: Use proper position sizing; invalidation below $0.070
This breakout appears structurally clean and may offer a strong follow-up if market conditions remain favorable. Ideal for both short-term swing and medium-term positional setups.
Not Financial Advice | DYOR Always

#CHESS/USDT#CHESS
The price is moving within a descending channel on the 1-hour frame and is expected to break and continue upward.
We have a trend to stabilize above the 100 moving average once again.
We have a downtrend on the RSI indicator, which supports the upward move by breaking it upward.
We have a support area at the lower limit of the channel at 0.0640, acting as strong support from which the price can rebound.
Entry price: 0.0642
First target: 0.0688
Second target: 0.0722
Third target: 0.0756

CHESS/USDT (1D) – Daily Trendline Breakout in PlayTradingView Idea: CHESS/USDT (1D) – Daily Trendline Breakout in Play
Pattern: Falling Trendline Breakout 📉➡️📈
Timeframe: 1-Day ⏱️
Pair: CHESS/USDT 💱
Published: June 11, 2025 📅
**Technical Overview:**
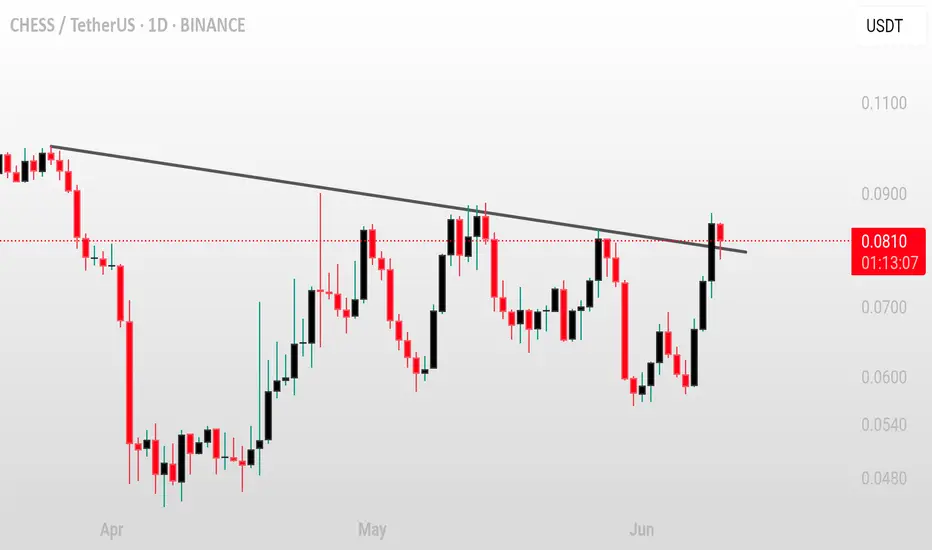
CHESS/USDT has been moving under a long-standing falling trendline, with price consistently making lower highs. Recently, it has broken above this trendline on the daily timeframe, signaling the start of a potential trend reversal.
A strong close above the breakout zone, combined with rising volume, could confirm bullish continuation 🔥
**Potential Trade Setup:**
**Bullish Scenario ✅**
Entry: On confirmation and daily close above 0.082–0.085
Targets:
* First target at 0.095 🎯
* Second target at 0.110 🎯
* Third target at 0.130–0.150 🎯
Stop-loss: Below 0.075 🛑
**Risk Management ⚠️**
Watch for volume confirmation to avoid false breakouts. If CHESS drops back below 0.080, the move may fail or consolidate before a second attempt.
**Conclusion:**
CHESS is showing strong breakout behavior. If confirmed, this could mark a mid-term reversal with solid upside potential 📊🔍
CHESSUSDT 2D Analysis CHESS ~ 2D Analysis
#CHESS This trade is very high risk
Buy after successfully breaking through this resistance line with a short-term target of at least 10%+.
#CHESS/USDT#CHESS
The price is moving in a descending channel on the 1-hour frame and is adhering to it well and is heading to break it upwards strongly and retest it
We have a bounce from the lower limit of the descending channel, this support is at a price of 0.870
We have a downtrend on the RSI indicator that is about to break and retest, which supports the rise
We have a trend to stabilize above the moving average 100
Entry price 1.00
First target 1.05
Second target 1.12
Third target 1.20
Chess / USDT: preparing for a breakout as it rebounds from key sCHESS/USDT: Preparing for a Breakout as It Rebounds from Key Support
CHESS/USDT is showing bullish signs 📈 as it rebounds from a significant support zone and approaches a key resistance level 📊. The pair has been steadily climbing, setting the stage for a potential breakout 💥 above resistance. A confirmed move could spark strong bullish momentum 🚀. Stay alert 👀 and wait for solid confirmation before making any moves.
Key insights:
1. Support bounce: CHESS/USDT has successfully rebounded from a critical support level, signaling strong buyer interest and increasing the likelihood of a bullish move.
2. Approaching resistance: The price is nearing a resistance zone that has capped previous upward movements. A break above this level could trigger a sustained uptrend.
3. Bullish indicators: Momentum indicators like RSI and MACD are turning upwards ⚡, supporting the case for further bullish momentum.
Steps to confirm the breakout:
Monitor for a clear 4H or daily candle closing above the resistance zone 📍.
Look for a spike in trading volume during the breakout to validate buyer strength 🔥.
A successful retest of the resistance level as new support adds credibility to the breakout ✅.
Beware of fakeouts, such as wicks or sharp reversals below the resistance ⚠️.
Risk management strategies:
Use stop-loss orders to minimize potential losses 🔒.
Adjust position sizes to align with your overall risk tolerance and trading strategy 🎯.
This analysis is for educational purposes only and does not constitute financial advice. Always conduct your own research (DYOR) 🔍 before making investment decisions.

CHESS/USDT on the verge of a big breakout!🚀 CHESS/USDT on the verge of a big breakout! 🚀
The CHESS/USDT pair is showing signs of a potential breakout, and the momentum is building up. 📈 The price is testing key resistance levels, and if it successfully breaks through, we could see a solid bullish rally. 🔥
💡 What to watch for:
- A confirmed breakout above the resistance could trigger a sharp upward move. 🚀
- Increased trading volume may signal stronger buying interest. 📊
👀 Keep an eye on it: This setup could present exciting opportunities. However, always do your own research and manage your risk. 🧐
⚠️ Disclaimer: This is not financial advice. DYOR (Do Your Own Research).

#CHESS/USDT#CHESS
We have a bearish channel pattern on a 1-hour frame, the price moves within it and adheres to its limits well
We have a green support area at 0.1773 after the price touched it and bounced from it
We have a tendency to stabilize above moving average 100
We have an uptrend on the RSI indicator that supports the price higher
Entry price is 0.1830
The first goal is 0.1949
The second goal is 0.2000
The third goal is 0.2070

#CHESS/USDT#CHESS
We have had a symmetrical bearish channel since July 2022
It was broken by moving average 100 upwards
We are heading to touch the downward trend of the channel as a first goal
Current price 0.1853
Second goal 0.3228
Third goal 0.5094
Which represents 280% of the current price

CHESSUSDT Resistance Breakout!CHESSUSDT Technical analysis update
The CHESS price has broken its resistance trend line after 675 days of consolidation. We can expect a gradual upmove in CHESS in the coming days.
Buy zone : Below $0.33
Stop loss : $0.245
Regards
Hexa

#CHESS/USDT [Tranchess]: Super_Trend Bollinger_BreakoutWe've detected both a Bollinger Band breakout and a Super Trend pattern on the CHESS/USDT chart. Both indicators are signaling a bullish trend, with the Bollinger Band indicating a potential bullish trend as the price has moved outside of the upper band and the Super Trend showing a bullish trend. This is a stronger bullish signal as both indicators are aligned. It may be a good idea to consider buying at the current price zone and targeting higher levels. However, it is still important to consider other factors such as overall market conditions, and other technical indicators before making a trade decision.
