History Says Chevron (CVX) Is Set To Decline At Least 5%Chevron has climbed quick in the previous month. This could be due to hurricanes in the United States and/or OPEC manipulation. No matter the world and economic reasoning, the technicals have a response for this overexuberant movement; the stock will begin dropping soon. The history of this stock has been studied and the information is explained below.
The relative strength index (RSI) is at 80.3974. RSI tends to determine trends, momentum, overbought and oversold levels as well as likelihood of price swings. I personally use anything above 75 as overbought and anything under 25 as oversold. Currently the RSI is at an extreme level that has only occurred 26 times since 1973. The significance of this is outlined below and is the first signal of a pending downturn.
The positive vortex indicator (VI) is at 1.3839 and the negative is at 0.5046. When the positive level is higher than 1 and higher than the negative indicator, the overall price action is moving upward. When the negative level is higher than 1 and higher than the positive indicator, the overall price action is moving downward. The both values are near extremes and this in conjunction with the extreme RSI reading will be covered in the SPECIFIC ANALYSIS section below.
The stochastic oscillator K value is 95.0678 and D value is 83.0602. This is a cyclical oscillator that is highly accurate and can be used to identify overbought/oversold levels as well as pending reversals and short-term activity. I personally use anything above 80 as overbought and below 20 as oversold. When the D value is higher that the K value the stock is trending down. The stochastic is in overbought territory, but it could be another week before the D value is larger than the K value. In order for this crossover to occur, the stock would begin declining. We are looking to short the stock prior to this decline and more is explained below.
SPECIFIC ANALYSIS
I have created an algorithm (called SAG Gauge) which signals when stocks are truly overbought and oversold. The algorithm indicates when a particular stock meets multiple criteria culminating in an oversold or overbought signal. That signal will most likely occur within a few trading days after the stock has begun to move downward. Recognizing this movement and pending signal can increase profit by entering early.
Upon back-testing this indicator, it has signaled overbought status 111 times dating back to 1973. Seventy percent of the time, the stock drops at least 3% over the following 30 trading days after the indicator date. Sixty percent of the time the stock drops at least 5% and fifty percent of the time loses 6.5%. Even though a drop does not always occur, taking the below information into consideration makes us believe we are in that 60% of the time range.
As mentioned above, the RSI alone is at an extreme level that has only occurred 26 individual trading days since 1973. The stock always drops at least 1.58% from the date it reaches the 80.3974 level (which was just achieved on Sept 22) over the following 30 trading days. The median drop over this time frame is 5.71%, average is 6.81% and the maximum drop is 20.35%.
Since 1973, this stock always drops at least 5% when the RSI is at or above its current level, while the positive VI is at or above its current level and the stochastic is in overbought territory. These conditions have only been met four times and the instances were evaluated. The median decline for the stock has been 15.08% over the following 30 trading days. On three of these four occasions, the stock continued to go up for at least 2 more trading days. This additional climb resulted in a minimum stock decline of 6.75%.
Between all of the mentioned historics, I believe the stock could drop at least 5% over the following 40 trading days if not sooner. The best indicator is the simultaneous extremes that have been achieved by the RSI & positive VI. The RSI extreme alone supports this belief & the SAG helps.
Chevron

Chevron Buy IdeaD1 - Bullish Convergence
H1/H4 - Looking for two waves down, Trend line breakout for entries
Invalidation - If price breaks below 102.40

Feeding The Chevron BearsOn April 7, 2017, the Chevron Corporation ( CVX ) crossed below its 150 day moving average (MA). Historically this has occurred 253 times and the stock does not always drop. The stock has a median loss of 3.162% and a maximum loss of 55.271% over the next 15 trading days.
When we take a look at other technical indicators, the relative strength index (RSI) is at 48.9096. RSI tends to determine overbought and oversold levels as well as likelihood of price swings. I personally use anything above 75 as overbought and anything under 25 as oversold. The current reading declares the stock is relatively neutral, with no clear volatile price swing on the horizon.
The true strength index (TSI) is currently -16.6606. The TSI determines overbought/oversold levels and/or current trend. I solely use this as an indicator of trend as overbought and oversold levels vary. The TSI is double smoothed in its calculation and is a great indicator of upward and downward movement. The current readin declares the stock is down, and has remained around its current reading for a few weeks. This indicator should have moved up or down by now which adds to the uncertain future and leaves a drop in the stock price well within play.
The positive vortex indicator (VI) is at 1.0845. When the positive level is higher than 1 and higher than the negative indicator, the overall price action is moving upward. When the negative level is higher than 1 and higher than the positive indicator, the overall price action is moving downward. The current reading declares the stock is moving up.
The stochastic oscillator K value is 71.4480 and D value is 69.7333. This is a cyclical oscillator that is highly accurate and can be used to identify overbought/oversold levels as well as pending reversals. I personally use anything above 80 as overbought and below 20 as oversold. When the K value is higher than the D value, the stock is trending up. When the D value is higher that the K value the stock is trending down. The current reading declares the stock has been moving up, but the divergence between the two has recently narrowed and a downturn is likely to quickly occur.
Considering the moving average crossover, RSI, TSI, VI and stochastic levels, the overall direction appears to be heading down. Based on historical movement compared to current levels and the current position, the stock could lose another 2.28% over the next 15 trading days. On the day previous to this negative cross below the MA, the stock crossed above. The last 11 times in the past decade, the stock crossed and closed below the MA one day after it closed above the MA, the stock dropped a minimum of 1.728%.

CVX @ daily @ closed higher last 3 trading days every dayThis is only a trading capability - no recommendation !!!
Buying/Selling or even only watching is always your own responsibility ...
.zip (with PDF`s) @ my Google Drive
Closings Bullish (Dow Jones Index incl. all shares)
drive.google.com
Best regards :)
Aaron

CVX @ 1h @ will the 116 & upside trend (since end of oct) hold ?Take care
& analyzed it again
- it`s always your decision ...
(for a bigger picture zoom the chart)
Best regards
Aaron

CVX @ 15 min @ GAP (116 & 118) should be a recreational poolCVY got an challenging 15min chart - no question !!! But also tradeable ...
The trend channel starts more or less around 114 & 116 this week & ends around 115 & 117 more or less. But much more important is the GAP (after OPEC news while weekstart - even last monday) even between 116 & 118. `cause you can see, while last trading day (on friday) traders traded CVX in something like a breakout-formation (two times higher highs & higher lows) - but under weekly high from monday. And from thuis point of view, i am wouldn`t wondering if CVX the GAP develop to something like a recreational pool next week (between 116 & 118) ...
Take care
& analyzed it again
- it`s always your decission ...
(for a bigger picture zoom the chart)
This is only a analysis (for swing traders) - no recommendation !!!
Buying/Selling or even only watching is always your own responsibility ...
With swing trading i mean (in this context) until end of this trading week :)
Best regards
Aaron

CHEVRON @ 15 min @ last big Resistance around 109.27 left behind2014 CVY was traded between 109.27 (low before ATH) & 135.10 (ATH)
Important is my opinion, from the technical point of view also the fact, that the 1st Downside Wave after ATH (Aa, Bb & Cc) created a last high (C) by 120.17. And this should be also the first target into 2017 ...
1st GAP bewteen 113.14 & 112.48
2nd GAP between 112.55 & 112.07
3rd GAP between 111.28 & 110.64
These are all buying oppurtunities - this week & next week.
Take care
& analyzed it again
- it`s always your decission ...
(for a bigger picture zoom the chart)
Best regards
Aaron

CHEVRON @ Daily @ 1st Close above 2015 Yearly HighMaybe the most interesting technical picture of all DOWI shares !?
How ever,
this week was very exciting - very volatile and created an ambitionaly SetUp ...
113.29 CVX closed @ todays Thursday Trading Day
112.98 CVX was Yearly High 2015
107.68 CVY was Yearly High 2016 (before Trump Election)
Actuallity Trading Box (last 2 trading days) is the way to go
- even the SetUp TradingBox, if i am not wrong (between 114.91 & 111.27) ...
Above 114.91 i would prefere the long side into year end 2016
with a target of > 120.31 (zoom chart for a better technical understanding)
- & the Sentiment should also be not against (emotional resistances) energy stocks
Take care
& analyzed it again
- it`s always your choice ...
Best regards
Aaron

CVX is holding $100, but for how long?Technically Speaking
CVX is holding the $100ish pivot level. The longer it holds the more likely the next move will be to the upside.
Fundamentals
Here is a company summary.
What to do?
First, is this a trade or a long-term holding? What is YOUR time frame? You have to decide.
The R/R favors the long side, in my opinion. A long position here, stopping out under 96.00.
Checklist
Should I buy?
* Is this a technical trade or part of my long term holdings. Establishing a time frame is very important.
* Is it trading at an important technical level that is obvious to all market participants?
* Is the R/R in your favor?
* What is the likelihood this company will either go bankrupt or it's products or services become obsolete?
* How much debt do they have?
* If heavily indebted, how much is coming due in the next 3-5 years? Can they cover their debt payments based on reasonable analysis?
* Will their product or service become obsolete? This really is too hard to say, too many things looked obvious in hindsight, think Blackberry. However, I think it is constructive to think about, especially if you are planning to hold a stock for the long term.
Risk
* For individual securities, risk no more than 3% as a starting position. You can always add later.
* Write down a price level that you will consider liquidating all or part of the position.
* What is a reasonable price target?
Execution
* After going through the checklist above, are you still willing to risk your money? If yes, TAKE THE TRADE.
OVER THE LONG TERM, THE WAY TO WIN IS TO HOLD ONTO YOUR WINNERS, AND CUT YOUR LOSERS. IT IS AS SIMPLE AND AS HARD AS THAT.

Confirmation of rising wedge's breakout (CHEVRON)Signals
rising wedge with breakout
flag with breakout
Sell 102.00-101.00
Stop-loss 103.60 (flag's high)
Target 93.50 (sizing+strong support)
R\R ratio 1:3

Chevron sell the rallyAfter a strong impulse down Chevron is in what appears to be a corrective structure.
We will be waiting for a break out of the lower trend line. Once that happens we will watching on lower time frames for a retest and rejection before taking the short position. The targets would be 55, 30 & 15 which are previous strong support levels.
If the rally breaks up and out of the 110 level then this trade will be invalid.

Someone sees a bright future for chevron ( CVX )Oil went below 40$ in August for the first time since early 2009. It did try to mount a rally to no avail before collapsing to 26$. During this time Chevron never made new low. That is a call a divergence, a major divergence that is and that is a bullish sign.
Furthermore, since its August low, CVX printed a nice impulse ( the trend ). The ensuing move looks corrective to us. Now CVX appears to be ready to take off to at least 104 where we will have equality between trending waves. If there's more fuel in CVX then 110 is a major resistance where we have the 61.8% retracement of the previous decline and the apex of a bearish triangle where prices often stall.
Only a move below 69.70 will negate this view

Buy set up from a short term corrective move.A clean and neat impulse wave followed by a nice Zig Zag correction.
Break out of the correction pattern can give us another impulse.

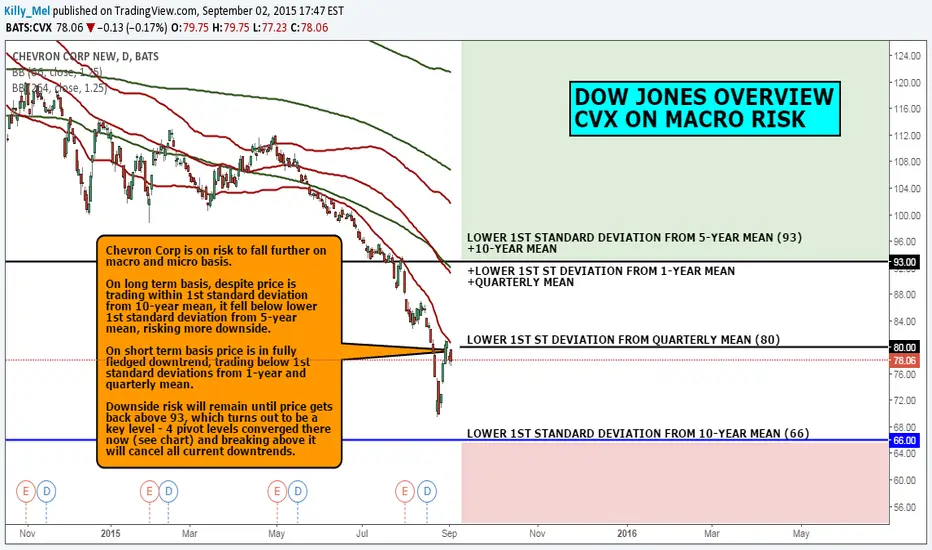
DOW JONES OVERVIEW: CVX IS ON MACRO RISKChevron Corp is on risk to fall further on macro and micro basis.
On long term basis, despite price is trading within 1st standard deviation from 10-year mean, it fell below lower 1st standard deviation from 5-year mean, risking more downside.
On short term basis price is in fully fledged downtrend, trading below 1st standard deviations from 1-year and quarterly mean.
Downside risk will remain until price gets back above 93, which turns out to be a key level - 4 pivot levels converged there now (see chart) and breaking above it will cancel all current downtrends.
Binary Event - Bullish moveCVX is a correlative equity to XOM. These are consist in trend moves comparable to other equities in their sector. You want volatility for the option's play. Right now, CVX is at a crossroads with an IV of 73 and HV 71. With earnings coming up, we're expecting a shift north till the end of this year's first quarter. That's a good play to go deep in options. FEB (22) Call Strike 105 is our target for front month. APR 15 (78) Call Strike is 110 and/or 115. The decrease in IV over the next months in consideration of the options months shows favorable signs of going north. Tomorrow is we'll know.

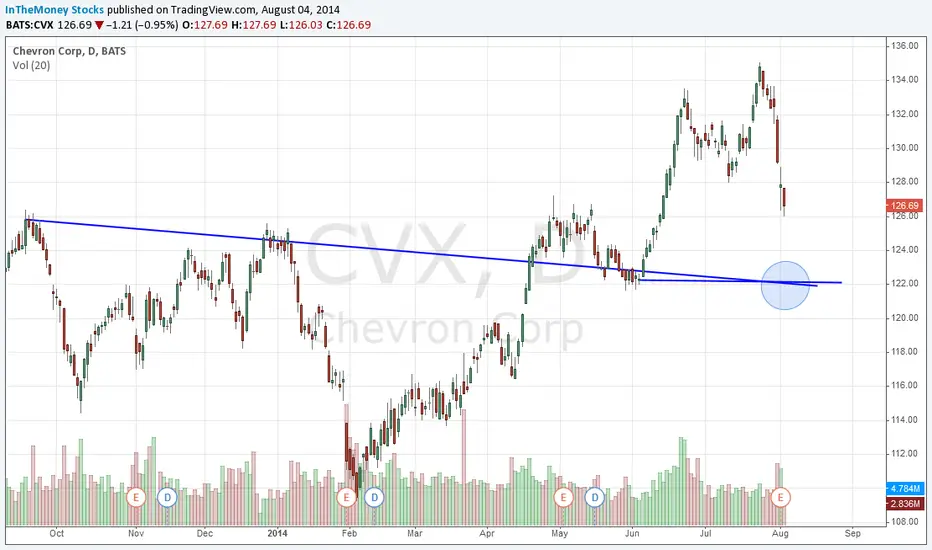
Chevron Corporation Collapses Off Highs: Buy It HereChevron Corporation (NYSE:CVX) has dropped sharply over the last week. The stock just made a new all-time highs prior, and is seeing profit taking. Chevron Corp will hit support at $122.00. This is a culmination of support trend lines as well as the 200 daily moving average. A significant bounce should occur if this level is hit in the next week. Chevron can be taken as a swing trade.
Gareth Soloway
Chief Market Strategist
www.InTheMoneyStocks.com