CHFJPY Monthly AnalysisHere is my view for CHFJPY for monthly timeframe. The price could go bullish, you can put a pending order on the Order block or find an entry on LTF within OB Zone. Trade Safe!
Chfjpyanalysis

CHFJPY LONG - BULLS STILL ALIVE!Waiting for a retest of 153.969 to long CHFJPY back to 4H swing highs at 155.346
If you agree drop a like and if you have any questions leave a comment :)

DeGRAM | CHFJPY potential sell after the retracementCHFJPY is trading in the ascending channel, which is just a pullback of the bearish momentum move.
The market tested major resistance and then fell, which could be a potentially BC move of the AB=CD pattern.
Price action will most likely break and close below the channel and continue to trend downward.
-------------------
Share your opinion in the comments and support the idea with like. Thanks for your support!

CHFJPY - Bullish price action ✅Hello traders!
‼️ This is my perspective on CHFJPY.
Technical analysis: Here we are in a bullish market structure from 4H perspective, so I expect continuation of bullish price action as price rejected from bullish order block from discount zone. I see price to make new higher high.
Fundamental analysis: Tomorrow we have news on CHF, will be released monthly CPI which is forecasted to increase. If the result will be like forecasted it will support our analysis
Like, comment and subscribe to be in touch with my content!

CHFJPY top-down analysis Hello traders, this is a complete multiple timeframe analysis of this pair. We see could find significant trading opportunities as per analysis upon price action confirmation we may take this trade. Smash the like button if you find value in this analysis and drop a comment if you have any questions or let me know which pair to cover in my next analysis.

CHFJPY - Short IdeaOver the last 12 months, its price rose by 15.42 percent. CHF/JPY is heading towards the resistance line at 156.14. Looking ahead, we forecast Swiss Franc Japanese Yen to be priced at 158.46 in one year, according to Trading Economics global macro models projections and analysts expectations.

CHFJPY- 1100+ PIPS SELLING OPPORTUNITYCHFJPY is on the way of touching the all time high, making the history of CHF strongest dominance over JPY. We are expecting price to drop from 157-158 price range. Let's see how it performance.

DeGRAM | CHFJPY testing the 1979 year resistanceCHFJPY is testing the resistance that was tested in 1979.
The market is getting close to the kill zone, which includes psychological level 155.000 and fibo inversion level.
If you short this market, it can potentially go down forever from this level.
-------------------
Share your opinion in the comments and support the idea with like. Thanks for your support!

CHFJPY TradingView H1Here is my view for CHFJPY on H1. The price could go bullish, you can put a pending order on the Order block or find an entry on LTF within OB Zone. Trade Safe!

CHFJPY SELLit seems that the strength of up-trend is getting weaker and it's suitable for Sell (Short Position)

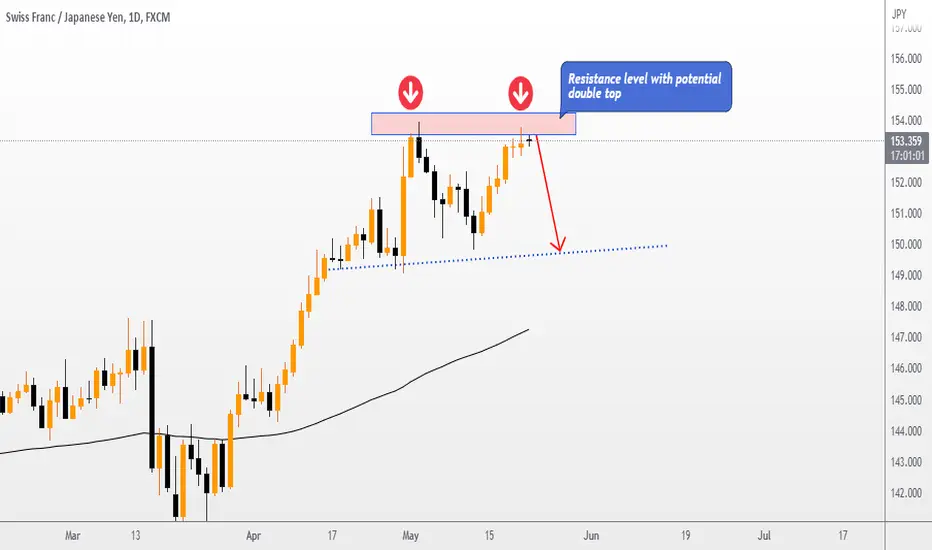
Sell CHFJPY from potential double top in the resistance level?In the daily chart, we can see that CHF/JPY's rally has halted at the resistance level with the
formation of a potential double top. So, based on the chart, a sell entry between 153.55-153.90
with SL above 154.50 and TP at 150 would be a good sell trade with great risk: reward.
CHFJPYI am looking to sell at 152.050 with a stop-loss at 152.550 and a take-profit at 148.000. The price has recently broken out but is currently experiencing a retracement. Additionally, the JPY index is nearing Fibonacci levels, which I anticipate will lead to a reversal.

CHFJPY Technical Analysis and Trade IdeaAnalysis of the CHFJPY currency pair reveals that it has risen above the two previous daily highs, tapping into buy-side liquidity. The potential for a price retracement exists given that this rally is overextended and has a price gap below. In the video, we look at a variety of aspects including price action, price gaps, trends, and key levels of support and resistance that may offer trading opportunities. The opinions expressed are solely mine, and this content is only meant for educational purposes, it is important to note. This is not intended to be financial advice in any way.


CHFJPY - Long active ✅Hello traders!
‼️ This is my perspective on CHFJPY.
Technical analysis: As I expected in my previous analysis price filled the imbalance and rejected from bullish order block + institutional big figure 150.000. Now I see price to form new higher high.
Like, comment and subscribe to be in touch with my content!

DeGRAM | CHFJPY sell pullback from the kill zoneCHFJPY is trading in the descending channel on the 4H timeframe.
The market is approaching the kill zone: channel border, golden ration, and psychological level at 152.000.
Price action is printing lower lows and lower closes, indicating bears are in control.
The price is most likely to react to this level by rejecting it.
-------------------
Share your opinion in the comments and support the idea with like. Thanks for your support!

CHFJPY TradingView W1Here is my view for CHFJPY on W1. The price could go bullish, you can put a pending order on the Order block or find an entry on LTF within OB Zone. Trade Safe!

CHFJPY - Long#CHFJPY In Daily Time Frame Setup
In This Setup CHFJPY is Going to Buy
Show some Bullish Moves

DeGRAM | CHFJPY selling opportunityCHFJPY is trading in the descending channel.
The market is testing the resistance, fibo level, and dynamic resistance.
Price action is printing lower lows and lower closes, indicating bears are in control.
The price is likely to test the support level.
-------------------
Share your opinion in the comments and support the idea with like. Thanks for your support!

CHFJPYMy bias on this pair is to the upside after it reject at the trendline support forming n inverse head and shoulder in 1hr tf, target is at 154.761


CHFJPY - Long from bullish order block ✅Hello traders!
‼️ This is my perspective on CHFJPY.
Technical analysis: Here we are in a bullish market structure from 4H timeframe perspective, so I am looking for longs from discount zone. I expect price to go a little bit lower and then to reject from bullish order block + institutional big figure 150.000.
Like, comment and subscribe to be in touch with my content!

CHFJPY LongJapan did not increased its interest and this may cause its bearish momentum. I believe CHFJPY will rise next week.
