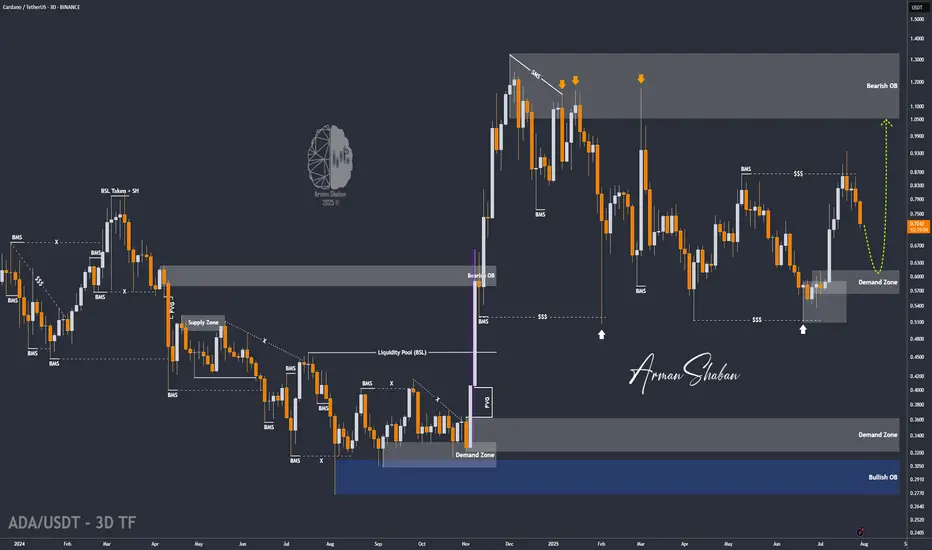
ADA/USDT | ADA Slips Below Support – Watching $0.61 for Support!By analyzing the Cardano chart on the 3-day timeframe, we can see that the price failed to hold above the $0.75 support and is currently trading around $0.72. Given the current momentum, a deeper correction for ADA seems likely. If the price fails to stabilize above $0.69, we could see a sharp drop toward the $0.61 zone. If ADA reaches this key support area, keep a close eye on it — a strong bullish reaction could lead to the next big upside move!
Please support me with your likes and comments to motivate me to share more analysis with you and share your opinion about the possible trend of this chart with me !
Best Regards , Arman Shaban
Chiliz
DOGE/USDT | Eyes Bounce from Key Support – Next Targets Ahead!By analyzing the Dogecoin chart on the daily timeframe, we can see that after reaching the $0.29 area, the price entered a correction and is now trading around $0.22. If DOGE dips into the key support zone between $0.19–$0.21, we could expect a strong bullish reaction. The next potential targets are $0.287, $0.32, $0.41, and $0.70.
Please support me with your likes and comments to motivate me to share more analysis with you and share your opinion about the possible trend of this chart with me !
Best Regards , Arman Shaban

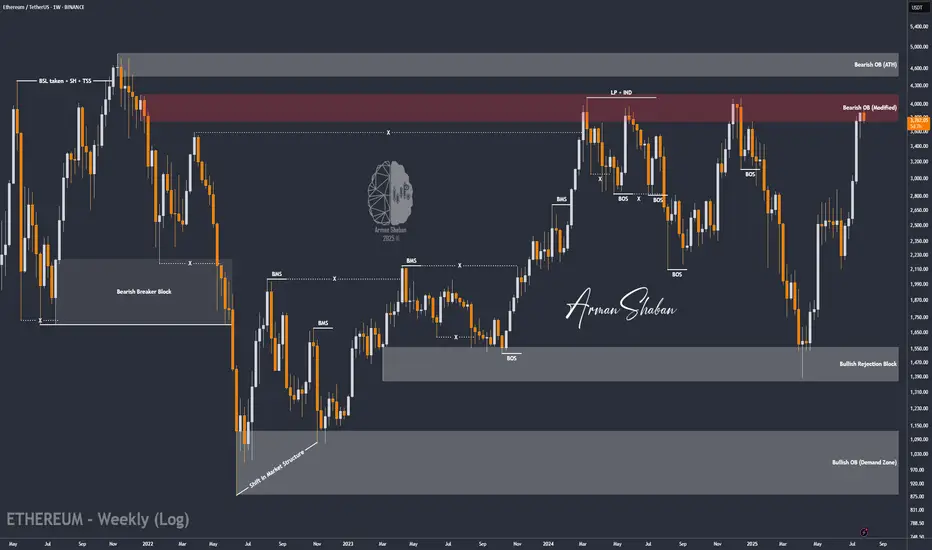
ETH/USDT | at a Crossroads – Hold Above $3440 or Sharp Fall!By analyzing the Ethereum chart on the weekly timeframe, we can see that after reaching $3940 and touching the key supply zone, ETH entered a slight correction and is currently trading around $3756. The key question now is whether it can hold above $3440 by the end of the week and push past $4000. If it does, we can expect another bullish leg toward $4100 and $4470. However, if the $3440 support fails, a sharp decline may follow — so this level is critical.
Please support me with your likes and comments to motivate me to share more analysis with you and share your opinion about the possible trend of this chart with me !
Best Regards , Arman Shaban
ETH/USDT | The Next Target is $4000 and it's Close! (READ)By analyzing the Ethereum chart on the weekly timeframe, we can see that this cryptocurrency remains one of the strongest major cryptos in the market, continuing its bullish rally despite the overall market correction. It has already hit the next target at $3500, and I believe we might see Ethereum reaching $4000 sooner than expected! Based on previous analyses, if this bullish momentum continues, the next targets will be $3740, $4100, and $4470.
Please support me with your likes and comments to motivate me to share more analysis with you and share your opinion about the possible trend of this chart with me !
Best Regards , Arman Shaban

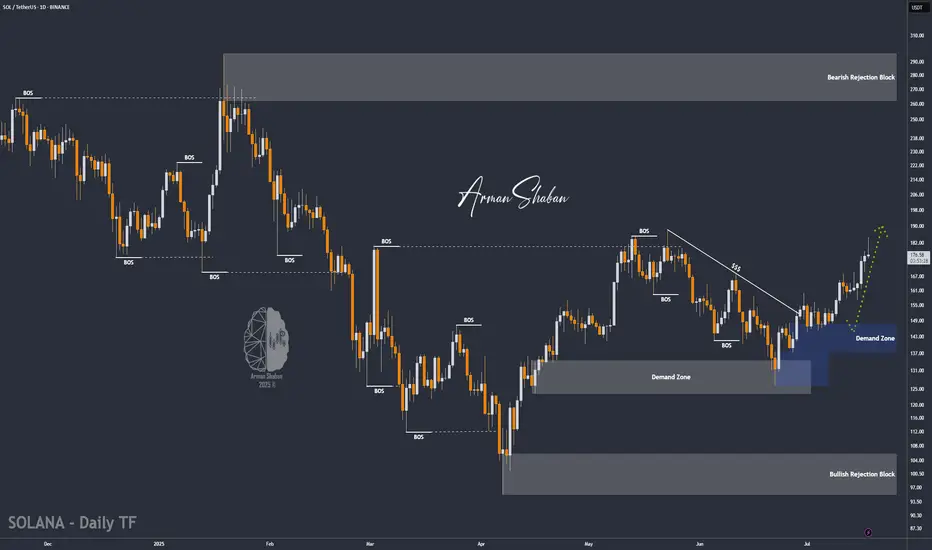
SOL/USDT | Next Bullish Leg Ahead if Key Support (READ)By analyzing the Solana chart on the daily timeframe, we can see that today the price climbed to $184, almost hitting the next target at $187, before facing a correction. It is currently trading around $176. If Solana manages to hold above the key support zone between $168 and $174, we can expect the next bullish leg to start, potentially extending up to $227. The previous analysis remains valid, with the next upside targets at $187, $220, and $263.
Please support me with your likes and comments to motivate me to share more analysis with you and share your opinion about the possible trend of this chart with me !
Best Regards , Arman Shaban
DOGE/USDT : eyes More Gains – Mid-Term Targets Up to $0.70! By analyzing the Dogecoin chart on the daily timeframe, we can see that since our last analysis around 7–8 months ago, the price started its rally from $0.10 and surged over 370% to reach $0.48. After that, it corrected back to around $0.13 and is currently trading near $0.27. If Dogecoin manages to hold above $0.25, we can expect further upside movement in the mid-term. The next targets are $0.287, $0.32, $0.41, and $0.70.
Please support me with your likes and comments to motivate me to share more analysis with you and share your opinion about the possible trend of this chart with me !
Best Regards , Arman Shaban

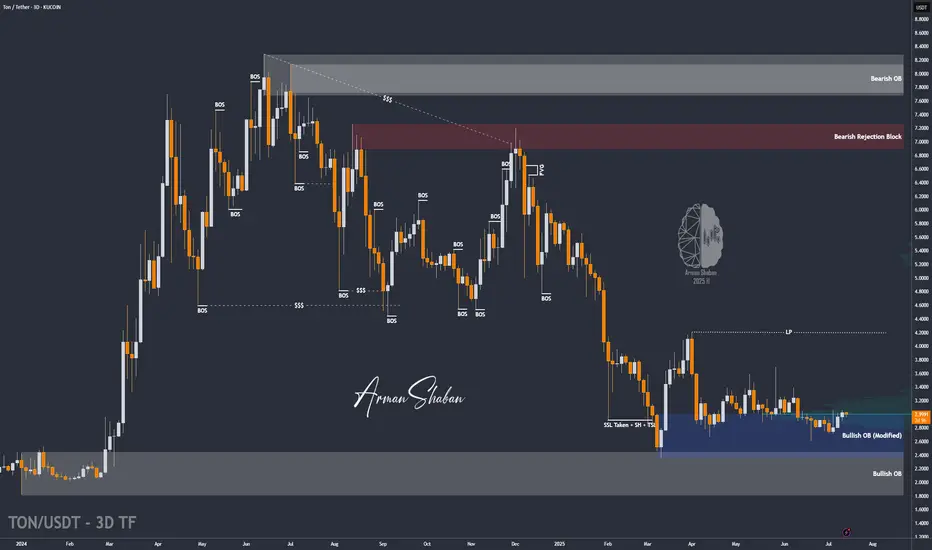
TON/USDT | Another Bullish Move Ahead? (READ THE CAPTION)By analyzing the Toncoin chart on the 3-day timeframe, we can see that, as per yesterday’s analysis, the price climbed to $3.36 before facing a slight correction — which is perfectly normal since every strong bullish trend needs a healthy pullback. The $3.05–$3.20 zone could serve as a good accumulation area for buyers, and we may soon witness another impressive rally from Toncoin! Based on the previous analysis, the next targets are $3.63, $4.20, and $4.68.
Please support me with your likes and comments to motivate me to share more analysis with you and share your opinion about the possible trend of this chart with me !
Best Regards , Arman Shaban
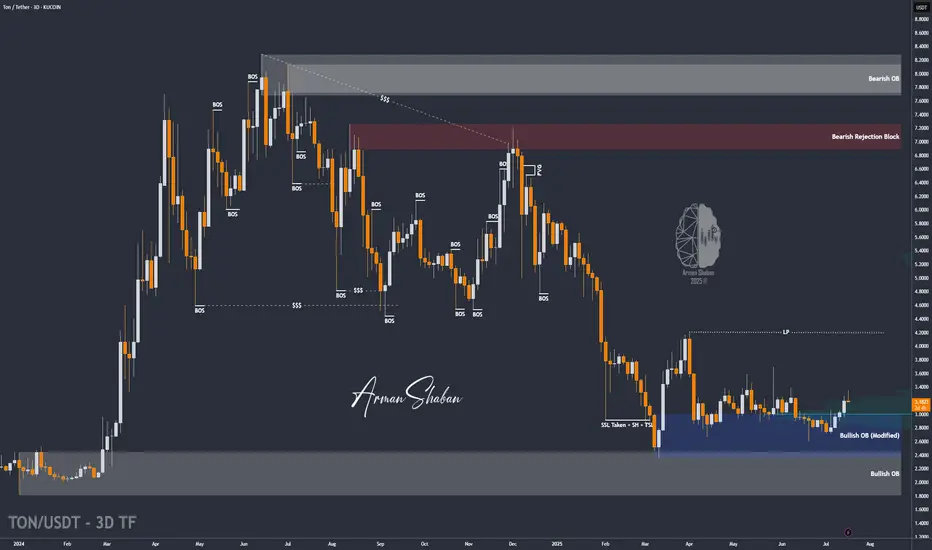
TON/USDT : Get Ready for a new Rally! (READ THE CAPTION)By analyzing the Toncoin chart on the 3-day timeframe, we can see that the price has finally managed to grow over 3% as expected, and is currently consolidating above the $3 level. We’ll have to see how far this bullish momentum can continue — but to be honest, I expected a stronger move considering the market rally and Bitcoin repeatedly hitting new ATHs. Still, no worries — once Bitcoin takes a breather, altcoins will likely begin their powerful runs! Based on previous analysis, the next targets are $3.15, $3.63, $4.20, and $4.68 respectively.
Please support me with your likes and comments to motivate me to share more analysis with you and share your opinion about the possible trend of this chart with me !
Best Regards , Arman Shaban
ETH/USDT : $3000 Reached, It's time foe $4000? (READ)By analyzing the Ethereum chart on the weekly timeframe, we can see that the price has finally broken the strong $2700 resistance and pushed toward the next target at $3000! Currently trading around $3150 and now within the $3130–$3440 zone, I expect a short-term rejection from this area. However, given the overall market trend, this level may not hold for long, and we could soon see a breakout toward the next targets at $3500, $3740, $4100, and $4470!
Please support me with your likes and comments to motivate me to share more analysis with you and share your opinion about the possible trend of this chart with me !
Best Regards , Arman Shaban
THE LATEST ANALYSIS :

Chiliz Hitz Bottom · Opportunity Buy Zone (PP: 3,535%)Chiliz is trading at a true bottom right now after producing the lowest price in more than three years. The lowest since February 2021. No need to worry though, an early recovery is already happening and we are sure the bottom is in.
The past three weeks have been green while CHZUSDT managed to close above EMA8. This means that the trend is changing or is about to change and we know it will change because we are right in front of the 2025 altcoins bull market. Chiliz will not stay behind, it will also grow. We don't know how strong but there is plenty of room for rising prices. You will be surprised by what the market does.
What the market does is to condition you in some way. First, you become conditioned to seeing higher prices, unlimited potential and that's the start of the bear market, long-term a downturn. But this isn't the end.
When you are conditioned to seeing the market go down, more down; down, down, down, forever more, then it changes suddenly, as if by surprise and prices start to grow. The growth feels strange because it is something not seen in a while and we wonder, will it last? I don't know.
That's the first answer if you don't have access to years of data and this amazing chart.
Seeing the chart long-term coupled with marketwide action and what Bitcoin does, yes, the market growth will last a long time because an uptrend means higher highs and higher lows.
Right now we are looking at the best possible entry prices, an opportunity buy-zone. Buying now can result in incredible gains in the coming months.
Thanks a lot for your continued support.
Namaste.

TON/USDT : TON at a Key Breakout Level – Will $3 Hold or Break?By analyzing the TON Coin chart on the 3-day timeframe, we can see that after climbing back to the $3 level, this zone has now turned into a key resistance area. The most important condition for further bullish movement is a strong breakout and confirmation above $3. If that scenario plays out, the next potential upside targets are $3.15, $3.63, $4.20, and $4.68.
⚠️ (A deeper and more detailed analysis is recommended for long-term investment considerations.)
Please support me with your likes and comments to motivate me to share more analysis with you and share your opinion about the possible trend of this chart with me !
Best Regards , Arman Shaban

SOL/USDT : Strong Bullish Move Ahead?By analyzing the #Solana chart on the daily timeframe, we can see that the price is currently trading around $149.62. If the price holds above the key level of $146.28, we could expect the beginning of a strong bullish wave, potentially delivering over 25% short-term returns.
If this scenario plays out, the next bullish targets are $168.50, $187, $220, and $263.
(Personal research is strongly recommended for long-term investment decisions.)
Please support me with your likes and comments to motivate me to share more analysis with you and share your opinion about the possible trend of this chart with me !
Best Regards , Arman Shaban

ETH/USDT : Gearing Up for a Major Breakout? (READ)By analyzing the Ethereum chart on the weekly timeframe, we can see that the price has started rising just as expected and is now approaching the first target. For now, ETH faces major resistance in the $2,600–$2,900 zone.
If price breaks above this key area, I expect a strong bullish move from Ethereum!
Based on the main analysis, the short-term targets are $2,700 and $2,890, while the mid-term targets are $3,100 and $4,100.
Please support me with your likes and comments to motivate me to share more analysis with you and share your opinion about the possible trend of this chart with me !
Best Regards , Arman Shaban

#CHZ Price is testing the Descending channel resistance #CHILIZ
The price is moving within a descending channel on the 1-hour frame and is expected to break and continue upward.
We have a trend to stabilize above the 100 moving average once again.
We have a downtrend on the RSI indicator that supports the upward break.
We have a support area at the lower boundary of the channel at 0.03320, acting as strong support from which the price can rebound.
We have a major support area in green that pushed the price upward at 0.03200.
Entry price: 0.03440
First target: 0.03505
Second target: 0.03600
Third target: 0.03730
To manage risk, don't forget stop loss and capital management.
When you reach the first target, save some profits and then change the stop order to an entry order.
For inquiries, please comment.
Thank you.

Gold at Key Rejection Zone: Will the Drop Resume from $3310?By examining the gold chart on the 4-hour timeframe, we can see that after some consolidation between $3294 and $3302, the price finally began a sharp drop, correcting down to $3245. This area was a key demand zone on lower timeframes, which triggered a rebound, and gold is now trading around $3310. If the price gets rejected from the $3310–$3313 zone, we can expect another potential decline.
Please support me with your likes and comments to motivate me to share more analysis with you and share your opinion about the possible trend of this chart with me !
Best Regards , Arman Shaban

XAU/USD: Gold will fall ? (READ THE CAPTION)By analyzing the gold chart on the 2-hour timeframe, we can see that on Friday, after the price rose to $3248, it once again faced a correction and eventually closed at $3326. I expect that with the market opening, we’ll see further correction from gold, and the first potential target will likely be the $3213–$3216 area.
The key demand zones are $3253–$3274 and the $3313 level.
The key supply zones are $3355–$3369 and $3395–$3408.
Please support me with your likes and comments to motivate me to share more analysis with you and share your opinion about the possible trend of this chart with me !
Best Regards , Arman Shaban

BTC/USD: The Bull Run Isn’t Over yet! (READ THE CAPTION)By analyzing the #Bitcoin chart on the weekly timeframe, we can see that price has finally started rising as expected and has hit all our targets, breaking above $100,000. Bitcoin is currently trading around $103,000, and now we must wait to see if it gets rejected from this level. If there's no rejection and price breaks and holds above $110,000, we could expect higher targets around $130,000 and even $163,000 in the coming weeks. So far, this analysis has delivered over 39% return!
The Previous Analysis :
Please support me with your likes and comments to motivate me to share more analysis with you and share your opinion about the possible trend of this chart with me !
Best Regards , Arman Shaban

BTC/USD: Do You Think Bitcoin Will Break Above $100K Again?By analyzing the #Bitcoin chart on the weekly timeframe, we can see that after our last analysis, the price successfully hit the $80,800 target and even dropped close to the second target at $73,700. Eventually, after forming a bottom around $74,400, Bitcoin saw renewed demand and has since surged to $93,600.
Take note: the $93,480 to $99,500 zone is a key supply area, and the primary expectation is for the price to face rejection from this level. However, after a possible short-term correction, I expect Bitcoin to resume its upward move toward targets above $100,000.
Please support me with your likes and comments to motivate me to share more analysis with you and share your opinion about the possible trend of this chart with me !
Best Regards , Arman Shaban
Latest Analysis :

CHZ: The Safe BetAlthough #Chiliz has been in a bearish trend since March 2021, many still bet on a strong comeback.
A complex double combo appears to be complete, with the current range holding and bullish divergence showing on several indicators.
Passing $0.14 confirms a shift in trend.

Chiliz: Your Altcoin ChoiceChiliz (CHZUSDT) can break $1 on a strong bull-market. To reach $3, we would need an extra-ordinary bullish wave and this target seems less likely, but still possible...
How are you doing my cherished reader?
I hope you are having a wonderful day.
This a great chart. Chiliz hit a new All-Time Low today and the action is turning bullish with high volume. It is possible that we are looking at a bottom catch.
There are always many ways to approach a chart; so many tools available.
Here we are looking mainly at the chart structure and long-term price dynamics.
There is a channel with the lower boundary being tested. This is a classic, when the lower boundary of a channel is tested, the next logical move is a test of the upper boundary, but this would only be the start as we are in a bull-market year. This is to say that higher prices are possible after the first strong resistance level is hit.
The decline that started in December 2024 is very steep, a strong decline. This type of action tends to reverse strongly once the low is hit. If the drop is more balanced, it can last longer and produce multiple lows. When the drop goes straight down, once the bounce happens it is over. So, if we get green and see green be ready, it means we are going up.
This is definitely a good choice. Buyers should be happy because prices as now are rarely possible to find. Once we hit bottom, there is no other place left to go but up.
Strategy: Buy and hold. Go LONG.
Thanks a lot for your continued support.
Namaste.

BTC/USD: More Fall Ahead? (READ THE CAPTION)By analyzing the Bitcoin chart on the weekly timeframe, we can see that the price is currently trading around $83,000. This week alone, BTC has dropped by 6%, showing signs of bearish momentum. A correction toward the $70,000 zone seems likely in the near future. Key supply zones are located at $93,400 and $99,700, while key demand zones are at $80,800 and $73,700. This analysis will be updated accordingly.
Please support me with your likes and comments to motivate me to share more analysis with you and share your opinion about the possible trend of this chart with me !
Best Regards , Arman Shaban

XAU/USD: First Long, Then SHORT! (PLEASE READ THE CAPTION)Gold's 2-hour chart shows that the price successfully reached a new high of $3057 today before retracing to $3025. Currently, gold is trading around $3037, and I expect a short-term push towards $3049 before looking for a trigger to potentially ride a correction down to targets below $3022. Stay tuned—this analysis will be updated soon!
Please support me with your likes and comments to motivate me to share more analysis with you and share your opinion about the possible trend of this chart with me !
Best Regards , Arman Shaban

Chiliz and FIFA mentioned at Trump Crypto Reserve SummitWow what a surprise, we saw the FIFA World Cup Trophy at the summit;
Gianni Infantino presented it.
With such a good connection to the President and lots of football clubs and players onto the Chiliz Chain i assume we can get a decent surge over the next months.
Watch the Fibonacci's numbers.
A runup to around 14 Cents will spark the craze!
