CHZHELLO GUYS THIS MY IDEA 💡ABOUT CHZ is nice to see strong volume area....
Where is lot of contract accumulated..
I thing that the Seller from this area will be defend this SHORT position..
and when the price come back to this area, strong SELLER will be push down the market again..
DOWNTREND + Support from the past + Strong volume area is my mainly reason for this short trade..
IF you like my work please like share and follow thanks
TURTLE TRADER 🐢
Chiliz

CHZ in a Cup&HandlePlease notice that the target and the resistances have been taken at daily but I'm showing you the weekly chart. You can find the daily here:
Also, I'm currently questioning my past strategies (mostly my Risk Managment but this need changing my entry strategy) so you'll see different indicators and my TA using such indicators is still to be perfect.
now my TA:
On weekly CHZ has been pumping almost non-stop since July but on the daily you can see it formed a handle after price hit the Cup neckline. C&H are commonly known as continuation patterns but actually you can find them in reversal as well like here on CHZ.
NOTE: check this article on C&H, it shows the reversal pattern example: www.elearnmarkets.com
If current breakout succeed I'm looking forward to short this around the end of the target (where I've already set an alert). It's a pity I didn't notice this earlier because it would have been a good opportunity to ride. Those who want to risk more can wait and see if at some point the breakout will dump a bit until the support and enter there.
Good luck

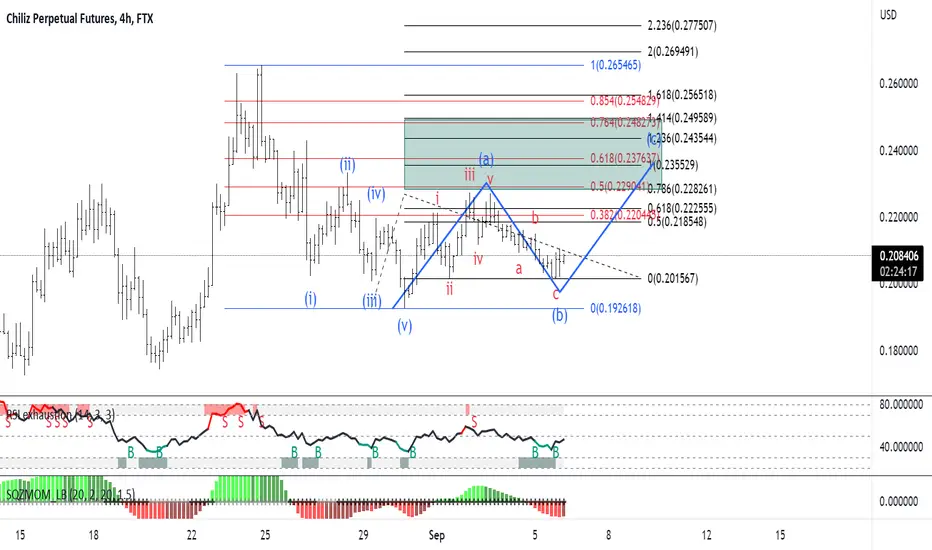
CHZ/USDT Elliott Wave count 4H TFChiliz to end its move up?
Red scenario is a flat patern with A beeing a complex correction B beeing an extended flat that will end soon into the top red resistance and C must be an impulse to the downside after it Chiliz may continue his move to the upside.
Blue scenario to be a 4th wave triangle and now we are into the 5th wave and than massive drop down abc for wave 2.

Chiliz - Hot 🚨🚨🚨♨️🌶 perfect breakout confirmationHot 🚨🚨🚨♨️🌶
Chiliz with a perfect breakout confirmation dear Crypto Nation 😎
CHZ overbought on 4h chart - but that looks quite healthy !
Comment & FOLLOW appreciated
*not financial advice
do your own research before investing

chilizhey guys i hope you are well.
this are my stimations for next chiliz movement.
bsed on ellito waves

Potential Cup and handle formingIf it breaks where the fib retrace is at 0.236 then up we go, get rejected, down we go, wait for confirmation

Chiliz - $3.55 a realistic long-term target ❓Chiliz - $3.55 a realistic long-term target ❓
Quite impressive high similarity over 10 weeks 🔵
Further similarity over the next weeks 🔴❓
Projection target matches with log FIB 127.2%
What are your thoughts on that dear Crypto Nation?
Comment & FOLLOW appreciated
*not financial advice
do your own research before investing

$CHZ - Another Bullish Breakout !!Hello my Fellow TraderZ,
Unaffected by the present market scenarios, $CHZ is one of the few coins which are in their own Bullish Universe.
Here you can see $CHZ is forming a BULLISH PENANT and as of now breaking Upward.
I'm still not convinced with the breakout and waiting to retest the broken Trendline and rejection there with some Bullish Price Action accompanied by some decent VOLUME.
Here is my LONG setup as you can see my SL is very precise and just below 200 EMA with R:R=1:5. If you wish to take the trade you can adjust your SL according to your own Risk Management.
Note : Today will be sharing an #educational post about some pattern trading. Hope you like it.
Happy Trading. CHEERS!!!

#BTC 12H TF : 09.16.22 (Update)As you can see, the price is in the range of $19,700 at the moment, please note that this scenario is only valid as long as the price is above $19,500, otherwise the price can see lower targets as well, one of the important support zones is the Bullish OB in the range of $18,500 to $18,900 !
Follow me for more analysis & Feel free to ask any questions you have, I'm here to help.
⚠️ This Analysis will be updated ...
👤 Arman Shaban : @ArmanShabanTrading
📅 09.16.2022
⚠️(DYOR)
❤️ If you apperciate my work , Please like and comment , It Keeps me motivated to do better ❤️

$BTC : +21% So Far ✅ Cheers 🥂According to yesterday's analysis, with a price consolidation above $ 22400, the price has been able to reach $ 22700 at this time , and at this level, the price is very close to the Target that we wanted , be sure to consider the price reaction to the appealing levels that shown on the chart ! The next important range of supply zone according to yesterday's analysis is $ 23100 to $ 23630! There was a Hint Point on the yesterday's chart , I hope you got it! 😉
Follow us for more analysis & Feel free to ask any questions you have, we are here to help.
⚠️ This Analysis will be updated ...
👤 Arman Shaban : @ArmanShabanTrading
📅 09.13.2022
⚠️(DYOR)
❤️ If you apperciate my work , Please like and comment , It Keeps me motivated to do better ❤️


Hot Chiliz with a wedge breakout... 🚨🌶🚨Hot Chiliz with a wedge breakout... 🚨🌶🚨
Can chz keep the volume support at $0.21 dear Crypto Nation ⁉️
Comment & FOLLOW appreciated
*not financial advice
do your own research before investing

ETHUSDT : Another BullRun ? Let's See Do you remember this analysis of #ETH ? See how he reacted when it reached Bearish OB , 30% drop from exactly the same range! Now let's go to update the Ethereum analysis in the next post!
Follow us for more analysis & Feel free to ask any questions you have, we are here to help.
⚠️ This Analysis will be updated ...
👤 Arman Shaban : @ArmanShabanTrading
📅 09.08.2022
⚠️(DYOR)
❤️ If you apperciate my work , Please like and comment , It Keeps me motivated to do better ❤️

Chiliz shortChiliz broke trough the ascending trendline. Asset broke trough the support level. Bearish movement to support level at 0.142 is possible.

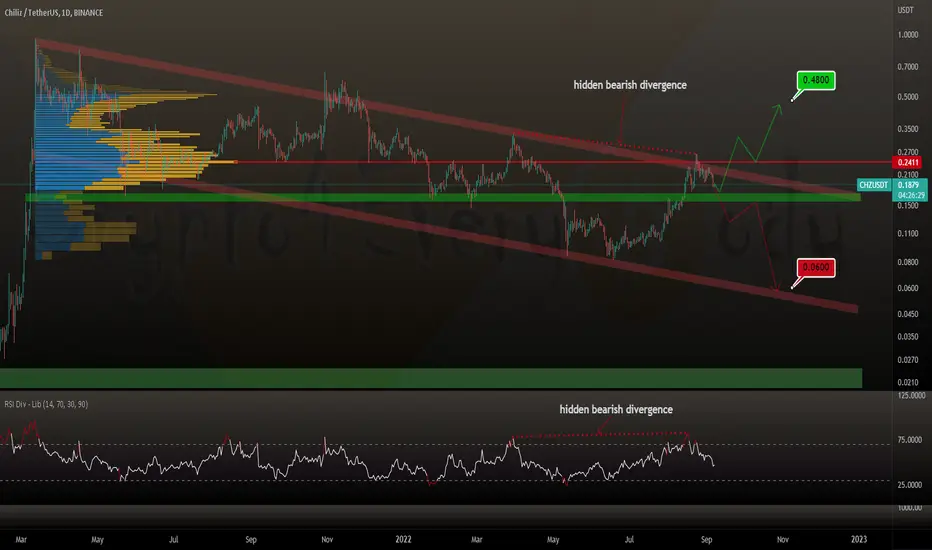
Chiliz CHZ below $0.24 in the huge flag - what next?Chiliz CHZ below $0.24 in the huge flag - what next?
If price gets above this volume profile resistance next target would be $0.48
Maybe more likely a move to the lower flag border at $0.06 - a hidden bearish divergence is concerning
Overall a huge flag with bullish chart outlook on long-term
Comments & FOLLOW appreciated 🤗
*not financial advice
do your own research before investing
CHZ/USDT Elliott Wave count 4H TFChiliz into an ABC correction after a leading diagonal impulse to the downside.
I entered long here with targets into the box. I will update TP after I see more price action, but I am expecting to hit 0.5 or 0.618 fib retracement of the impulse.
If you like my analysis subscribe for future updates and give me a like. Good luck and thank you!
Chiliz with a EMA 75 ❌ EMA175 crossChiliz with a EMA 75 ❌ EMA175 cross
Will we see a correction only or the next heavy bull phase 🟢🌶️🟢 dear Crypto Nation ⁉️
Let me know your thoughts on CHZ
Comments & FOLLOW appreciated 🤗
*not financial advice
do your own research before investing

$BTC Important Analysis (READ THE CAPTION) The market is still accumulating and we have to wait for the realization of the desired scenarios! The first scenario will be realized if the price consolidates below $19,500, and the movement towards $18,400 to $18,900 will be its important target (after that, we can look for a trigger for a BUY position in this range! The second scenario also happens if the price consolidates above 20,600 $ will be realized and its initial target will be $21,100 and then $21,900!
Follow us for more analysis & Feel free to ask any questions you have, we are here to help.
⚠️ This Analysis will be updated ...
👤 Arman Shaban : @ArmanShabanTrading
📅 09.05.2022
⚠️(DYOR)
❤️ If you apperciate my work , Please like and comment , It Keeps me motivated to do better ❤️

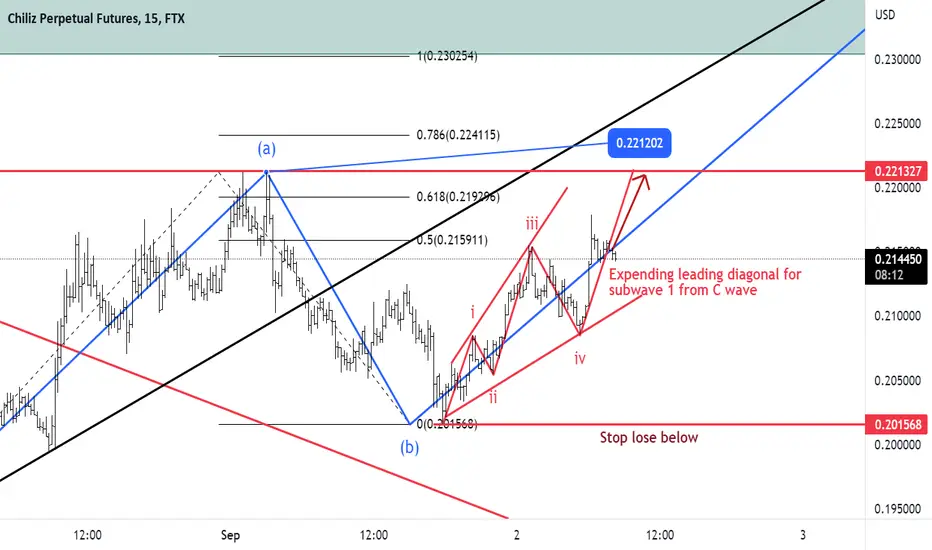
CHZ/USDT Elliott Wave count 15min TFChiliz is into an leading diagonal that I think will end into the top of subwave A fom B wave of the bigger flat pattern soomewhere at 0.22120.
This leading diagonal probably is wave 1 form C wave.
Take a look also to the related idea that I publihed yesterday.
I will keep updateing this count. I am long on CHZ so if you like my analysys give me a like and subscribe for future updates. Thank you and good luck!
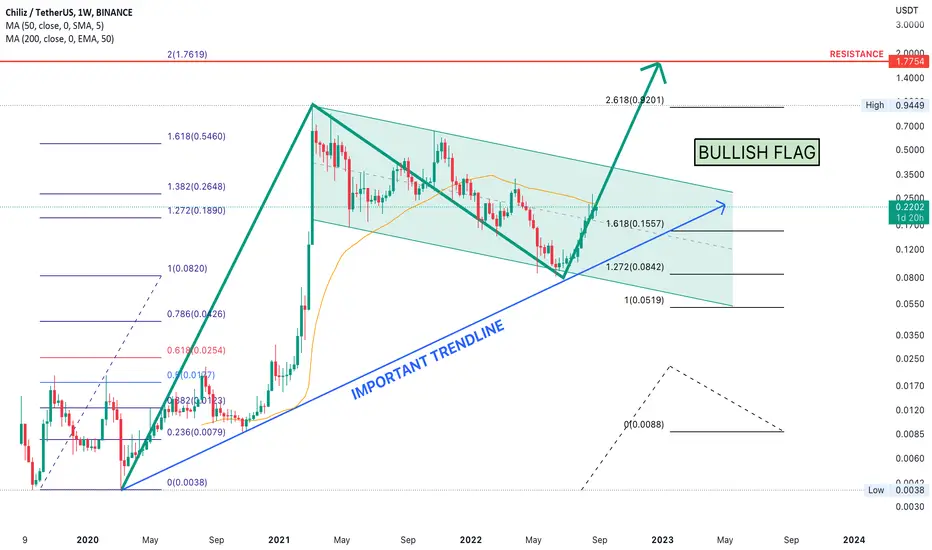
Golden Cross and Bullish Flag, $1.7 On weekly chart,
BINANCE:CHZUSDT has some signals for next bullish to 1.7
#1 - Completed the correction wave at 0.81
#2 - Bullish Flag touched lower channel and bounce back.
#3 - Touched and bounced from Important Trend Line
I figure out target of 5th wave at 1.7 with golden ratio 2.0 Fib from 0.81 which is the 4th wave.
Let's wait and see.
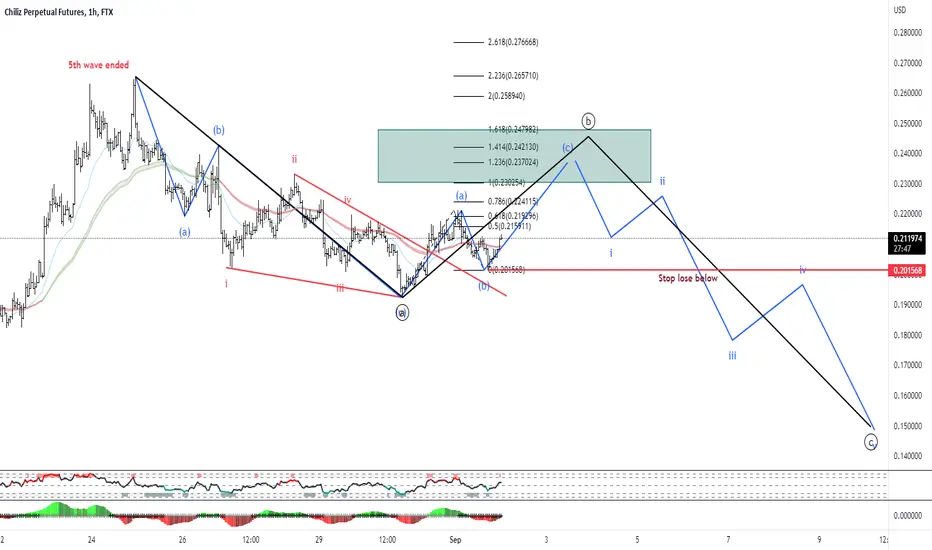
CHZ/USDT Elliott Wave count 1H TFChliliz ended a 5th waves move to upside and now I think it Will go into a correction phase ABC flat pattern. It will be extended we will gonna see.
I entered long on CHZ with targets into the box for an other ABC correction that will be the eave B from flat correction. Good luck!
$CHZUSDT Chiliz overextended?Chiliz $CHZUSDT has had an awesome three digit percentage run up in the past few months and is in profit for anyone who bought in from May'22 onwards. The same cannot be said for most Cryptos in the same time period.
For nimble Crypto traders, analysing projects that have shown such incredible strength relative to the broader market is incredibly valuable as it highlights the constant opportunities to be found in Crypto trading, despite mainstream/retail narratives to the contrary.
We can see that Chiliz had a sharp divergence from Bitcoin (blue line), which it was previously tightly correlated with, starting 27 July '22.
Since May, as the major indexes (especially SPY) and inflation/FED hawkishness doom and gloom has spread to risk-on assets, pulling Bitcoin back into critical $20k USD levels, Chiliz instead continued an incredible run up, putting on a staggering +150% from the 27 July '22 trough to the peak 31 Aug '22. If you timed a long properly here, you made bank.
As we can see, the action even defied the VIX doom candles on 1 Aug and 22, 23 Aug. Chiliz has been partying! Go Chiliz! Lately it has been respecting the VIX's violent swings. Market conditions are currently volatile. We may see it come back into line with Bitcoin's ups and downs, and if this is the case, then the probability of support being tested increases.
Considering the larger market forces in play, there is elevated risk with overextended Cryptos, so be cautious about going long at these levels. Personally I would spread buy orders down at levels of support.
Obviously the best time to go long was at the beginning of the divergence back in May, as it smashed through overhead resistance as whales poured in, and we saw over 150% of gains in just a few months.
Could we head higher? Sure, but as we head into September with weak market conditions I think more probable is a retest of 0.16 (weak support) or 0.13-0.15 levels (stronger support).
Reducing this to the simplest broader market risk consideration: if Bitcoin stays beneath heavy resistance in September, in line with the major indexes, its gravitational pull will become stronger and stronger on Chiliz.
Zooming out for big picture/long term HODLERS, Chiliz fundamentals smell like success to me - a confluence of industry strength. Sports are on fire, they are focused on the spicy South American market, where crypto adoption is ahead of the curve, especially social apps and finally, aggressive collaboration with top brands like UFC, NFL, top Soccer teams, etcetera. Chiliz offers a blockchain interface between fans and their favourite teams, which creates a use-case for the $CHZ token through socios.com. It's a perfectly good business model, a persistent niche due to sporting teams not having found effective ways to have immersive apps/digital experiences. Digital collectibles in conjunction with the blockchain can offer a better experience (if executed properly) - i.e. it's still confusing for "boomers", but all it takes for grass roots growth is someone showing them on a smartphone "how it works", hence CHZ may be a long term stayer if its socios.com product becomes a major player with fans and apps for their favourite sporting teams and digital collectibles.
