Chiliz FINANCIAL FREEDOM [BULL PENNANT]Spotted this potential bull pennant forming on the weekly chart.
Timing is everything and timing a market is extremely difficult, however based on the pattern I believe it could breakout sometime in Q4 of 2020.
-> 1.618 extension lines up with measured move (at approximated breakout point)
-> Lots of buy volume at pennant support line so far
-> Patterns like this tend to play out 50-75% of the way through before breaking out (to either direction)
Beware that it could sell off before it hits the top of the pennant this time.
Trade at your own risk.
Chiliz

Waiting for Chiliz's price to rise over the next 30 daysAs you can see in the picture, there is a high probability that the price will be up to 0.013149, and then the price may decrease to 0.011786, or it may collide with the supercomo, and then move up the ladder to the target of 0.015232.
Signal by Yazdani

Chiliz CHZ USDT medium term workI detected 3 trend lines. The first trendline comes from the past and it don't try it for a long time. If it does not break the resistance of 0.010014 I have an expectation to down. then we go to the level of 0.011362.
The second trend line has been tried 4 times since 11 May. I don't think it will try again if btc gets rid of the effect. then we go to the level of 0.011362 faster.
The third trendline I really want. it has tried this line many times recently, but it could not break it. It seems to break recent movements. If it breaks and can stay above the third trend line, my goal is 0.013641.
Ps: In this work, Barcelona and Chiliz agreement should not be ignored.
www.chiliz.com
It is a personal amateur work. It is not investment advice. Good luck to everyone.
#CHZ/BTC (June 01)CHZ is quite strong and we can take risk with it for target 160sts and stoploss if it lose its support at 105sts

CHZ/BTC is ready!CHZBTC attempting to break out of the triangle. If it succeeds next stop is 168 sats.
- This is a top buy and i suggest you don't miss the train!

106sats üzeri kapanış gerekli #chzbtcSıkışan üçgen ve beklenen ortaklık anlaşmaları hedefe kolayca ulaştırabilir. #chz #chzbtc

LONG - CHZ -Trading OpportunityBINANCE:CHZBTC seems to be on an ascending triangle formation on the hourly chart, while at the same time a falling wedge has been formed on the RSI, which looks like it will break up any moment.
Entry: 0.00000115
Target 1: 0.00000138
SL: 0.00000110
CryptoCue is not providing investment advice and is not taking subscribers’ personal circumstances into consideration when discussing investments. Investment involves a high degree of risk and should be considered only by persons who can afford to sustain a loss of their entire position.
CryptoCue is not registered, licensed or authorized to provide investment advice and is simply providing an opinion, which is given without any liability or reliance whatsoever. The information contained here is not an offer or solicitation or recommendation or advice to buy, hold, or sell any security. CryptoCue makes no representation as to the completeness, accuracy or timeliness of the material provided and all information and opinions provided by CryptoCue are subject to change without notice and provided on a non-reliance basis and without acceptance of any liability or responsibility whatsoever or howsoever arising. You hereby irrevocably and unconditionally waive, release and discharge: (a) any and all accrued rights and/or benefits you may have against CryptoCue in respect of any opinion expressed or information conveyed by CryptoCue at any time; (b) any and all Claims you may have against CryptoCue arising out of any opinion expressed or information conveyed by CryptoCue at any time; (c) CryptoCue from all and any claims (whether actual or contingent and whether as an employee, office holder or in any other capacity whatsoever) including, without limitation, Claims you may have against CryptoCue arising out of any opinion expressed or information conveyed by CryptoCue at any time. ("Claims" shall include any action, proceeding, claim, demand, judgment or judgment sum of whatsoever nature or howsoever arising.) You hereby agree to indemnify and hold harmless CryptoCue in respect of any and all Losses paid, discharged, sustained or incurred by CryptoCue in the event of bringing any Claim against CryptoCue. (“Losses” shall include any and all liabilities, costs, expenses, damages, fines, impositions or losses (including but not limited to any direct, indirect or consequential losses, loss of profit, loss of earnings , loss of reputation and all interest, penalties and legal costs (calculated on a full indemnity basis) and all other reasonable professional costs and expenses and any associated value-added tax) of whatsoever nature and/or judgment sums (including interest thereon).


CHZ (Y20.P3.E1).Potential opportunity HI,
As the chart demonstrates, its broken two main resistance lines and now testing the flat resistance as support.
I would keep my eye out on this one.
What to look for >
Watch the candle sticks at different time frames for potentially a breakout move, just like last time.
I'm using 12 Hrly
Look for bullish divergences at the same time frames, a bonus.
A note on bitcoin, while bitcoin goes sideways, many alts start to show opportunities.
Please give me a like or tick for this post, got to rack those numbers and followers up :)
Cheers,
S.Sari
My Ref: A.charts

$CHZ closer and closer to BOOM targetJust a few days and I am expecting CHZ to take action.
I have 2 personal sell targets
0.013
0.018
Have fun !

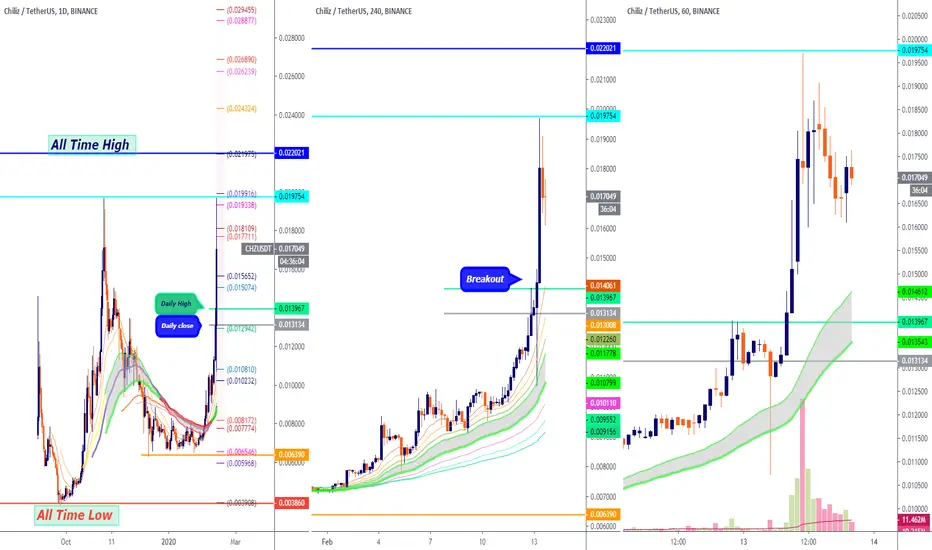
Chiliz vs TetherUS Chart MappedHere we have the Chiliz vs TetherUSD (CHZUSDT) chart fully mapped on the daily timeframe.
Here we have the support and resistance levels mapped.
I also marked my current view of the chart which is bullish.
The All-Time Low support level has been activated.
The last time this level was hit what followed was a 400%+ bullish wave.
We can see a similar scenario take place this time around.
This is not financial advice.
Namaste.

CHZ possible scenario in the next weeks$CHZ with a almost 200% possible chance to run up
Watch and see !

CHZ/BTC 12H (Binance) On TL support & inside falling wedgeChiliz is almost back on the same trend-line it bounced from 2 months ago.
I'm expecting to catch it when it goes there, then to breakout that small wedge and rise for short/mid-term.
In higher time-frame we can see a huge pennant and if price action manages to close above middle line it will look very good for long-term.
Buy Entry= 0.00000093 - 0.00000089
Take Profit= 0.00000103 | 0.00000111 | 0.00000124
Stop Loss= 0.00000079
Risk/Reward= 1:1 | 1:1.67 | 1:2.75
Expected Profit= 13.19% | 21.98% | 36.26%
Possible Loss= -13.19%
Fib. Retracement= 0.236 | 0.382 | 0.618

CHZ/BTC preparing for another green DILDOCHZ / BTC
Chiliz's prediction from January 22, 2020 came out excellent and fulfilled all targets from the bull BAT pattern, reflecting the larger uptrendovky from the bottom of the structure determination. Again it fell to me to do well and end up with the last cases.
- Consolidates again on the same initial trend.
-Fulfilling harmonic pattern
-And no amount at all ??? (preparation for movement?)
After the impulse pump, the Chilli Gartley pattern, which has no ideal and I have to overlook the opening knot, has finished perfectly, no other calculations fit perfectly and is not an attempt at a shorter business. The situation with BTC and its dominance is currently unsatisfactory for shitcoins, so these primarily attempt to close deals in narrower TPs in a short time without setting this to a few weeks.
In PRZ between 89-92sat I calculate 0.88XA, precise AB = CD and 1,618BC projection.
StopLoss in this case tightened (87-89sat), conservative below point X (75sat).
Take Profit Zones from the graft pattern.
Chart 12h:
Graph 4h:

Prediction Price CHiliz $CHZ Binance amsadad.comMidterm Position
Buy area - 138 - 140
Sell area 148 - 156 - 170

🔥 Binance :Top Gainers Today / Chiliz +39%CHZ/USDT +39% Today
Disclaimer:
We are not registered or licensed in any jurisdiction whatsoever to provide investing advice or anything of an advisory or consultancy nature,
and are therefore are unqualified to give investment recommendations.
Always do your own research and consult with a licensed investment professional before investing.
This communication is never to be used as the basis of making investment decisions, and it is for entertainment purposes only.
Chiliz Bulls Are Now Up! What Happens Next?We looked at CHZBTC (Chiliz) back in early January... Here is the chart:
It moved just as charted, but, what happens next?
Right now we are looking at really strong bullish action, the strongest this altcoin pair has seen.
CHZBTC is also displaying the highest volume as well as extremely bullish indicators. The MACD allows for additional growth.
The RSI is now really strong... Chiliz will continue to grow.
Namaste.

Chiliz Hits Support | Will It Bounce? | Chart SignalsChiliz (CHZBTC) almost hit the .786 Fib. retracement support and started to bounce... Let's take a quick look at the signals:
Prices for CHZBTC bounced just above .786 Fib. For bullish cycles, .618 Fib. can be enough to complete a retrace so reaching lower and bouncing with strength can be a bullish signal.
Volume is showing up.
Break above EMA10.
EMA100 being challenged.
Bullish RSI.
Bullish divergence on the MACD + bullish cross.
Downtrend line broken.
There you have it... You can find the important support and resistance levels marked on the chart.
My view
I believe Chiliz can produce some good growth here... There is still the possibility of another low before fully resuming the uptrend, but a bullish move is still due now.
Thanks a lot for reading.
Namaste.
---
Previous analysis |

CHZBTCLooking at CHZ on the daily
Willy stupid and making a W
Histogram ticking up but it has made a LL
OBV not to crash hot
Very little volume (Who is driving the bus?)
Price trading at the POC
Price also trading on the .618
I want to see more structure in price to tell me if we are bullish off the 618, then ill look for a trade entry
* Don't forget to hit that like button and follow me on Trading View and Twitter for more chart analysis :)

CHZ / BTC Falling Wedge. Pivot zones for work.After the pump, a downward wedge formed, the price almost reached the zone of potential reversal, or at least accumulation.
TARGET.
In the trading idea, I showed only a potential first move to take profits. A coin can go up much more in short-term movement. They can pump up hundreds of percent, but only for a short time! All this is done thanks to the satoshny price, 3 exchanges where it is traded and relatively small capitalization.
When trading such coins, always remember - greed begets poverty!
The coin was created only for speculation, it must be understood, the satoshny price is also not random.
Coin only for trading is not for holding!
The legend of the project.
And again scam Binance exchange which "does not post" fraudulent projects on its site. The legend of this project, Chiliz, creator of Socios.com, aims to give sports fans and cyber sports the opportunity to manage their favorite teams, games, leagues and events.
ENTRANCE.
Entrance only when a downtrend line breaks (downtrend resistance line, red line)!
You also need to understand that after breaking through the descending wedge line, an accumulation channel of 40-50% can be made.
Stop loss
Under key support levels during your entry into the market.
Do not forget to move Stop Loss during the price increase, but take into account the volatility of the coin.

CHZ / BTC | +40% Profits WaitingI like how CHZBTC looking at the moment, it have good chances for making big profits this month. Targets on the levels from chart. Reasons for trade: Breakout from Wedge and Elliott Waves structure.

CHZ/BTC 1D (Binance) On trendline and wedge supportChiliz is giving us a new chance of trend change after this big retracement.
Entry= 0.00000082 - 0.00000086
Take Profit= 0.00000099 - 0.00000114 - 0.0000129
Stop Loss= 0.00000069 or below
Risk/Reward ratio= 1:1 - 1:2 - 1:3

CHZ/BTC Technical Analysis Bullish ModeCHZ/BTC Technical overviews:
CHZ/BTC now current Price is 86 Satoshi.
And Technically looking very good.
in daily Time frame MACD bullish crossover is very near.
And Bull Flag is Very Strong.
If breakout Confirm then we can expect 50%-70% Profit.
Fresh Setup: 84-86 Satoshi
Target : 98 / 129 /167 Satoshi
Stop Loss: bellow 82 Satoshi.
Support: 70 Satoshi is very good Support.
If our Stop loss hit then Also placed Buy bid around 70 Satoshi.
Please like and share guys if you happy with our Analysis.
Thank you
