Upside for Gold as rate expectation cooled by recession riskSummary
The surge in energy and agricultural commodities in the past 6 months had materialized into serious inflation even down to the consumer end across the globe. To cope with inflation, the Fed has begun to raise rate at an accelerating pace. The rise in the interest rate of the USD causes dysfunction of traditional risk haven such as Japanese Yen FX:USDJPY and Gold COMEX:GC1! . However, with more evidence that the US is very close to a recession, the Fed might need to tune down to a more cautious approach to balance between taming inflation and speeding up recession due to higher borrowing cost (and debt repayment) for business. The stabilization in rate hike might soften the already strong dollar, hence providing room for traditional risk haven assets to rebound and restore some of their risk haven property . With still ongoing global political uncertainty (see appendix for more detail), there might be further upside potential beyond rebound. One should pay extra attention to the collective transition of power globally which is happening at a similar time coincidentally.
Technical and trade planning
Just like most commodities, the dominant force driving gold downward is the strength of the USD. The US Dollar Index TVC:DXY had reached a new high at 107.786, before retracing back to 106.895 to close lower last Friday, creating a reverse hammer candle. While the uptrend of the dollar index is still effective, however the bearish pattern hinted the peak might have reached (or at least the upside momentum is reducing) . Similar pattern in reverse was seen in many commodities including gold, which means opportunity for rebound trade.
Note that gold currently is trading below most moving averages which means the downtrend is still in power. 20 days moving average trading below the 50 days, and both pointing downward double confirm the bearish view. In rebound trade it is very important to keep your cut loss and profit taking tight. One should also adopt strategies that allow more tolerance for error (e.g. longing call option with >30-60 days to expiration).
Here are some technical levels trader of gold should be aware of:
Downside support (to cut loss if dropped through)
1676.7: 2021-Aug hammer candle bottom
1721.8: 2021-Sep downside retest bottom
Upside resistance (to take profit if fail to go further)
1785: May-16 bottom (broke on Jul-5)
1833: 250 days moving average
1878.6: Jul-3 rebound peak
Appendix: Political events to keep an eye on
Asia
The former prime minister of Japan, Shinzo Abe was assassinated last Friday. Abe was seen as the de facto power of Japan. He initiated and was involved in lots of Japan economic policy and China-Japan relation issues. Close ties with global leaders, he was one of the early promoters of threat emerging from growing China, which later led to global boycott of China. He also showed his support to Taiwan as he saw the country as the first line of defense of Japan from China. One of his unaccomplished goals was to revise the country’s pacifist constitution to formalize the Japanese self-defense force as army, and broaden its military agenda outside of homeland defense, to be involved in regional security issues, such as Taiwan. The death of Shinzo Abe might help the constitutional revision to gain more supportive votes, which will worsen China-Japan existing tension.
The 20th National Congress of the Chinese Communist Party will take place in November this year. One of the major topics is whether the current Chinese leader Xi Jinping will be re-elected for the next 5-years term. With lots of policy missteps that have caused material harm to the Chinese economy and financial stability, there are growing voices within the party that they might want a leader who can focus on reviving the Chinese economy instead of political ideals. At the same time, Xi is neutralizing the opposition force by revealing their evidence of misconduct and corruption (same strategy 10 years ago). The upcoming continuation or transition of power in China is going to be a very tricky one.
Europe
No end in sight for Russian invasion toward Ukraine, albeit increasing military support by the western powers. Inflation continues to make record highs in Europe with latest June CPI figures standing at 8.6%, energy talk with Russia is going to be very difficult especially for natural gas which is virtually impossible to get supply from other continents.
The prime minister of the UK, Boris Johnson had resigned last week amid back-to-back scandals , with the Chris Pincher case became the last straw that broke the camel's back.
The United States
Recession risk, high gasoline price, baby formula shortage, the series of unfortunate events had taken a toll on the president Joe Biden approval rate, which dropped to just 30% in the new national poll. The negative sentiment toward democrats is likely to make the republicans take control of both the senate and the house. The democrats probably can take advantage of the recent Supreme Court’s decision of overturning Roe v. Wade, however the edge might not be enough to change much according to the latest forecast.
China

AUD/JPY With U.S.-China tensions continuing I believe we are at a key level on AUD/JPY. I am still very much bearish on this pair with projections around the 91.000 levels. If we break this important HL point we could see a change in direction however I doubt it from a fundamental and technical sentiment. We will wait for confirmations and adjust to whatever the market shows us.

Speculating on CNY .. from a "distance"Looking at the CNY and its highest probable and most immediate index levels that we can theorize and speculate (using fundamentals and reason) the currency reaching in the seemingly distant future.
This is one, if not the most fascinating markets and charted data I have ever studied.
As the most powerful and fastest growing economy on earth, market performance in China will play increasingly more influential roles in the global marketplace and its participants. As the post-world war II global economy continues its evolution in the early 21st century, I will certainly be keeping my eye on the Juan.
On this publishing I am showing the theoretical levels on what would be a full retracement to the .618 of the already completed impulse down from the CNY's all-time high of 8.74. In order for this fibonacci retracement to be properly placed at these levels, the CNY would need to continue the monthly bullish uptrend to the golden pocket zone of around 7.7, where it would then need to break the trend or significantly consolidate.
Its not my most traditional, or most immediately useful piece of work, but, hopefully this is interesting to you like it is to me.
Happy trading, and good luck!

So, I looked at the CNY (Chinese Yuan or Juan) more, and..Check out my most recent publishing(s) referring to this particular exchange rate in the "Related Ideas" section below if your interested in the USDCNY.
I took a closer look at my in-depth analysis over the weekend and felt as though it needed some adjustments (additions*) + further complication..
but its for the better.. hear me out.
Ive been spending the last month or so, and will be spending as much time as necessary to catch up and become more and more familiar with what's appearing to become an even more disastrous real estate market than what we know to be the worst recorded event (in relativity) in capitalism history. ("the 2008 financial crisis")
This event could be worse, simply due to the fact that China is so powerful.. (which is good for us; the money managers!)
As a trader, its important to consider the recent upturn regarding political and socioeconomic gossip. IYKYK
There is plenty of public and freely available information on how to approach any market using fundamental risk management.
Save this, be patient, and ask questions.
Happy trading, and good luck!

is time for the balance of the forces yin yangi have been tracking this activity and now switching to $YINN, something good is coming guys.

ALGOHello everyone .
how are you doing?
ALGO could pump and I still believe that its possible that we see a huge volatile situation. What do you think about it? I will be thankful if you share your ideas.
Have a profitable day ;)

Asia market not looking hot, could see the biggest bear marketMonthly chart all pointing lower.... China is def in a recession, bear paradise for the long term

at least 30% with this ETFChina stuff is cheap today with all the rumors, but the true is that alibaba is the king of the ecommerce, so you will se a nice rebound in this ETF

Aussie shrugs after inflation reportThe Australian dollar has edged higher on Wednesday. AUD/USD is trading at 0.6950 in European trade.
Australia's inflation rate accelerated in the second quarter, but the market reaction was muted, as the 6.1% gain was a notch below the estimate of 6.2%. Inflation still remains the RBA's number one problem, as CPI jumped from 5.1% in Q1. With inflation coming in a bit less than forecast, RBA hiking expectations have been pared lower, which briefly sent the Australian dollar lower.
The key question of "how much, how fast" the RBA will increase rates depends not just on how high inflation is running, but on the resilience of the economy to withstand ever higher rates. The labour market remains robust, with the unemployment rate falling to 3.5% in June, down from 3.8% in May. The trade surplus jumped in May and the manufacturing sector continues to show strong expansion. At the same time, the global growth outlook is uncertain and fears of a slowdown in China are weighing on risk sentiment which could prove to be a major headwind for the Australian dollar.
The minutes of the RBA July meeting stated that policymakers discussed the neutral rate (which is neither expansionary nor contractionary) and the 1.35% cash rate was "well below" that. Governor Lowe has often quoted 2.5% as around neutral, leaving little doubt that the RBA plans more hikes in the second half of the year.
All eyes are on the Federal Reserve meeting later today. The markets are expecting a 75bp move, but there is an outside chance of a massive 100bp, as the Fed continues its epic battle with inflation, which accelerated to 9.1% in June, up from 8.6% in May. If, as expected, the Fed delivers a second-straight 75bp move, it will be interesting to see if the US dollar gains any ground or will the reaction be muted. This will depend on what Fed Chair Powell has to say and the tone of his remarks.
There is resistance at 0.7005 and 0.7085
0.6897 is providing support, followed by 0.6817

Jamie Gun2Head Trade - Selling China50 Trade Idea: Selling China50
Reasoning: Reaction from major support level . Interim support at 1713 in front of FED meeting later today.
Entry Level: 13943
Take Profit Level: 13630
Stop Loss: 14078
Risk/Reward: 2.32:1
Disclaimer – Signal Centre. Please be reminded – you alone are responsible for your trading – both gains and losses. There is a very high degree of risk involved in trading. The technical analysis , like all indicators, strategies, columns, articles and other features accessible on/though this site is for informational purposes only and should not be construed as investment advice by you. Your use of the technical analysis , as would also your use of all mentioned indicators, strategies, columns, articles and all other features, is entirely at your own risk and it is your sole responsibility to evaluate the accuracy, completeness and usefulness (including suitability) of the information. You should assess the risk of any trade with your financial adviser and make your own independent decision(s) regarding any tradable products which may be the subject matter of the technical analysis or any of the said indicators, strategies, columns, articles and all other features.

$SPY the outlook 👁🗨*This is not financial advice, so trade at your own risks*
*My team digs deep and finds stocks that are expected to perform well based off multiple confluences*
*Experienced traders understand the uphill battle in timing the market, so instead my team focuses mainly on risk management
Recap: Bitcoin along with the US market should take a decent hit sometime this week due to the continuation of strength in the US dollar. Bear-Index's, the dollar, and energy appear to be where the money will be flowing during this period if this does play out. This would lead to a temporary slowdown in the growing Chinese economy and allow it to retest support.
What's neat about this chart is that everything besides the arrow and the text was done months ago. It's really neat whenever our previous works help us determine the possible trajectory of the market.
!! This chart analysis is for reference purposes only !!
If you want to see more, please like and follow us @SimplyShowMeTheMoney

$TECS market hedge 👁🗨*This is not financial advice, so trade at your own risks*
*My team digs deep and finds stocks that are expected to perform well based off multiple confluences*
*Experienced traders understand the uphill battle in timing the market, so instead my team focuses mainly on risk management
My team will be using $TECS to secure gains from the possible upcoming market downturn.
Our portfolio as of 7/11/22: $TECS $CRK $MIRM
OUR ENTRY: $45.50
TAKE PROFIT: $60
STOP LOSS: $43.50
If you want to see more, please like and follow us @SimplyShowMeTheMoney

chineses reopening MacauWell. if you are following the news, China is reopening, the demand of microchips has been like in 2018 and more, Macau is reopening and Alibaba is selling like crazy. Technically you can find a huge symmetrical triangle like in bitcoin and other stocks, that could take it at least 40% from here.

Chinese stocks have incredible surprise for youChina is number one, huh? Are you really afraid of communistic party going mad and destroying everything they've earned with hard work last 20 years?
They already spread covid and use their russian doll to harm West and that will be enough for them to continue going forward and building more trading routes in South America, Africa and Asia. China is here to stay no matter you like it or not, but they are working hard and providing value.
Long your longs before FED change it's policy in September-November and revaluate food and energy weight in CPI indexes or else...
Also most covid noob plebs already out of stonks and crypto and done with investing, rooting in a crisis.
Would you buy the blood and fear here or sell with normies is the question?!
Dollar value is still going down since the day it was born no matter what.

$BTCM great risk to reward ratio 👁🗨*This is not financial advice, so trade at your own risks*
*My team digs deep and finds stocks that are expected to perform well based off multiple confluences*
*Experienced traders understand the uphill battle in timing the market, so instead my team focuses mainly on risk management
Recap: My team took profit and ran away with a 34% gain from $BTCM just a few weeks ago. Price has dropped significantly since then and looks ready to pop.
My team entered Bitcoin Mining Company $BTCM today at $.67 cent per share. Our first take profit is $1. We also have a stop loss set at $.615.
This company is a standout from other Bitcoin mining companies. It doesn't exactly trade the same as the others due to China relations, but with investors now eyeing investments overseas this could become a goldmine soon.
OUR ENTRY: $.67
FIRST TAKE PROFIT: $1
STOP LOSS: $.615
If you want to see more, please like and follow us @SimplyShowMeTheMoney

Aussie edges up after strong US retail salesThe week wrapped up on a high note, as June US retail sales beat expectations. The headline and core readings both accelerated in June, with solid gains of 1.0%. This indicates that US consumers are still spending despite the toll that higher inflation and higher rates are taking on disposable income. The strong retail sales report will raise expectations that the Fed will be content to raise rates "only" by 0.75%, rather than a full 1.00% at the next meeting. When the markets have a chance to digest the numbers on Monday, risk appetite will likely rise, which could push the US dollar lower.
China's economy slowed down in the second quarter, which is no real surprise given the Covid-zero policy which resulted in mass lockdowns. The economy posted a small gain of 0.4% YoY, missing the estimate of 1.0% (4.8% prior). On an annualized basis, GDP contracted by 2.6%, worse than the forecast of -1.5% (+1.4% prior). These weak numbers were offset by a strong bounce in retail sales, which jumped 3.10% in June, crushing the estimate of -0.3% (-6.7% prior). If China can avoid further lockdowns in key cities such as Shanghai, we can expect GDP to rebound in Q3. The health of China's economy is critical for Australia, as China is its biggest trading partner.
An excellent employment report earlier this week on Thursday has raised concerns that the RBA may need to accelerate its rate-tightening cycle and consider larger rate increases. The economy gained 88.8 thousand new jobs, blowing the estimate of 30.0 thousand out of the water. As well, the unemployment rate fell to 3.5%, down from 3.9% and below the 3.8% estimate. The RBA has been raising rates aggressively, but even so, the cash rate is still at a low 1.35%, and clearly the RBA will have to hike sharply to make a dent in inflation, which is running at 5.1%. We'll get a look at CPI for the second quarter at the end of July.
AUD/USD is putting pressure on resistance at 0.6782. Next, there is resistance at 0.6839
There is support at 0.6706 and 0.6649

KWEB: UNIQUE LONG TERM OPPORTUNITY?KWEB, Chinese internet ETF
Chinese techs have been in a bear market since February 2021, with the price of KWEB unable to break above the long trend line (in blue).
Kweb has found a bottom in March 2022.
Is Kweb bullish? Is it the end of the bear market for Chinese tech stocks?
Here is everything you need to know before making a decision:
- Currently the price is trying to create a bottoming base as we have seen higher lows (light black line) since March and the bearish trend line (blue) was broken.
- I see an ascending triangle with the top horizontal line of the triangle at 32.71. We tried to break this line 3 times but failed to maintain above. A sustainable break above 32.71 would be considered as bullish.
- We could backtest the rising black line of the ascending triangle before starting a bullish trend, but not sure.
- Mind the small gap around 28 that could also be filled.
- We're above the ichimoku cloud, which shows that the trend is changing. The lagging span (in green) still have to confirm the change of trend by crossing the bearish blue trend line.
- China in quantitative easing mode as western economies are tightening.
I'm long KWEB with a long term view. My buying zone is between 30 and 27.74 with a stop at 26.40 .
Trade safe.

CHINA ENERGY ENGINEERING break rectangle patternChina Energy Engineering (3996.HK) breakthrough rectangle pattern and there is 20% potential upside. Fundamental are positive since China had a hot summer and the demand for electricity increase. CEE is a electricity related stock and stage positive from short-term trend. Stop-loss level is set at 1.03 HKD .

$RDBX unorthodox technical analysis 👁🗨*This is not financial advice, so trade at your own risks*
*My team digs deep and finds stocks that are expected to perform well based off multiple confluences*
*Experienced traders understand the uphill battle in timing the market, so instead my team focuses mainly on risk management
Today my team entered Redbox Entertainment $RDBX at $10 per share. We set an automatic stop loss at $8.80 which would be a -12% loss.
This play has the potential to reach at least 50% above our entry in a very short amount of time. It could also do the exact opposite. We like the chart set-up, but please listen to us when we say that this isn't a safe bet.
Good luck to all!
If you want to see more, please like and follow us @SimplyShowMeTheMoney

$CHINAH bearish set-up? 👁🗨*This is not financial advice, so trade at your own risks*
*My team digs deep and finds stocks that are expected to perform well based off multiple confluences*
*Experienced traders understand the uphill battle in timing the market, so instead my team focuses mainly on risk management
Bitcoin along with the US market should take a decent hit sometime this week due to the continuation of strength in the US dollar. Bear-Index's, the dollar, and energy appear to be where the money will be flowing during this period if this does play out. This would lead to a temporary slowdown in the growing Chinese economy and allow it to retest support.
!! This chart analysis is for reference purposes only !!
If you want to see more, please like and follow us @SimplyShowMeTheMoney

FXI China Large-Cap ETF I am bullish on iShares China Large-Cap ETF.
I would buy the following calls:
2022-8-19 expiration date
$32.11 entry price (approximatively)
$37 strike price
$0.20 premium/share
Looking forward to read your opinion about it.

USDYUANSqueezing pattern, the breakout will determine the direction of the imbalance, a break lower will see price soar down to previous balance, a break up and price searches higher for a fair price.

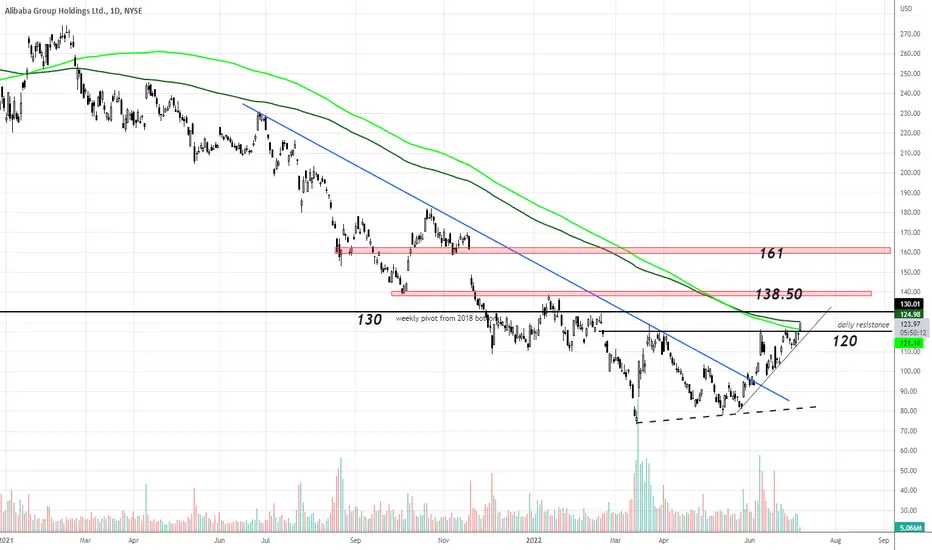
#ALIBABA looking structurally bullishReally like the way Alibaba is bottoming here. Not only have we broken the steep downtrend which has held price down for the last year, but we have broken horizontal resistance at $120 while holding above a new daily uptrend line. Today is the first break above the 200dma since Feb 2021, which is another encouraging sign. Should we hold this breakout above $120 on the daily close today, next targets are $130 which was a major weekly pivot bottom from 2018. Further targets sits at 138.50 and then 161.