BABA Alibaba Options Ahead of EarningsIf you haven`t sold BABA here:
and bought it here:
Now Analyzing the options chain of BABA Alibaba prior to the earnings report this week,
I would consider purchasing the 90usd strike price Calls with
an expiration date of 2023-6-16,
for a premium of approximately $4.45
If these options prove to be profitable prior to the earnings release, I would sell at least half of them.
Looking forward to read your opinion about it.
China50

CHINA50 to stem dip?CHN50 - 24h expiry - We look to Buy at 12845 (stop at 12755)
Although the bears are in control, the stalling negative momentum indicates a turnaround is possible.
Previous support located at 12830.
The hourly chart technicals suggests further downside before the uptrend returns.
Indecisive price action has resulted in sideways congestion on the intraday chart.
Preferred trade is to buy on dips.
Our profit targets will be 12995 and 13045
Resistance: 13180 / 13660 / 14440
Support: 12790 / 12400 / 11845
Please be advised that the information presented on TradingView is provided to Vantage (‘Vantage Global Limited’, ‘we’) by a third-party provider (‘Signal Centre’). Please be reminded that you are solely responsible for the trading decisions on your account. There is a very high degree of risk involved in trading. Any information and/or content is intended entirely for research, educational and informational purposes only and does not constitute investment or consultation advice or investment strategy. The information is not tailored to the investment needs of any specific person and therefore does not involve a consideration of any of the investment objectives, financial situation or needs of any viewer that may receive it. Kindly also note that past performance is not a reliable indicator of future results. Actual results may differ materially from those anticipated in forward-looking or past performance statements. We assume no liability as to the accuracy or completeness of any of the information and/or content provided herein and the Company cannot be held responsible for any omission, mistake nor for any loss or damage including without limitation to any loss of profit which may arise from reliance on any information supplied by Signal Centre.

Looking for CN50 rallies.CHN50 - 24h expiry
Buying pressure from 12916 resulted in prices rejecting the dip.
The current move higher is expected to continue.
The bias is still for lower levels and we look for any gains to be limited.
We therefore, prefer to fade into the rally with a tight stop in anticipation of a move back lower.
Further downside is expected although we prefer to sell into rallies close to the 13355 level.
We look to Sell at 13355 (stop at 13455)
Our profit targets will be 13105 and 13055
Resistance: 13660 / 14440 / 15080
Support: 12790 / 12400 / 11845
Risk Disclaimer
The trade ideas beyond this page are for informational purposes only and do not constitute investment advice or a solicitation to trade. This information is provided by Signal Centre, a third-party unaffiliated with OANDA, and is intended for general circulation only. OANDA does not guarantee the accuracy of this information and assumes no responsibilities for the information provided by the third party. The information does not take into account the specific investment objectives, financial situation, or particular needs of any particular person. You should take into account your specific investment objectives, financial situation, and particular needs before making a commitment to trade, including seeking advice from an independent financial adviser regarding the suitability of the investment, under a separate engagement, as you deem fit.
You accept that you assume all risks in independently viewing the contents and selecting a chosen strategy.
Where the research is distributed in Singapore to a person who is not an Accredited Investor, Expert Investor or an Institutional Investor, Oanda Asia Pacific Pte Ltd (“OAP“) accepts legal responsibility for the contents of the report to such persons only to the extent required by law. Singapore customers should contact OAP at 6579 8289 for matters arising from, or in connection with, the information/research distributed.

CN50 to find support at previous swing low?CHN50 - 24h expiry - We look to Buy at 13005 (stop at 12925)
We are trading at oversold extremes.
Although the bears are in control, the stalling negative momentum indicates a turnaround is possible.
Our short term bias remains positive.
The hourly chart technicals suggests further downside before the uptrend returns.
Further upside is expected although we prefer to set longs at our bespoke support levels at 13000, resulting In improved risk/reward.
Our profit targets will be 13205 and 13255
Resistance: 13660 / 14440 / 15080
Support: 12785 / 12400 / 11845
Please be advised that the information presented on TradingView is provided to Vantage (‘Vantage Global Limited’, ‘we’) by a third-party provider (‘Signal Centre’). Please be reminded that you are solely responsible for the trading decisions on your account. There is a very high degree of risk involved in trading. Any information and/or content is intended entirely for research, educational and informational purposes only and does not constitute investment or consultation advice or investment strategy. The information is not tailored to the investment needs of any specific person and therefore does not involve a consideration of any of the investment objectives, financial situation or needs of any viewer that may receive it. Kindly also note that past performance is not a reliable indicator of future results. Actual results may differ materially from those anticipated in forward-looking or past performance statements. We assume no liability as to the accuracy or completeness of any of the information and/or content provided herein and the Company cannot be held responsible for any omission, mistake nor for any loss or damage including without limitation to any loss of profit which may arise from reliance on any information supplied by Signal Centre.

CN50 to find support at previous resistance?CHN50 - 24h expiry
Selling posted in Asia.
The current move lower is expected to continue.
Short term bias has turned positive.
We therefore, prefer to fade into the dip with a tight stop in anticipation of a move back higher.
Further upside is expected although we prefer to buy into dips close to the 13200 level.
We look to Buy at 13205 (stop at 13125)
Our profit targets will be 13405 and 13445
Resistance: 13660 / 14440 / 15080
Support: 13180 / 12790 / 12400
Please be advised that the information presented on TradingView is provided to Vantage (‘Vantage Global Limited’, ‘we’) by a third-party provider (‘Signal Centre’). Please be reminded that you are solely responsible for the trading decisions on your account. There is a very high degree of risk involved in trading. Any information and/or content is intended entirely for research, educational and informational purposes only and does not constitute investment or consultation advice or investment strategy. The information is not tailored to the investment needs of any specific person and therefore does not involve a consideration of any of the investment objectives, financial situation or needs of any viewer that may receive it. Kindly also note that past performance is not a reliable indicator of future results. Actual results may differ materially from those anticipated in forward-looking or past performance statements. We assume no liability as to the accuracy or completeness of any of the information and/or content provided herein and the Company cannot be held responsible for any omission, mistake nor for any loss or damage including without limitation to any loss of profit which may arise from reliance on any information supplied by Signal Centre.

China50 to stall at previous resistance?CHN50 - 24h expiry
Although the bulls are in control, the stalling positive momentum indicates a turnaround is possible.
This is negative for short term sentiment and we look to set shorts at good risk/reward levels for a further correction lower.
The hourly chart technicals suggests further upside before the downtrend returns.
The bias is still for lower levels and we look for any gains to be limited.
Further downside is expected although we prefer to sell into rallies close to the 13375 level.
We look to Sell at 13320 (stop at 13399)
Our profit targets will be 13119 and 13069
Resistance: 13660 / 14440 / 15080
Support: 12790 / 12400 / 11845
Risk Disclaimer
The trade ideas beyond this page are for informational purposes only and do not constitute investment advice or a solicitation to trade. This information is provided by Signal Centre, a third-party unaffiliated with OANDA, and is intended for general circulation only. OANDA does not guarantee the accuracy of this information and assumes no responsibilities for the information provided by the third party. The information does not take into account the specific investment objectives, financial situation, or particular needs of any particular person. You should take into account your specific investment objectives, financial situation, and particular needs before making a commitment to trade, including seeking advice from an independent financial adviser regarding the suitability of the investment, under a separate engagement, as you deem fit.
You accept that you assume all risks in independently viewing the contents and selecting a chosen strategy.
Where the research is distributed in Singapore to a person who is not an Accredited Investor, Expert Investor or an Institutional Investor, Oanda Asia Pacific Pte Ltd (“OAP“) accepts legal responsibility for the contents of the report to such persons only to the extent required by law. Singapore customers should contact OAP at 6579 8289 for matters arising from, or in connection with, the information/research distributed.

Hang Seng Index (HSI) WCA - Inverted Head and Shoulders PatternHello and thank you for taking the time to read my post. Today, we analyze the Hang Seng Index (HSI) on the weekly scale, focusing on a classic price pattern called the "Inverted Head and Shoulders Pattern." The Hang Seng Index is the leading stock index in Hong Kong and one of the most important in Asia. It tracks the share prices of the 50 largest and most traded companies on the Hong Kong Stock Exchange, representing about 57% of the total market capitalization on this exchange.
Inverted Head and Shoulders Pattern:
The inverted head and shoulders pattern is a bullish reversal pattern that occurs at the end of a downtrend. It is characterized by three troughs or valleys, with the middle one being the lowest (the head) and the two on either side being relatively higher (the shoulders). The pattern is completed by a horizontal line called the "neckline," which connects the highs of the shoulders. In a nutshell, the formation of the inverted head and shoulders pattern signals a potential reversal from a downtrend to an uptrend.
Remember, this is just a brief introduction to the technical aspects of the inverted head and shoulders pattern. As you delve deeper into this topic, you'll discover more nuances and practical applications that can enhance your trading strategies.
Additional Analysis:
Upon analyzing the HSI weekly chart, we observe a downward trend since 16/02/2021, with the blue diagonal resistance line representing the general trend. As classic chart pattern analysts, our attention is immediately drawn to the textbook example of an inverted head and shoulders pattern, clearly defined with the left shoulder, head, and right shoulder. The symmetry between the shoulders is perfect, and the pattern has been forming for an impressive 491 days. This is noteworthy because the longer a price pattern remains consistent, the more powerful the eventual breakout will be.
We cannot predict when the right shoulder will form and break out, but we can see that the price supports the symmetry line in the form of a bullish engulfing (orange mark). The price is currently still below the 200 EMA, which is another indication that we should continue to watch this price pattern closely and not jump to conclusions. Thus, we patiently await our opportunity.
Conclusion:
The Hang Seng Index (HSI) weekly chart showcases an Inverted Head and Shoulders Pattern, reflecting a potential reversal from a downtrend to an uptrend. By closely monitoring the pattern's intricacies and the market's subtle cues, traders can be better prepared for any potential price action in the future. As always, it's essential to consider risk management and proper position sizing when trading based on chart patterns.
Please note that this analysis is not financial advice. Always do your own due diligence when investing or trading.
If you found this analysis helpful, please like, share, and follow for more updates. Happy trading!
Best regards,

China50 to see a limited rally?CHN50 - 24h expiry -
Buying pressure from 12830 resulted in prices rejecting the dip.
The current move higher is expected to continue.
With the Ichimoku cloud resistance above we expect gains to be limited.
We therefore, prefer to fade into the rally with a tight stop in anticipation of a move back lower.
Further downside is expected although we prefer to sell into rallies close to the 13100 level.
We look to Sell at 13095( stop at 13205)
Our profit targets will be 12825 and 12765
Resistance: 13180 / 13660 / 14440
Support: 12790 / 12400 / 11845
Risk Disclaimer
The trade ideas beyond this page are for informational purposes only and do not constitute investment advice or a solicitation to trade. This information is provided by Signal Centre, a third-party unaffiliated with OANDA, and is intended for general circulation only. OANDA does not guarantee the accuracy of this information and assumes no responsibilities for the information provided by the third party. The information does not take into account the specific investment objectives, financial situation, or particular needs of any particular person. You should take into account your specific investment objectives, financial situation, and particular needs before making a commitment to trade, including seeking advice from an independent financial adviser regarding the suitability of the investment, under a separate engagement, as you deem fit.
You accept that you assume all risks in independently viewing the contents and selecting a chosen strategy.
Where the research is distributed in Singapore to a person who is not an Accredited Investor, Expert Investor or an Institutional Investor, Oanda Asia Pacific Pte Ltd (“OAP“) accepts legal responsibility for the contents of the report to such persons only to the extent required by law. Singapore customers should contact OAP at 6579 8289 for matters arising from, or in connection with, the information/research distributed.

'Can China’s Long-Term Growth Rate Exceed 2–3 Percent?' SummaryThis is a summary of Michael Pettis' 'Can China’s Long-Term Growth Rate Exceed 2–3 Percent?' carnegieendowment.org
As the text was quite long, this summarizes some critical points.
China's high investment share of GDP and growing debt burden are interrelated, stemming from an investment-driven growth model that began in the 1980s when the country needed significant investment in infrastructure, urban property development, and manufacturing facilities. High domestic investment required high domestic savings, leading to a rapid savings increase by constraining household consumption and income growth. Policymakers now recognize the need to rebalance China's economy towards domestic consumption.
High investment levels initially benefited the Chinese economy, as productive investment grew at the fastest pace in history. However, a successful development model should make itself obsolete, and China has closed the gap between its actual investment level and the level its businesses and workers can productively absorb. As productivity benefits of additional investment decline, more investment begins to generate less economic value than the value of employed resources. This can be observed in China's increasing debt numbers.
Countries that followed this growth model experienced a period of rapid, sustainable growth with stable debt levels, followed by a period of rapid, unsustainable growth driven by a surging debt burden. China entered this phase around fifteen years ago. Therefore, the investment share of China's GDP must decline sharply in the next few years, as the conditions that made high investment levels sustainable no longer exist. Historical precedents suggest that reducing the investment share of GDP to a sustainable level is better for the economy's long-term health, growth, and stability.
In this context, rebalancing the Chinese economy will require significant adjustments in its economic structure. Beijing must focus on boosting domestic consumption, though this would likely result in a decline in China's annual GDP growth to around 2-3 percent for many years. The current investment share of GDP is extraordinarily high, making it difficult to reduce it without significantly affecting overall economic activity.
Policymakers in Beijing have increasingly called for an expansion in the role of consumption, but there are significant political constraints in implementing such policies. Rebalancing would require consumption to grow faster than GDP and GDP to grow faster than investment. This implies transferring income from governments and businesses to households, a process that has not yet seen concrete proposals.
The decline in growth will be unevenly distributed, with local governments bearing the brunt of the adjustment while ordinary Chinese people experience less impact. This also means that sectors of the global economy that depend on Chinese investment growth will be more affected, while those reliant on Chinese consumption will be less impacted.
China's investment share of GDP currently stands at around 42-44 percent, which is unsustainable in the long run. For the purposes of this analysis, it is assumed that China should reduce its investment share to 30 percent over ten years, a level typical of rapidly developing economies. As investment declines, the consumption share of GDP must rise.
Michael presents five scenarios under which China can rebalance its economy:
A. Rebalance with a surge in consumption: China's consumption would need to grow by 6-7% annually, while investment grows by 0-1% annually, resulting in a GDP growth rate of 4% over ten years. However, this requires politically difficult income transfers from local governments and wealthy individuals to households.
B. Rebalance while maintaining current consumption growth rates: Consumption growth would remain at 3-4%, with investment contracting by 1-2% annually. This would lead to an average annual GDP growth rate of 1.5% over ten years.
C. Rebalance with a sharp decline in consumption growth: If consumption growth drops to 1-2% annually, the investment must decline by nearly 3% annually, leading to flat GDP growth.
D. Rebalance with a sharp contraction in GDP: This scenario involves a short-term, severe GDP contraction but is considered politically disruptive and unlikely.
E. Rebalance over a much extended period: If China takes 15-20 years to rebalance, with consumption growth at 3-4% annually, GDP growth will drop to 2% and 2.5%, respectively.
Key points include the limited ways China can rebalance, the difficulty in maintaining a high investment share indefinitely, and the necessity of a surge in consumption growth for a more balanced economy. Rebalancing will involve slower GDP growth without faster consumption growth, driven by significant and politically challenging income transfers.
In conclusion, China's rebalancing process will require significant adjustments in its economic structure. The country must reduce its reliance on investment and increase the role of consumption in driving growth. However, the political constraints and the impact on various sectors of the economy make this a challenging task for policymakers. The five scenarios presented illustrate the complexities of the rebalancing process and emphasize the need for a well-thought-out and carefully executed strategy.
China's future economic health depends on its ability to navigate these challenges and transition to a more sustainable growth model. Beijing must strike a delicate balance between addressing political constraints and implementing policies that promote consumption growth while minimizing the negative impacts on various sectors and local governments.
Moreover, the global economy is intricately connected to China's growth trajectory. As China undertakes the rebalancing process, the repercussions will be felt in sectors reliant on Chinese investment and consumption. Businesses and governments worldwide must closely monitor the situation and adapt to these changes.
This analysis highlights the importance of understanding the complexities of China's rebalancing process and its implications for the Chinese and global economies. As China grapples with these challenges, the world must brace itself for the changes arising from this monumental shift in the world's second-largest economy. Only time will tell if China's rebalancing efforts will successfully pave the way for a more stable and sustainable economic future.

HANG SENG BUYIncreasing confidence for global economic resilience in 2023. Global growth for 2023 has continued to improve. The U.S. has started the year with a degree of momentum, even if activity could wane as the year progresses. Chinese activity is bouncing back as the economy reopens, while the Eurozone is likely to benefit as energy prices have receded and headline inflation has slowed. While banking and financial sector strains have clouded the outlook to some extent, we ultimately believe authorities will do whatever is needed and will be successful in containing those difficulties. Against that backdrop, our upwardly revised forecast means we now expect the global economy to avoid recession this year.

Lower correction expected from CN50.CHN50 - 24h expiry - We look to Buy at 13045 (stop at 12975)
There is no sign that this bullish momentum is faltering but the pair has stalled close to a previous swing high of 13369.
Price action looks to be forming a top.
A lower correction is expected.
Short term bias is mildly bullish.
We therefore, prefer to fade into the dip with a tight stop in anticipation of a move back higher.
Our profit targets will be 13245 and 13660
Resistance: 13660 / 14440 / 15080
Support: 13180 / 12790 / 12400
Please be advised that the information presented on TradingView is provided to Vantage (‘Vantage Global Limited’, ‘we’) by a third-party provider (‘Signal Centre’). Please be reminded that you are solely responsible for the trading decisions on your account. There is a very high degree of risk involved in trading. Any information and/or content is intended entirely for research, educational and informational purposes only and does not constitute investment or consultation advice or investment strategy. The information is not tailored to the investment needs of any specific person and therefore does not involve a consideration of any of the investment objectives, financial situation or needs of any viewer that may receive it. Kindly also note that past performance is not a reliable indicator of future results. Actual results may differ materially from those anticipated in forward-looking or past performance statements. We assume no liability as to the accuracy or completeness of any of the information and/or content provided herein and the Company cannot be held responsible for any omission, mistake nor for any loss or damage including without limitation to any loss of profit which may arise from reliance on any information supplied by Signal Centre.

Looking for CN50 to stall at resistance.CHN50 - 24h expiry - We look to Sell at 13105 (stop at 13205)
Although the bears are in control, the stalling negative momentum indicates a turnaround is possible.
A higher correction is expected.
The bias is still for lower levels and we look for any gains to be limited.
We therefore, prefer to fade into the rally with a tight stop in anticipation of a move back lower.
Further downside is expected although we prefer to sell into rallies close to the 13115 level.
Our profit targets will be 12815 and 12715
Resistance: 13110 / 13570 / 14235
Support: 12640 / 12070 / 11140
Risk Disclaimer
The trade ideas beyond this page are for informational purposes only and do not constitute investment advice or a solicitation to trade. This information is provided by Signal Centre, a third-party unaffiliated with OANDA, and is intended for general circulation only. OANDA does not guarantee the accuracy of this information and assumes no responsibilities for the information provided by the third party. The information does not take into account the specific investment objectives, financial situation, or particular needs of any particular person. You should take into account your specific investment objectives, financial situation, and particular needs before making a commitment to trade, including seeking advice from an independent financial adviser regarding the suitability of the investment, under a separate engagement, as you deem fit.
You accept that you assume all risks in independently viewing the contents and selecting a chosen strategy.
Where the research is distributed in Singapore to a person who is not an Accredited Investor, Expert Investor or an Institutional Investor, Oanda Asia Pacific Pte Ltd (“OAP“) accepts legal responsibility for the contents of the report to such persons only to the extent required by law. Singapore customers should contact OAP at 6579 8289 for matters arising from, or in connection with, the information/research distributed.

CN50 to break lower?CHN50 - 24h expiry - We look to Sell a break of 12812 (stop at 12875)
Selling pressure from 13020 resulted in all the initial daily gains being overturned.
The current move lower is expected to continue.
Previous support located at 12812.
The medium term bias remains bearish.
Further downside is expected, however, due to the strong support below we prefer to sell a break of 12812, which will confirm the bearish sentiment.
Our profit targets will be 12630 and 12400
Resistance: 13180 / 13660 / 14440
Support: 12790 / 12400 / 11845
Please be advised that the information presented on TradingView is provided to Vantage (‘Vantage Global Limited’, ‘we’) by a third-party provider (‘Signal Centre’). Please be reminded that you are solely responsible for the trading decisions on your account. There is a very high degree of risk involved in trading. Any information and/or content is intended entirely for research, educational and informational purposes only and does not constitute investment or consultation advice or investment strategy. The information is not tailored to the investment needs of any specific person and therefore does not involve a consideration of any of the investment objectives, financial situation or needs of any viewer that may receive it. Kindly also note that past performance is not a reliable indicator of future results. Actual results may differ materially from those anticipated in forward-looking or past performance statements. We assume no liability as to the accuracy or completeness of any of the information and/or content provided herein and the Company cannot be held responsible for any omission, mistake nor for any loss or damage including without limitation to any loss of profit which may arise from reliance on any information supplied by Signal Centre.

Furthside downside is expected from CN50.CHN50 - 24h expiry - We look to Sell at 13180 (stop at 13260)
Buying pressure from 13031 resulted in prices rejecting the dip.
The current move higher is expected to continue.
The bias is still for lower levels and we look for any gains to be limited.
We therefore, prefer to fade into the rally with a tight stop in anticipation of a move back lower.
Further downside is expected although we prefer to sell into rallies close to the 13180 level.
Our profit targets will be 12950 and 12790
Resistance: 13180 / 13660 / 14440
Support: 12790 / 12400 / 11845
Please be advised that the information presented on TradingView is provided to Vantage (‘Vantage Global Limited’, ‘we’) by a third-party provider (‘Signal Centre’). Please be reminded that you are solely responsible for the trading decisions on your account. There is a very high degree of risk involved in trading. Any information and/or content is intended entirely for research, educational and informational purposes only and does not constitute investment or consultation advice or investment strategy. The information is not tailored to the investment needs of any specific person and therefore does not involve a consideration of any of the investment objectives, financial situation or needs of any viewer that may receive it. Kindly also note that past performance is not a reliable indicator of future results. Actual results may differ materially from those anticipated in forward-looking or past performance statements. We assume no liability as to the accuracy or completeness of any of the information and/or content provided herein and the Company cannot be held responsible for any omission, mistake nor for any loss or damage including without limitation to any loss of profit which may arise from reliance on any information supplied by Signal Centre.

CN50 to find support at previous resistance?CHN50 - 24h expiry - We look to Buy at 13350 (stop at 13245)
Although the bulls are in control, the stalling positive momentum indicates a turnaround is possible.
A lower correction is expected.
The 50% Fibonacci retracement is located at 13357 from 13116 to 13599.
Further upside is expected although we prefer to buy into dips close to the 13350 level.
Although the anticipated move higher is corrective, it does offer ample risk/reward today.
Our profit targets will be 13660 and 14440
Resistance: 13660 / 14440 / 15080
Support: 13180 / 12790 / 12400
Please be advised that the information presented on TradingView is provided to Vantage (‘Vantage Global Limited’, ‘we’) by a third-party provider (‘Signal Centre’). Please be reminded that you are solely responsible for the trading decisions on your account. There is a very high degree of risk involved in trading. Any information and/or content is intended entirely for research, educational and informational purposes only and does not constitute investment or consultation advice or investment strategy. The information is not tailored to the investment needs of any specific person and therefore does not involve a consideration of any of the investment objectives, financial situation or needs of any viewer that may receive it. Kindly also note that past performance is not a reliable indicator of future results. Actual results may differ materially from those anticipated in forward-looking or past performance statements. We assume no liability as to the accuracy or completeness of any of the information and/or content provided herein and the Company cannot be held responsible for any omission, mistake nor for any loss or damage including without limitation to any loss of profit which may arise from reliance on any information supplied by Signal Centre.

Hang Seng bounced strongly! Is the China bull back?Something bullish is happening in China, potentially primarily due to the reopening and all the liquidity injections by the PBoC. China never raised rates while slowly adding liquidity to markets. We saw a significant capitulation when Xi became emperor for life by removing everyone that could potentially cause trouble to him from the CCP, as well as when we first saw the first sanctions on China by the US. It's clear that the US and China are in a cold war, and the US will keep imposing sanctions on China... Many of which might come back to bite it. Now there is talk about capital controls, yet China holds many US bonds and has been part of why inflation stayed low for so long. Of course, China has many issues, but so does the US, and what they both have in common is that they will have to print a ton of money.
What's critical here is that the Hang Seng has been trending lower for a while, especially since China started taking 'back' Hong Kong, but then started bottoming around peak China fears (never reopening + Taiwan invasion). For now, an invasion seems unlikely, and all the concerns about capital controls could not have the result everyone thinks they will. The market is incredibly oversold, and Chinese investors may be forced to repatriate their capital and start investing there.
''The Hang Seng Index can be used as a bellwether for markets worldwide. If the gain in Hang Seng holds, that would be a bullish indicant for markets worldwide. If the low is violated, that would suggest continued decline in other markets as well. We say this because the late January and early February market peaks were a worldwide phenomenon. Stocks, Bonds and Commodities all peaked in tandem, suggesting a shift in the underlying perception of the fundamentals from one of continued growth and declining inflation to one of slower growth or recession accompanied by persistent inflationary pressures.''
Milton W Berg CFA
@BergMilton
I agree with Milton, and to me, this looks special. First, HSI bounced right at the Yearly pivot. The bounce came to a massive rally from the lows, which swept the double top, hit resistance, and had a decent pullback. The bounce straight into the monthly pivot, which usually acts as a magnet. So we have gone from pivot to pivot very quickly. When looking at CN50, we get an extra confirmation that something bullish is happening. Again, massive rally, significant pullback, bounce at support, reclaim yearly pivot, a break above the monthly pivot, slight pullback, and sit right above the monthly pivot. Technically both look bullish to me.
Only a close of 2% below the recent lows would make me think that the market is about to keep going lower. Until then, I assume that both these markets are in a bull market and that China isn't as uninvestable as many make it seem to be. Of course, if you are a US investor, you shouldn't be investing in China, but for most of the rest of the world, China seems fine (for now). They keep getting cheap oil from Russia, they are politically stable (nobody to go against Xi), won't invade Taiwan anytime soon (based on what they saw in Ukraine), and Japan also kept printing and didn't raise rates (capital flows into China)

Rebound after retesting the top of descending triangle? Previous H&S idea was invalidated, the price went testing the top of the descending triangle and seems to find some bid there. If we can rally from here we could visit again the range 14'750-15'000. If the price closes back below the triangle look for bearish continuation.

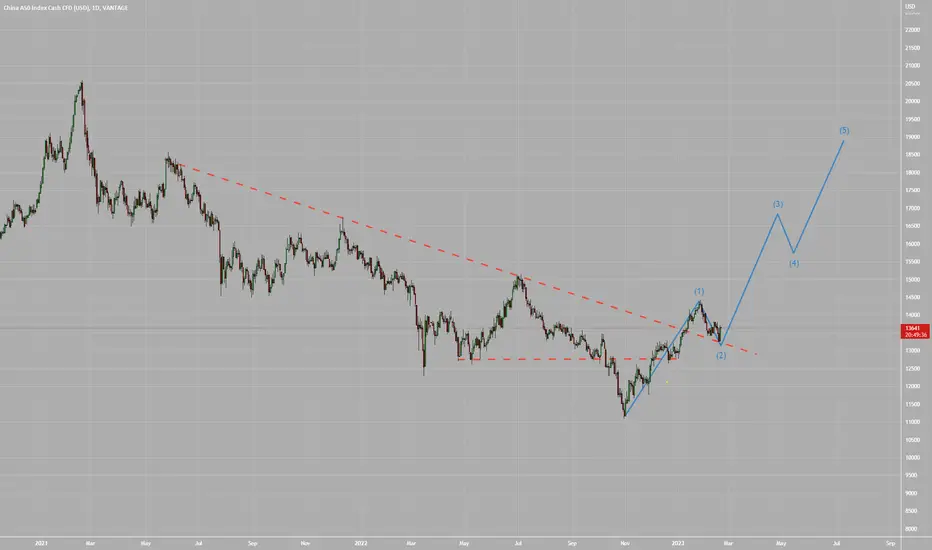
The Dragon Bouncing BackSwift dismantling of zero-Covid policy in China has triggered a surge in demand resulting in robust economic recovery. Is this a flash in the pan or a structural shift?
Bouncing off from 2022 bottom in early November, Chinese equities (represented by FTSE China 50 Index, "China50 Index") rallied 64% on COVID easing. The rally has stalled based on specific sector weaknesses causing a 12% correction in February.
This paper argues that record revenues (over CNY holidays in January), anticipated pro-growth Government stimulus, record-levels of consumer savings, and loose monetary policy will collectively drive Chinese equities higher.
A long position in CME’s E-Mini FTSE China 50 Index futures will deliver a reward-to-risk ratio of 2.35x while riding this economic shift.
SECOND LEG OF RE-OPENING TO LEAD TO RECOVERY
Five reasons support our bullish stance on Chinese equities:
First, favourable technical signals. Stalled rally plus weak sentiments have caused the markets to retrace 12%, leaving it right below a key Fibonacci retracement level. This suggests that the FTSE China 50 Index could continue its upward trajectory in 2023 as reopening turns into recovery.
Second, pro-growth fiscal policies. Investors hold high anticipation of upcoming National People's Congress (NPC) scheduled for early March. During the “Two Sessions,” the government is expected to make pro-growth policy announcements to boost the economy.
Historical analysis shows that the Two Sessions (NPC plus top political advisory body meeting) tend to provide solid tail winds to the stock market. Shares have previously rallied ahead of the meetings and afterwards as investors digest the news. Over the last decade, real estate & healthcare shares delivered the largest excess returns following these meetings.
Third, accommodative monetary policies. Meanwhile, PBOC added liquidity into the financial system to meet a rapid rebound in loan demand. PBOC kept short-term & long-term Loan Prime Rate (LPR) unchanged for the sixth straight month. Short-term LPR was at 3.65%. Long-term LPR (used to calculate mortgage rates) was at 4.3%. Both are at their lowest level in 20 years as China tries to balance economic growth and currency stability.
Fourth, revenge spending. Forced to stay home due to Covid restrictions & unable to spend, Chinese consumers saved one-third of their income last year, depositing RMB 17.8 trillion (USD 2.6 trillion) into banks. Even for a thrifty nation like China, that's massive. With restrictions gone, will Chinese consumers revenge to spend their excess savings?
Finally, valuations of Chinese shares are seemingly still in bulls’ favour despite the reopening rally. The MSCI China Index is trading at 10.9x forward P/E, below the 10-year average of 11.2x.
In tandem with equity market price retracement, China centric commodities such as Iron Ore and Copper have also stalled. But are looking to rise again.
ECONOMIC DATA PAINTS A HOPEFUL FUTURE AHEAD
Economic data from China show positive signs of economic recovery in 2023. Purchasing Manager Index (PMI), an important leading indicator of business activity, rebounded sharply in January.
GOVERNMENT PRIORITIZING ECONOMIC GROWTH
The Chinese government has announced stimulus packages to support its struggling Real Estate and Tech Sectors. For instance, Guangzhou recently committed $29 billion to local tech funds to inject capital into high-tech sectors.
The government also announced a 21-point plan in January to boost property developer’s balance sheets with $67 billion in aid.
Moving in tandem with pro-growth Government accommodative fiscal policy, the PBOC continues its commitment to accommodative monetary policy by keeping key short- and long-term Loan Prime Rate (LPR) at their lowest level in almost two decades to boost growth.
However, this monetary stimulus comes at the cost of rising inflation in the country.
PROFESSIONAL INVESTORS ARE BULLISH CHINA AGAIN
In a note recently published by Goldman Sachs, the bank expects Chinese stocks to surge as much as 24% by the end of this year as the economy shifts from reopening to recovery.
The bank highlighted that "professional speculators" on their prime brokerage platform are showing a greater appetite for Chinese stocks.
Goldman highlighted that hedge funds had substantially re-risked their exposure in offshore Chinese equities with net Chinese exposure to total equity exposure reverting to all-time highs.
FOREIGN INVESTORS ARE BULLISH CHINA TOO
HKEX's Stock Connect program’s north bound flows shows that foreign investors heavily bought into Chinese equities in January and continue to so do in February despite retracement.
The Shanghai Northbound Stock Connect, which allows HK investors to access Chinese equities listed on Shanghai Stock Exchange (SSE) saw net buying of RMB 83.4B so far in 2023.
The Shenzhen Northbound Stock Connect shows net purchases of RMB 74.1B this year. In comparison, these investors bought RMB 9.6B of Shanghai & RMB 25.4B Shenzhen shares in December.
Besides the connect program, foreign investment into China scaled up in January to the highest level since June 2022. Foreign investors bought RMB 128 billion ($18.7 billion) according to China’s Ministry of Commerce. That was 14.5% higher YoY and a 75% jump in investment into high-tech manufacturing. This spike reversed two months of double-digit drops in late 2022.
DEMYSTIFYING THE CHINA 50 INDEX
The FTSE China 50 Index comprises of the 50 largest and most liquid Chinese stocks that are listed and traded in Hong Kong. The index is specifically designed for international investors to get exposure to Chinese equities.
The China 50 index is dominated by large tech stocks representing 23.4% of the index. Bank stocks have a 18% weightage with retailer shares weighing in at 15%.
The overall index provides a balanced with a mildly skewed tech exposure to Chinese equities.
TRADE SET UP
With a raft of Government and PBOC policies supporting Chinese economic recovery amplified by optimistic investor sentiments, this paper proposes a long position in CME’s E-Mini FTSE China 50 Index futures expiring in June 2023 to harvest a 2.35x reward to risk ratio.
Each futures contract offers exposure to $2 x China 50 Index.
Entry: 12,990
Target: 15,800
Stop: 11,800
Profit at Target: $5,620
Loss at Stop: $2,380
Reward-to-Risk Ratio: 2.35x
MARKET DATA
CME Real-time Market Data helps identify trading set-ups and express market views better. If you have futures in your trading portfolio, you can check out on CME Group data plans available that suit your trading needs www.tradingview.com
DISCLAIMER
This case study is for educational purposes only and does not constitute investment recommendations or advice. Nor are they used to promote any specific products, or services.
Trading or investment ideas cited here are for illustration only, as an integral part of a case study to demonstrate the fundamental concepts in risk management or trading under the market scenarios being discussed. Please read the FULL DISCLAIMER the link to which is provided in our profile description.

Buying CN50 at current swing low.CHN50 - 24h expiry - We look to Buy at 13261 (stop at 13101)
Although the bears are in control, the stalling negative momentum indicates a turnaround is possible.
This is positive for short term sentiment and we look to set longs at good risk/reward levels for a further correction higher.
Trading within a Bearish Channel formation.
Our expectation now is for this swing lower to continue towards the bottom of the trend channel, to complete a correction before buyers return.
Although the anticipated move higher is corrective, it does offer ample risk/reward today.
Our profit targets will be 13661 and 13741
Resistance: 13570 / 14235 / 15080
Support: 13110 / 12645 / 12070
Please be advised that the information presented on TradingView is provided to Vantage (‘Vantage Global Limited’, ‘we’) by a third-party provider (‘Signal Centre’). Please be reminded that you are solely responsible for the trading decisions on your account. There is a very high degree of risk involved in trading. Any information and/or content is intended entirely for research, educational and informational purposes only and does not constitute investment or consultation advice or investment strategy. The information is not tailored to the investment needs of any specific person and therefore does not involve a consideration of any of the investment objectives, financial situation or needs of any viewer that may receive it. Kindly also note that past performance is not a reliable indicator of future results. Actual results may differ materially from those anticipated in forward-looking or past performance statements. We assume no liability as to the accuracy or completeness of any of the information and/or content provided herein and the Company cannot be held responsible for any omission, mistake nor for any loss or damage including without limitation to any loss of profit which may arise from reliance on any information supplied by Signal Centre.

BABA Alibaba Options Ahead of EarningsIf you haven`t sold BABA when Charlie Munger did:
or reentered when it was cheaper than the IPO:
Now looking at the BABA Alibaba options chain ahead of earnings , I would buy the $110 strike price Calls with
2023-8-18 expiration date for about
$10.20 premium.
If the options turn out to be profitable Before the earnings release, I would sell at least 50%.
I have chosen that expiration date to allow me to be wrong and not close the position and to have a bigger gain by the expiration date, if BABA Alibaba keeps on climbing.
Looking forward to read your opinion about it.

China holds lending benchmarks for 6th month, but more easingChina kept its benchmark lending rates unchanged for a sixth straight month in February, as expected, with the world’s second-largest economy showing more signs of recovery from a pandemic-induced slump.
Watch out China A shares Price has tested support and rebounded on the descending triangle which was also the 200 SMA. I am expecting the price to raise from here and complete a possible right shoulder (neck at 14.3k). This could lead to a powerful breakout.
NFA.

China: Back to the Grind (SHORT)China:
Morgan Stanley scenario:
Chinese stock indexes could plunge by another 20% from current levels over the next six to 12 months — and potentially remain lower for much longer if the hypothetical stress scenario persists.
China’s GDP could slow drastically, averaging 2% growth in 2023.
More than 11 million people could lose their jobs, likely sending the urban unemployment rate above 7%. Construction, accommodation and catering would see the most job cuts.
