China50 Target Locked | Long Setup via Thief Strategy🏴☠️ CHINA50 Market Robbery Blueprint 🔥 | Thief Trading Style (Swing/Day Plan)
🌍 Hey Money Makers, Chart Hackers, and Global Robbers! 💰🤑💸
Welcome to the new Heist Plan by your favorite thief in the game — this time targeting the CHINA50 Index CFD like a smooth criminal on the charts. 🎯📊
This is not your average technical analysis — it's a strategic robbery based on Thief Trading Style™, blending deep technical + fundamental analysis, market psychology, and raw trader instincts.
💼 THE SETUP — PREPARE FOR THE ROBBERY 🎯
We're looking at a bullish operation, setting up to break into the high-value vaults near a high-risk, high-reward resistance zone — beware, it's a high-voltage trap area where pro sellers and bearish robbers set their ambush. ⚡🔌
This plan includes a layered DCA-style entry, aiming for max profit with controlled risk. Chart alarms on, mindset ready. 🧠📈🔔
🟢 ENTRY: "The Robbery Begins"
📍 Zone-1 Buy: Near 0.63700 after MA pullback
📍 Zone-2 Buy: Near 0.62800 deeper pullback
🛠️ Entry Style: Limit Orders + DCA Layering
🎯 Wait for MA crossover confirmations and price reaction zones — don’t chase, trap the market.
🔻 STOP LOSS: "Plan the Escape Route"
⛔ SL for Pullback-1: 13540 (4H swing low)
⛔ SL for Pullback-2: 13350
📌 SL placement depends on your position sizing & risk management. Control the loss; live to rob another day. 🎭💼
🎯 TARGET ZONE: “Cash Out Point”
💸 First TP: 14100
🏁 Let the profit ride if momentum allows. Use a trailing SL once it moves in your favor to lock in gains.
👀 Scalpers Note:
Only play the long side. If your capital is heavy, take early moves. If you’re light, swing it with the gang. Stay on the bullish train and avoid shorting traps. Use tight trailing SL.
🔎 THE STORY BEHIND THE HEIST – WHY BULLISH?
CHINA50 shows bullish momentum driven by:
💹 Technical bounce off major support
🌏 Macroeconomic & geopolitical sentiment
📰 Volume + sentiment shift (risk-on)
📈 Cross-market index confirmation
🧠 Smart traders are preparing, not reacting. Stay ahead of the herd.
👉 For deeper insight, refer to:
✅ Macro Reports
✅ COT Data
✅ Intermarket Correlations
✅ CHINA-specific index outlooks
⚠️ RISK WARNING – TRADING EVENTS & VOLATILITY
🗓️ News releases can flip sentiment fast — we advise:
❌ Avoid new positions during high-impact events
🔁 Use trailing SLs to protect profit
🔔 Always manage position sizing and alerts wisely
❤️ SUPPORT THE CREW | BOOST THE PLAN
Love this analysis? Smash that Boost Button to power the team.
Join the Thief Squad and trade like legends — Steal Smart, Trade Sharp. 💥💪💰
Every day in the market is a new heist opportunity — if you have a plan. Stay tuned for more wild robbery blueprints.
📌 This is not financial advice. Trade at your own risk. Adjust based on your personal strategy and capital. Market conditions evolve fast — stay updated, stay alert.
Chinastocks

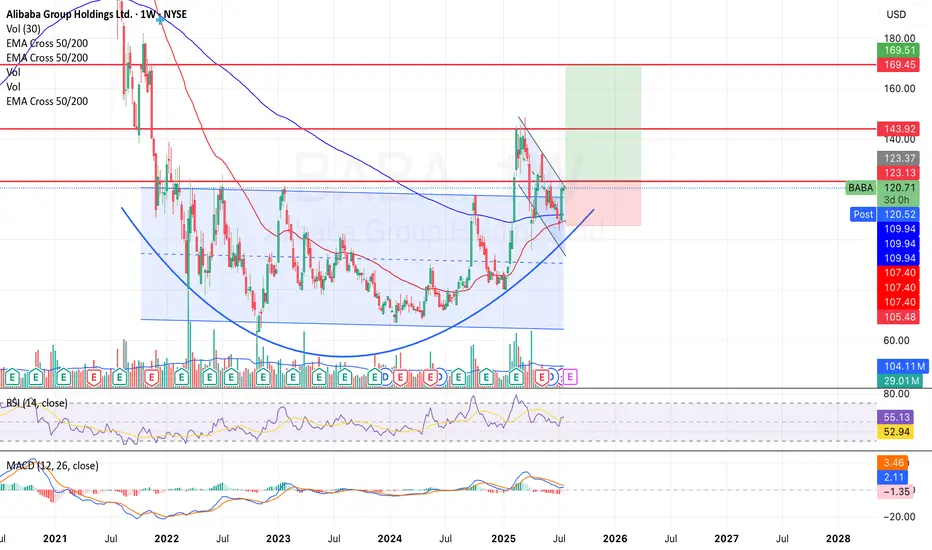
Much needed break for $BABA on the horizonI took a much needed break but not as long as NYSE:BABA has taken since 2021; swinging between ~$70 and ~$120 over the past six years.
I strongly suspect that this might have something to do with Jack Ma's speech in late 2024 that made him go 'missing' from public view
- www.wired.com .
The stock has formed a multi-year rounded bottom (cup) followed by a handle formation, a classic bullish reversal pattern. Price is currently consolidating just below the ~$123 resistance with a potential target of $143 - $170 if this breaks resistance.
I will hedge my bets on a bullish run and find support around $107 - $109 if the breakout is rejected.
NYSE:BABA is currently trading above the 50 and 200-week EMA and I see a potential golden cross forming in the coming days.
U.S - China relations still proves challenging but with earnings on the horizon I am optimistic that it will be the catalyst for this breakout.
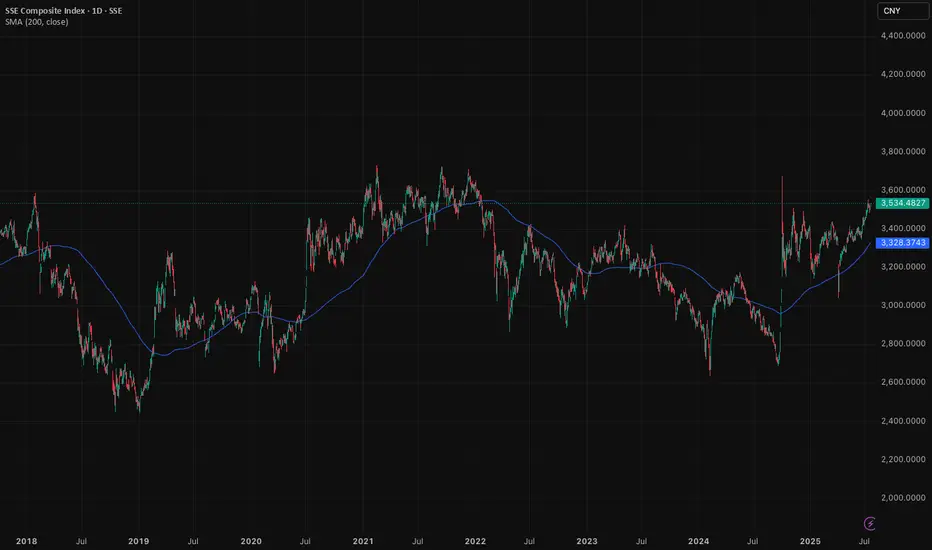
Shanghai Composite: Double bottom signals potential upsideChinese stocks are not for the faint-hearted. It's a market with a lot of volatility, swings, and roundabouts. Despite this, we've been keeping a close eye on the Shanghai Composite Index over the past few weeks and like the pattern we are seeing emerge.
As of the time of writing, the Shanghai Composite Index trades in the 3,500 range. A clear double bottom emerged in September and January last year, as indicated in the chart. We think this is a bullish pattern. When markets test the lows twice and rebound, conviction grows. The worst, it seems, is maybe behind us.
New trades should take important note and understand that Shanghai-listed stocks differ greatly from the H-shares trading in Hong Kong. The Shanghai Composite primarily includes A-shares, domestic Chinese companies driven by local sentiment and liquidity. H-shares, though still Chinese firms, list offshore in Hong Kong and often reflect global investor attitudes rather than local momentum.
Understanding your instrument is crucial. While Shanghai A-shares capture China's domestic economic pulse, H-shares in Hong Kong frequently mirror global risk appetite and geopolitical narratives. Our bullish case lies specifically with the Shanghai market. It is a bet on China's internal economic recovery, supportive policy measures, and improving investor sentiment.
China’s economic stabilisation is underway. Stimulus measures from Beijing are gaining traction. Property market stabilisation efforts (which are medium term in nature) and easing monetary policy signal confidence. Domestic investors, increasingly optimistic, are positioned to drive a sustained rally.
The Shanghai Composite Index could see upside towards the 4,000 and then 4,500-level in the coming years, if the rally continues. Our conviction rests on improving domestic fundamentals, policy tailwinds, and powerful market sentiment unique to mainland China's equity landscape.
Caution is important, given the volatility nature of the index.
The forecasts provided herein are intended for informational purposes only and should not be construed as guarantees of future performance. This is an example only to enhance a consumer's understanding of the strategy being described above and is not to be taken as Blueberry Markets providing personal advice.
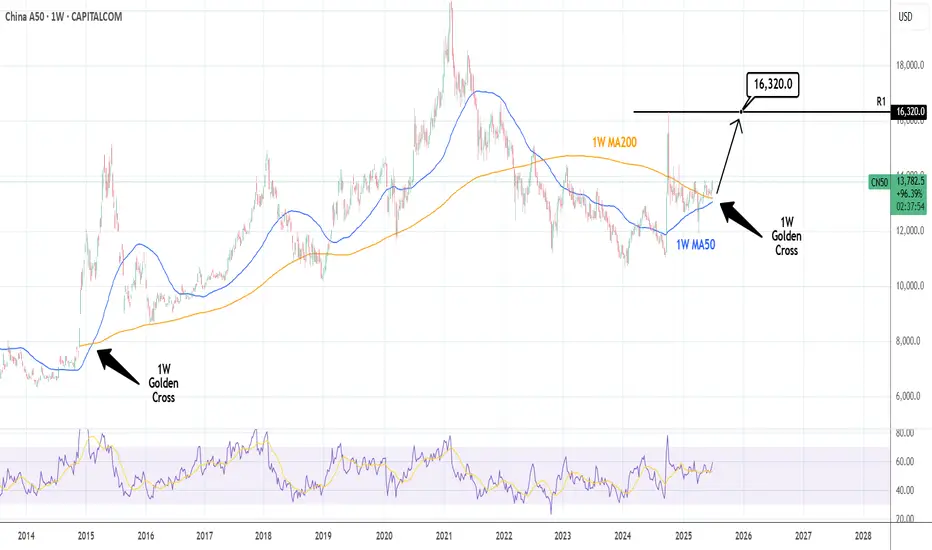
CHINA A50: 1st 1W Golden Cross in 10 years.China A50 is close to making the first 1W Golden Cross in 10 years and the set up couldn't be more bullish after a consolidation of almost a year. The index is far off its ATH but still this Golden Cross can easily make it test the R1 level. Long, TP = 16,320.
## If you like our free content follow our profile to get more daily ideas. ##
## Comments and likes are greatly appreciated. ##
BYD: Heading for the Low!BYD remains on a downward trajectory, with the current leg expected to carve out the low of magenta wave while staying above key support at HK$111. Under our primary scenario, this level should trigger a strong upward reversal, which should set the stage for the completion of the broader green wave . Only after this upside move do we expect a deeper correction, which should eventually break through support at HK$111 and HK$67.60 to form the low of green wave . That said, we can’t rule out an earlier breakdown. There’s a 33% probability that the high of green wave alt. is already in. In this case, the price could breach support sooner, suggesting the low of wave alt. may form ahead of schedule.
📈 Over 190 precise analyses, clear entry points, and defined Target Zones - that's what we do.

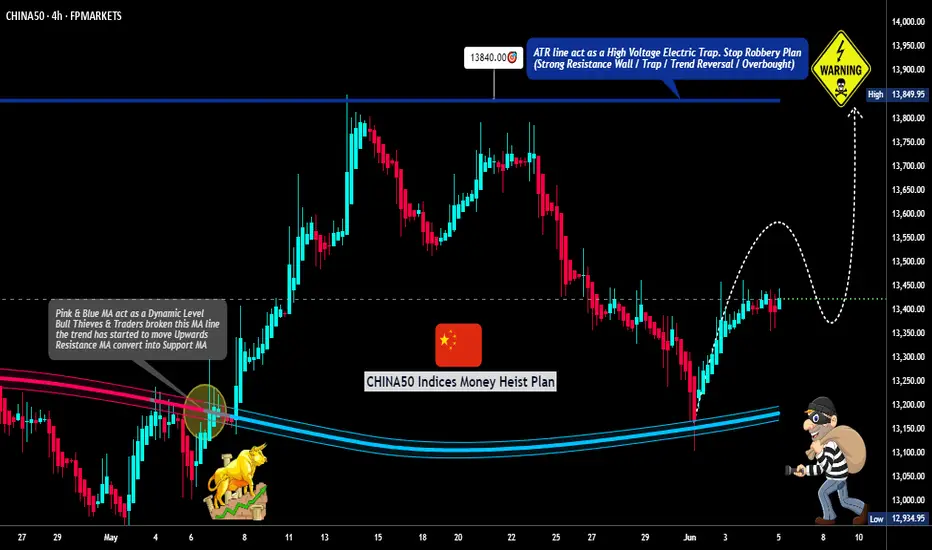
"CHINA50 Money Heist: Will You Join the Gang or Get Robbed?"🚨 CHINA50 HEIST ALERT: Bullish Loot & Trap Escape Plan! 🚨
🌟 Hi! Hola! Ola! Bonjour! Hallo! Marhaba! 🌟
Dear Money Makers & Market Robbers, 🤑💰💸✈️
Based on 🔥Thief Trading Style🔥 (technical + fundamental analysis), we’re plotting the ultimate heist on the CHINA50 Index Cash market! Our master plan focuses on a long entry—targeting the high-risk Red Zone (overbought, consolidation, potential reversal). Beware: Bears are lurking, and traps are set! 🏆💸 Book profits fast, stay wealthy, and trade safe! 💪🎉
🔓 ENTRY: The Vault Is Open – Swipe the Bullish Loot!
Buy Limit Orders: Place within 15-30min (recent swing low/high).
Alert Recommended! Don’t miss the heist.
🛑 STOP LOSS: Escape Route
Set near the latest swing low or below 4H MA (~13150.00).
Adjust based on risk, lot size, and multiple orders.
🎯 TARGET: 13840.00 (or Run Before It Hits!)
Scalpers: Only long-side plays! Use trailing SL to lock profits.
Swing Traders: Execute the robbery plan patiently.
📡 MARKET INTEL: Why CHINA50 is a Bullish Target
Fundamental Drivers: Macro trends, COT data, geopolitics, sentiment.
Intermarket & Index-Specific Factors in play.
👉 For full analysis, check the linkss below! 🔗🔗
⚠️ TRADING ALERTS: News & Position Safety
Avoid new trades during high-impact news.
Trailing SL is a MUST to protect profits.
💥 BOOST THE HEIST! Hit Like & Follow!
Support the plan → More profits → Easier robberies! 💰🚀
Stay tuned for the next heist! 🤑🐱👤🤩
Tencent: Searching for Wave A’s LowTencent’s corrective A-B-C structure is struggling to finish wave A. Our primary scenario calls for a drop toward support at HK$364.80, where wave A should bottom. That should open the door for wave B, followed by a deeper leg down in wave C—into the magenta Long Target Zone between HK$325.60 and HK$229.00. This zone should mark the completion of wave (2), setting up a long-term bullish reversal in wave (3), which may eventually target resistance at HK$715. However, if price breaks below HK$188.60, our wave alt. scenario will take over (36% probability), signaling an even deeper low before the next bullish impulse.
📈 Over 190 precise analyses, clear entry points, and defined Target Zones - that's what we do.

Alibaba: Intermediate Correction in ProgressAs Alibaba has remained below resistance at $121.28, we’ve ultimately chosen to consider the high of orange wave x as established. Thus, we currently place the stock in bearish wave y, which should conclude the corrective structure of the larger blue wave (ii). From that point, BABA should reverse, climb back above the $121.28 resistance, and move to significantly higher levels—initially completing blue wave (iii), and eventually the larger turquoise wave 3. However, there’s still a 34% chance that our bearish alternate scenario will play out. In that case, the stock would fall between the two support levels at $80.05 and $58.01, where the low of turquoise wave alt.2 would form.
📈 Over 190 precise analyses, clear entry points, and defined Target Zones - that's what we do.

Fasten your seatbelts - China Southern Airlines to fly higherChina’s recent decision to grant visa-free entry to citizens of four Gulf Cooperation Council (GCC) countries—Saudi Arabia, Oman, Kuwait, and Bahrain—from June 9, 2025, is expected to significantly boost travel demand between China and the Gulf region.
Key benefits for China Southern Airlines:
> Increased passenger traffic from GCC countries for tourism, business, and cultural exchange.
> Opportunity to expand direct flight routes to major Gulf cities, enhancing its international network.
> Stronger hub positioning for cities like Guangzhou and Urumqi as gateways for Middle East–Asia connectivity.
> Improved load factors and revenue from both inbound and outbound travel, especially during peak seasons.
This policy complements earlier agreements with the UAE and Qatar, which already enjoy 30-day visa-free access, effectively making all GCC nations visa-exempt for short-term visits to China
Basis review of monthly chart, price has potential to retest level of 5.70 which is 46% upside from current level of 3.90. Price needs to breach the overhead resistance of 4 and sustain above it for multiple days for the upside momentum to kick in. However, this view is negated if price breaks below 3.20 level.

Alibaba - This was just the obvious bottom!Alibaba - NYSE:BABA - will head much higher:
(click chart above to see the in depth analysis👆🏻)
Ever since Alibaba actually retested the previous all time low in 2022, we have been able to see the textbook creation of a rounding bottom formation. Even the recent break and retest was perfectly playing out and if Alibaba confirmes the potental breakout, a rally of +50% will most likely follow.
Levels to watch: $140, $220
Keep your long term vision!
Philip (BasicTrading)

NetEase: Upward Surge!NTES generated a strong upward impulse, surging nearly 15% higher, including a gap-up. This brought the stock noticeably closer to the high of the green wave , which should ideally form just below the resistance at $134.44. After this peak, we anticipate significant sell-offs down to the $53.09 support level, where the beige wave II should conclude. Since a sustainable uptrend should follow this low, we have highlighted a magenta Target Zone (coordinates: $59.67 – $27.95), which is suitable for long entries. Once the zone is completed, the price should reach levels above the resistance at $134.44 during the subordinate green wave . This mark also plays a role in our alternative scenario (probability: 38%). If the price rises above the $134.44 resistance without previously reaching the Target Zone, we will have to consider an alternative corrective wave structure, with the price currently in the green wave alt. .
📈 Over 190 precise analyses, clear entry points, and defined Target Zones - that's what we do.

"CHINA50" Index CFD Market Bullish Heist Plan (Day or Swing)🌟Hi! Hola! Ola! Bonjour! Hallo! Marhaba!🌟
Dear Money Makers & Robbers, 🤑 💰💸✈️
Based on 🔥Thief Trading style technical and fundamental analysis🔥, here is our master plan to heist the "CHINA50" Index CFD Market. Please adhere to the strategy I've outlined in the chart, which emphasizes long entry. Our aim is the high-risk ATR Line. Risky level, overbought market, consolidation, trend reversal, trap at the level where traders and bearish robbers are stronger. 🏆💸"Take profit and treat yourself, traders. You deserve it!💪🏆🎉
Entry 📈 : "The heist is on! Wait for the MA breakout (13300) then make your move - Bullish profits await!"
however I advise to Place Buy stop orders above the Moving average (or) Place buy limit orders within a 15 or 30 minute timeframe most recent or swing, low or high level.
📌I strongly advise you to set an "alert (Alarm)" on your chart so you can see when the breakout entry occurs.
Stop Loss 🛑: "🔊 Yo, listen up! 🗣️ If you're lookin' to get in on a buy stop order, don't even think about settin' that stop loss till after the breakout 🚀. You feel me? Now, if you're smart, you'll place that stop loss where I told you to 📍, but if you're a rebel, you can put it wherever you like 🤪 - just don't say I didn't warn you ⚠️. You're playin' with fire 🔥, and it's your risk, not mine 👊."
📍 Thief SL placed at the nearest/swing low level Using the 4H timeframe (13000) Day / Swing trade basis.
📍 SL is based on your risk of the trade, lot size and how many multiple orders you have to take.
🏴☠️Target 🎯: 13800 (or) Escape Before the Target
🧲Scalpers, take note 👀 : only scalp on the Long side. If you have a lot of money, you can go straight away; if not, you can join swing traders and carry out the robbery plan. Use trailing SL to safeguard your money 💰.
💰💵💸"CHINA50" Index Market Heist Plan (Swing/Day Trade) is currently experiencing a Bullish trend.., driven by several key factors.☝☝☝
📰🗞️Get & Read the Fundamental, Macro, COT Report, Geopolitical and News Analysis, Sentimental Outlook, Intermarket Analysis, Index-Specific Analysis, Future trend targets with Overall outlook score... go ahead to check 👉👉👉🔗🔗
⚠️Trading Alert : News Releases and Position Management 📰 🗞️ 🚫🚏
As a reminder, news releases can have a significant impact on market prices and volatility. To minimize potential losses and protect your running positions,
we recommend the following:
Avoid taking new trades during news releases
Use trailing stop-loss orders to protect your running positions and lock in profits
💖Supporting our robbery plan 💥Hit the Boost Button💥 will enable us to effortlessly make and steal money 💰💵. Boost the strength of our robbery team. Every day in this market make money with ease by using the Thief Trading Style.🏆💪🤝❤️🎉🚀
I'll see you soon with another heist plan, so stay tuned 🤑🐱👤🤗🤩

Phantom Heist: Sniping CHINA50 Longs for Epic Loot!🌍 Salutations, worldly wealth seekers! Ola! ✨
Dear Coin Conquerors & Chart Corsairs, 💸⚔️
Crafted in the 🔥 Phantom Trader’s cauldron of technical wizardry and fundamental finesse 🔥, behold our cunning plot to pillage the “CHINA50” Index Market. Follow the chart’s secret map, zeroing in on long entries. Our prize? Slip away near the treacherous ATR Red Zone, where overbought whispers, consolidation, reversals, and ambushes lurk, with bearish bandits poised to strike. 🦹♂️💰 “Secure your loot and treat yourself, traders—you’re a force to be reckoned with!” 🎊💥
**Entry 📊**: The vault’s cracked open! Seize the bullish bounty at current prices—the heist is on!
For precision strikes, set buy limit orders on a 15 or 30-minute chart at the latest swing low or high. Pro move: activate chart alerts to stay ahead of the game!
**Stop Loss 🛑**:
📍 Phantom SL planted at the recent swing low on the 8H timeframe (13500.00) for day or swing trades.
📍 Tweak SL to match your risk appetite, lot size, and open orders.
**Target 🎯**: Eye 14350.00—or vanish early if the market gets slippery!
🧨 **Scalpers, keep your wits!** 👁️: Stick to long-side scalps. Deep pockets? Dive in now! Lighter funds? Join swing traders for the caper. Use trailing SL to protect your treasure 💎.
💴 **CHINA50 Market Raid (Swing Trade Snapshot)**: Hovering in neutral territory with a bullish flicker, fueled by pivotal market tides. ☝
📰 **Uncover the full story**: Dive into Fundamental Signals, Macro Trends, COT Insights, Geopolitical Waves, Sentiment Cues, Intermarket Links, Index Drivers, Positioning, and Future Targets for the complete intel! 👉🔗🌎
⚠️ **Trade Warning: News & Position Strategy** 🗳️🚨
Market-moving news can stir chaos like a storm. Safeguard your gains:
- Avoid new trades during news drops.
- Use trailing stop-losses to lock profits and defend open positions.
💪 **Fuel our plunder!** 💥 Hit the Boost Button 💥 to supercharge our profit-grabbing game. Join the Phantom Trading Style crew and stack riches daily with flair. 🏅🤝🚀
Rendezvous at the next market ambush—stay sharp! 🤑🐆🎯

XPEV: Setting Up for a Breakout
Consistent high/mid double-digit quarterly sales and earnings growth, along with high annual EPS growth estimates.
Weekly volume indicates substantial institutional accumulation.
Price has been tightening around the 10-week moving average on decreasing volume, with tight weekly closes (a good sign of accumulation)
As long as the price holds above the April 21 lows, I anticipate at least a mid-term bounce in the coming weeks. Or, potentially, a start of a new macro uptrend to retest 2021 highs.
Thank you for your attention and I wish you successful trading decisions!

Alibaba - This Chart Speaks In Money!Alibaba ( NYSE:BABA ) prepares for a significant pump:
Click chart above to see the detailed analysis👆🏻
Basically since Alibaba was listed on the NYSE, it always perfectly respected market structure. With the recent rejection away from the key neckline, Alibaba is now creating a bullish break and retest. After bullish confirmation, this forms a bottom and we might see new all time highs.
Levels to watch: $110, $140
Keep your long term vision,
Philip (BasicTrading)

Miniso: Holding SteadyMNSO showed little volatility last week, recording only minor single-digit percentage pullbacks. Still, we expect further downside ahead. As the decline continues, the stock should reach the green Target Zone between $9.90 and $7.33. Within that range, we anticipate the low of the green wave . This bottom should then set the stage for a new upward move, which should eventually break above the resistance at $35.22 via a turquoise five-wave structure.

SSE Composite Index CorrectionThe SSE Composite Index, the primary index of the Shanghai Stock Exchange, reflects the performance of diverse companies across various industries and serves as a gauge of China’s economy. It is calculated based on the market value and stock prices of these companies.
According to daily Cash Data (1D), the SSE Index, after a 36% rise from September 18 to 30, 2024, entered a corrective phase that has lasted about 4 months.
Based on the time and price similarity of the waves, it appears the correction is forming a diametric pattern. Wave (e) is likely complete, and wave (f) has begun. Wave (g) may end at 3,138 or 2,945, though the completion of wave (f) will allow a more precise prediction of wave (g) endpoint.
This diametric pattern will likely take another 2 to 3 months to complete..

what's next after historic plunged? what's next after historic plunged?
HSI needs to claw its way back - resistance now takes the spotlight!
🚨🚨🚨
🔎🎯 Always ask before you open a position, what's your time frame!?
Follow this principle for your trade for entry and exit so you will not lost on that particular trade. Happy trading everyone! 💰
From previous posts:-
MACD - Deadcross formed 20/3/2025 on D Chart.
4H chart:
at point of writing ✍️: the Index uptrend mode is broken where we have been reviewing the movement of the Index.
For this week trade plan: Most likely short the index for days to few weeks until get confirmation of reversal back to uptrend.
For swing trade: Buy into support Sell at resistance.
Set your TP/SL & protect your capital.
PEPPERSTONE:HK50
On 7Apr25 - special Monday, HSI dropped 13.22% ; 3021.51pts to close at 19828.30. The Index below its 20MA@22814 (currently); 50MA@22509 (currently)
This is the historic largest single day plunge since 1997 Asian Financial Crisis.
Historically, the HSI has experienced significant single-day drops during major financial crises. For instance, that was on October 28, 2008, amid the global financial crisis, the HSI fell by 12.7%, marking its biggest single-day percentage drop since 1997.
Well, human beings shape history. While it may not repeat the same way, but often returns in similar forms and familiar contexts. We are the innovative and creativity creatures on this earth, hence we are free to craft the stories eventually become history.
PEPPERSTONE:HK50
currently the 20MA:22581; 50MA:22423
🚨 as of ✍️ :
🗝️ Resistance : 20632
Resistance Level : 20143 20266
Support Level : 18830 19450
🗝️ Support : 18751
W Chart:- HSI continues its Bullish mode with strong pullback! Recovery could expected to see in end Jun - early Jul'25.
17Mar2025 -
24Mar2025 -
7Apr2025 -
For current markets condition, the CHN & HKG can be volatile with the continuing noise from tariff.
🎯 Reminder: For long term (6-18 months) continue to accumulate China & HKG for the potential upside for the year! All retracement is a good entry point.
🔎 DYODD and don't listen to anyone. Invest in yourself, do some study and learn along the way while you trying to verify or finding the answer if to start invest in CHN/HKG markets. If you don't know how or where, you may ask Deepseek/Chatgpt for most reputable Trading courses nearest to you.
Let's follow our own zentradingstrategy , continue to trade and zen with 📙 and 🍵 for profits.
** Please Boost 🚀/LIKE 👍, FOLLOW ✅, SHARE 🙌 and COMMENT ✍ if you enjoy this idea! Share your trading journey to encourage trading and investment buddies.

Tencent: Significant Decline!Tencent's stock took a significant hit, creating a noticeable gap in the chart. Nevertheless, for now, our primary assumption remains that the price is currently working on the turquoise wave 3 and will soon move toward the resistance at HK$715. Afterward, a corrective movement should follow during wave 4. However, if the stock falls below the support at HK$364.80, downward pressure will mount significantly and make it increasingly likely that the price will drop to new lows below the nearest marks at HK$261 and HK$188.60 to develop a new low of the large wave alt. in green (probability: 36%).

"CHINA 50" Index CFD Market Heist Plan (Scalping/Day Trade)🌟Hi! Hola! Ola! Bonjour! Hallo! Marhaba!🌟
Dear Money Makers & Robbers, 🤑💰✈️
Based on 🔥Thief Trading style technical and fundamental analysis🔥, here is our master plan to heist the "CHINA 50" Index CFD Market. Please adhere to the strategy I've outlined in the chart, which emphasizes short entry. Our aim is the high-risk Green Zone. Risky level, oversold market, consolidation, trend reversal, trap at the level where traders and bullish robbers are stronger. 🏆💸Book Profits Be wealthy and safe trade.💪🏆🎉
Entry 📈 : "The vault is wide open! Swipe the Bearish loot at any price - the heist is on!
however I advise to Place sell limit orders within a 15 or 30 minute timeframe most nearest or swing, low or high level.
Stop Loss 🛑: (13400) Thief SL placed at the nearest / swing high level Using the 8H timeframe swing / day trade basis.
SL is based on your risk of the trade, lot size and how many multiple orders you have to take.
Target 🎯: 12950 (or) Escape Before the Target
🧲Scalpers, take note 👀 : only scalp on the Short side. If you have a lot of money, you can go straight away; if not, you can join swing traders and carry out the robbery plan. Use trailing SL to safeguard your money 💰.
"CHINA 50" Index CFD Market Heist Plan (Swing/Day) is currently experiencing a bearishness,., driven by several key factors.
📰🗞️Get & Read the Fundamental, Macro Economics, COT Report, Geopolitical and News Analysis, Sentimental Outlook, Intermarket Analysis, Index-Specific Analysis, Positioning and future trend targets... go ahead to check 👉👉👉🔗
⚠️Trading Alert : News Releases and Position Management 📰 🗞️ 🚫🚏
As a reminder, news releases can have a significant impact on market prices and volatility. To minimize potential losses and protect your running positions,
we recommend the following:
Avoid taking new trades during news releases
Use trailing stop-loss orders to protect your running positions and lock in profits
💖Supporting our robbery plan 💥Hit the Boost Button💥 will enable us to effortlessly make and steal money 💰💵. Boost the strength of our robbery team. Every day in this market make money with ease by using the Thief Trading Style.🏆💪🤝❤️🎉🚀
I'll see you soon with another heist plan, so stay tuned 🤑🐱👤🤗🤩

ChinaH Index – Mid-Term Technical OutlookThe ChinaH Index is currently trading at $8,390, after recently rejecting the key resistance level of $9,200, a historically significant zone last tested in 2021. Despite this rejection, the index remains well-positioned within a strong and intact bullish channel, signaling long-term upward momentum.
Current Setup:
We are now observing a short-term relief bounce from $8,390, with potential to retest the $8,700 area. This move is part of a broader technical structure that suggests a healthy pullback phase before resuming long-term growth.
Pullback Scenario:
Following the potential retest of $8,700, the index may enter a correction phase, targeting $7,600 as a core support level—this zone previously acted as resistance in 2022 and is likely to serve as strong structural support heading into mid-2025.
Before reaching $7,600, the first interim support sits at $8,200, a level that previously served as support in 2020 and triggered the recent bounce. If $8,200 fails to hold during the retracement, a deeper correction toward $7,600 would allow for stronger consolidation and improved structural health within the overall bullish channel.
Two Potential Bullish Scenarios After Pullback:
Continuation within the Current Bullish Channel:
A bounce from $7,600 would resume upward momentum.
Primary upside target: $9,700 – a key multi-year resistance zone from 2017–2020.
A clean breakout above $9,700 would confirm a long-term bullish breakout and shift market sentiment decisively.
Formation of a New Bullish Channel:
In the event of prolonged consolidation, price could range between $7,100–$8,700 from September to December 2025.
A breakout in January 2026 would confirm a new ascending structure, offering a refreshed bullish path with long-term upside.
Key Levels to Watch:
Resistance: $8,700 → $9,200 → $9,700 (Major Breakout Zone)
Support: $8,200 → $7,600 → $7,100 (Range Floor if prolonged consolidation)
Summary:
While short-term pullbacks may test market resilience, the underlying bullish structure remains intact. A correction to $7,600 could act as a launchpad for the next major leg higher. Whether through continuation in the current channel or the formation of a new one, the ChinaH Index presents multiple bullish pathways, with $9,700 being the key level that could signal a long-term shift in trend.
Patience and disciplined positioning in the upcoming months will be crucial as we watch for confirmation of the next directional move.

Tencent Holdings LtdIs Tencent Stock a Buy Now?
Tencent posted its third quarter earnings report on Nov. 16. The Chinese tech giant's revenue fell 2% year over year to 140.1 billion yuan ($19.8 billion), which represented its second consecutive quarter of declining revenue since its IPO in 2004. Its net profit rose 1% to 39.9 billion yuan ($5.6 billion). On an adjusted basis, which excludes its investments and other one-time items, its net profit grew 2% to 32.3 billion yuan ($4.5 billion). Those growth rates seem anemic, but Tencent's stock had already been cut in half over the past two years amid concerns about China's tightening regulations, slowing economic growth, and COVID19 lockdowns. So is it the right time to take the contrarian view and buy Tencent as a turnaround play? Let's review its core businesses and valuations to decide.
Tencent generated 31% of its third quarter revenue from its video game business. Domestic games, which include its blockbuster game Honor of Kings, accounted for 73% of that total. The remaining 27% came from overseas hits like League of Legends, Valorant, and PUBG Mobile.Its domestic gaming revenue fell 7% year over year, representing its third consecutive quarter of shrinking revenue, as it grappled with tighter playtime restrictions for minors in China over the past year. Those restrictions also coincided with a temporary suspension on new video game approvals in China, which started last July and ended this April.Its international gaming revenue rose 3% year over year, accelerating from its 1% decline in the second quarter, as new games like Tower of Fantasy and Goddess of Victory: Nikke attracted new players. Unfortunately, its overseas growth still couldn't offset its declining domestic revenue.
As a result, Tencent's total VAS (value-added service) revenue which includes its gaming divisions, social media platforms, and streaming media subscriptions -- declined by 3% in the third quarter but still accounted for more than half of its top line. This core business might gradually stabilize as Tencent expands its international gaming business, but it will likely remain under intense pressure as long as the Chinese government continues to scrutinize the gaming industry.
200$ was one of the biggest support and great opportunity to buying the dip. 300-320$ is a big resistance level for tencent and if bulls win that battle then 350$ is next but
can we back 250 or even 200$ again? YES

Baidu Inc. (BIDU) 1WTechnical Analysis 1W
A breakout from the "falling wedge" could signal potential upside.
Key levels:
-Support: 94.26 | 77.24
-Resistance: 107.61 | 116.99 | 156.75
Fundamental Analysis
-AI Leadership: Baidu continues expanding in AI, cloud computing, and autonomous driving.
-Financials: Solid revenue growth but faces regulatory risks in China.
-Competition: Strong rivalry with Alibaba and Tencent in AI and cloud services.
-Risks: U.S.-China tensions and economic slowdown may impact performance.
A breakout above $116.99 could confirm further upside.
