H5 Trade of the Week! 21% UpsideNASDAQ:BIDU Swing Trade is Primed!
In this video, I'll give you:
- Full Trade Idea
- Entry & S/L
- Options Taken
- Profit Targets
Check it out!
Not financial advice
Chinastocks

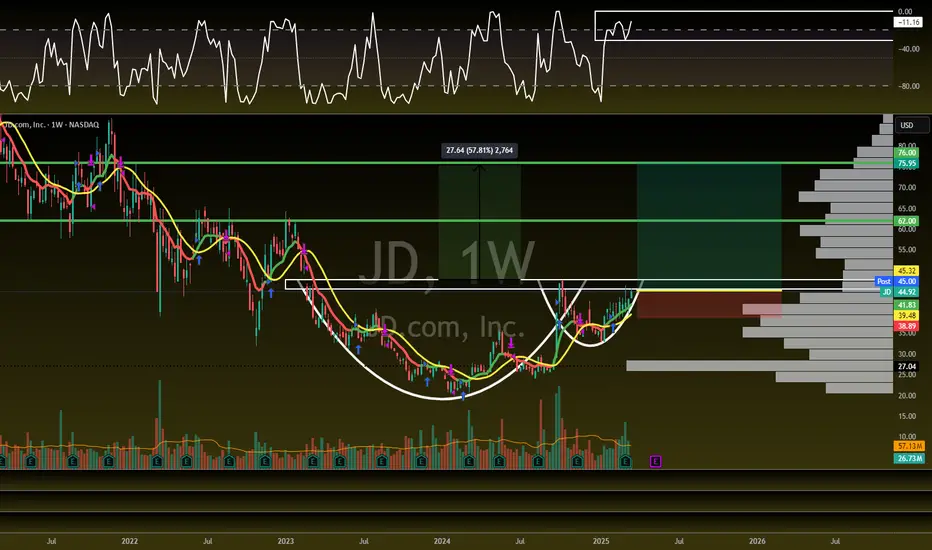
China Trade Setup with 67% Upside!NASDAQ:JD - H5_W Trade Setup: 🚨
CupnHandle Breakout =
🎯$62
📏MM: $76
- Multi Year CupnHandle
- Green H5_W
- Volume Shelf with GAP
- Thriving WCB
- China is HOT!
Not financial advice
A NEW China Name just getting Started! 80% UpsideNASDAQ:BIDU - H5_W Trade Setup: 🚨
Breakout = 🎯$155 - 50% Higher 🚀
- Double Bottom
- WCB Forming
- H5_W is Green
- Volume Shelf
- China is Bullish
Not financial advice

BABA: Swing Trade Setup with 14% Upside🚨Swing Trade Setup: NYSE:BABA
Breakout = 🎯$162
Entry: $142.20
S/L: $135.65 (3to1 R/R)
Target: $162 (14% Higher)
NOT FINANCIAL ADVICE

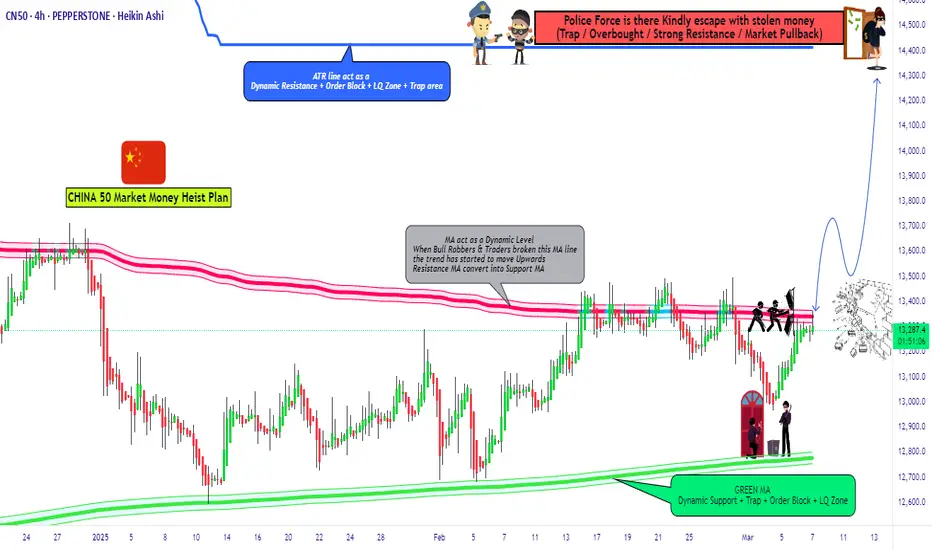
CHINA 50 Index Cash Market Bullish Heist Plan🌟Hi! Hola! Ola! Bonjour! Hallo! Marhaba!🌟
Dear Money Makers & Robbers, 🤑 💰💸✈️
Based on 🔥Thief Trading style technical and fundamental analysis🔥, here is our master plan to heist the "CHINA 50 Index Cash" market. Please adhere to the strategy I've outlined in the chart, which emphasizes long entry. Our aim is the high-risk Red Zone. Risky level, overbought market, consolidation, trend reversal, trap at the level where traders and bearish robbers are stronger. 🏆💸Book Profits Be wealthy and safe trade.💪🏆🎉
Entry 📈 : "The vault is wide open! Swipe the Bullish loot at any price - the heist is on!
however I advise to Place buy limit orders within a 15 or 30 minute timeframe most recent or swing, low or high level. I Highly recommended you to put alert in your chart.
Stop Loss 🛑:
Thief SL placed at the recent / nearest low level Using the 4H timeframe (13100) swing trade basis.
SL is based on your risk of the trade, lot size and how many multiple orders you have to take.
Target 🎯: 14400 (or) Escape Before the Target
🧲Scalpers, take note 👀 : only scalp on the Long side. If you have a lot of money, you can go straight away; if not, you can join swing traders and carry out the robbery plan. Use trailing SL to safeguard your money 💰.
"CHINA 50 Index Cash" Market is currently experiencing a Neutral trend to Bearish., driven by several key factors.
📰🗞️Read the Fundamental, Macro Economics, COT Report, Seasonal Factors, Intermarket Analysis, Sentimental Outlook, Future trend predict.
Before start the heist plan read it.👉👉👉
📌Keep in mind that these factors can change rapidly, and it's essential to stay up-to-date with market developments and adjust your analysis accordingly.
⚠️Trading Alert : News Releases and Position Management 📰 🗞️ 🚫🚏
As a reminder, news releases can have a significant impact on market prices and volatility. To minimize potential losses and protect your running positions,
we recommend the following:
Avoid taking new trades during news releases
Use trailing stop-loss orders to protect your running positions and lock in profits
💖Supporting our robbery plan 💥Hit the Boost Button💥 will enable us to effortlessly make and steal money 💰💵. Boost the strength of our robbery team. Every day in this market make money with ease by using the Thief Trading Style.🏆💪🤝❤️🎉🚀
I'll see you soon with another heist plan, so stay tuned 🤑🐱👤🤗🤩

HK50; Heikin Ashi Trade IdeaPEPPERSTONE:HK50
In this video, I’ll be sharing my analysis of HK50, using my unique Heikin Ashi strategy. I’ll walk you through the reasoning behind my trade setup and highlight key areas where I’m anticipating potential opportunities.
I’m always happy to receive any feedback.
Like, share and comment! ❤️
Thank you for watching my videos! 🙏

CHINA FIN MARKETS | Investing in China & AIChina's market resurgence might pose some great opportunities for investors, especially after a long bearish cycle for the global Chinese financial markets.
February 2025 saw a significant shake-up in global markets, with China emerging as a key player driving investor sentiment. The MSCI China Index surged by 11.2% for the month, vastly outperforming the MSCI US Index:
One of the biggest catalysts behind China’s recent rally has been its advancements in Artificial Intelligence (DeepSeekAI being one of the key drivers).
By operating at a fraction of the cost of their US counterparts, such as OpenAI and Meta, DeepSeek's competitive advantage has given China an edge in the AI space, which can be seen in the market confidence.
XIAOMI has been one of the top gainers, largely as they are expanding their market penetration:
Chinese markets in February saw a boost when President Xi Jinping was warmly received by tech industry leaders. A handshake between Xi and Alibaba’s Jack Ma who previously stepped back from the public eye following regulatory crackdowns, was seen as a major gesture of reconciliation between the government and the private sector. This renewed support for private enterprises.
China’s long-term strategy has been paying dividends in high-tech industries. China has increased its global market share in nearly all industries and is outperforming competitors in cost-efficiency, particularly in sectors like copper smelting.
Despite recent gains, China’s stock market has yet to fully recover from its underperformance over the past decade. While the MSCI China Index has risen 34.6% over the past year, long-term returns still lag behind global markets. A US$100 investment in an MSCI World Index tracker in 2010 would have grown to US$480 by early 2024, whereas the same amount invested in an MSCI China Index fund would have only reached US$175.
China’s resurgence has brought a renewed sense of optimism, but investors remain cautious. While AI advancements and low cost of labor have positioned China as a competitive force, historical challenges like regulatory intervention, tariffs and economic instability still loom.
_________________________

ChinaH Index: New Era of Economic Power and Market DominanceIn the current global economic shift, China is emerging as the leading force across multiple sectors, including economy, corporations, artificial intelligence, quantum technologies, and international alliances. With the U.S. facing economic struggles, including growing national debt, loss of investor confidence, and strained alliances, China is solidifying its position as the world's dominant economic power.
At $8,900, the ChinaH Index is in a strong bullish channel, following an impressive 34% rally from $6,700 on January 11 to its current level. Moving forward, there are two key scenarios that could play out:
Scenario 1: Healthy Pullback Before Resuming Growth
After reaching $9,000, the index could experience a natural correction to $7,600, allowing for a stronger consolidation phase.
This level would provide a solid base for the next bullish breakout, targeting $10,000 by mid-2025.
Scenario 2: Market Overextension and Historical Price Repetition
If the bullish momentum overextends, we could see a push toward $9,400–$9,800, representing a 44% rise, similar to past price movements.
The $9,700 level is a historically significant support zone from 2017–2020, making it a critical battleground for further gains.
A successful break above this level could send the index soaring toward $10,000 by July 2025, further reinforcing China’s dominance in the new global order.
Key Levels to Watch
$8,000 Support → A strong base in the new world economy. If it holds, further upside is likely.
$9,700 Resistance → A critical level from 2017–2020, which, if broken, confirms a long-term bullish shift.
$10,000 Target → A key psychological and technical milestone expected by mid-2025.
Conclusion: The ChinaH Index Reflects China’s Growing Global Influence
With shifting global economic dynamics favoring China, the ChinaH Index is positioned for long-term growth. If $8,000 holds, a breakout beyond $9,700 could confirm China’s continued financial dominance, leading to a potential target of $10,000 by July 2025. The next few months will be crucial in determining whether the market corrects before resuming its bullish trajectory or pushes straight toward new highs.

CN50 / CHINA50 Indices CFD Market Heist Plan🌟Hi! Hola! Ola! Bonjour! Hallo! Marhaba!🌟
Dear Money Makers & Thieves, 🤑 💰🐱👤✈️
Based on 🔥Thief Trading style technical and fundamental analysis🔥, here is our master plan to heist the CN50 / CHINA50 Indices CFD market. Please adhere to the strategy I've outlined in the chart, which emphasizes long entry. Our aim is the high-risk Red Zone. Risky level, overbought market, consolidation, trend reversal, trap at the level where traders and bearish robbers are stronger. 🏆💸Book Profits wealthy and safe trade.💪🏆🎉
Entry 📈 : "The heist is on! Wait for the MA breakout (13500) then make your move - Bullish profits await!"
however I advise to Place Buy stop orders above the Moving average (or) Place buy limit orders within a 15 or 30 minute timeframe most recent or swing, low or high level.
📌I strongly advise you to set an alert on your chart so you can see when the breakout entry occurs.
Stop Loss 🛑:
Thief SL placed at the recent/swing low or high level Using the 4H timeframe (13150) swing trade basis.
SL is based on your risk of the trade, lot size and how many multiple orders you have to take.
Target 🎯: 14400 (or) Escape Before the Target
🧲Scalpers, take note 👀 : only scalp on the Long side. If you have a lot of money, you can go straight away; if not, you can join swing traders and carry out the robbery plan. Use trailing SL to safeguard your money 💰.
📰🗞️Fundamental, Macro, COT Report, On Chain analysis, Sentimental Outlook etc....
CN50 / CHINA50 Indices CFD market is currently experiencing a Bearish to Bullish 🐃 trend,., driven by several key factors.
➤🔰 Fundamental Analysis
Fundamental factors assess the intrinsic drivers of the CHINA50:
Economic Growth:
China’s GDP growth is projected at 4.5% for 2025 (per IMF estimates), down from 4.9% in 2024, reflecting slower private consumption and export contributions—bearish signal.
Policy Support:
Aggressive fiscal stimulus (e.g., RMB 5tn local government debt quotas) and monetary easing (PBoC rate cuts to 3%) aim to counter deflation and boost sentiment—bullish counterweight.
Corporate Earnings:
A50 companies (e.g., Kweichow Moutai, CATL) show mixed results: consumer staples hold steady, but tech and industrials face margin pressure from tariffs—neutral to bearish.
Trade Environment:
Trump’s tariffs (25% on Mexico/Canada, 10% on China) reduce export competitiveness, though transshipments may mitigate impact—bearish short-term, neutral long-term.
Property Sector:
Stabilization efforts (e.g., debt restructuring) reduce drag, but residential investment remains weak—neutral, with upside potential.
Explanation: Fundamentals are mixed—stimulus supports the index, but slower growth and trade pressures weigh it down, suggesting cautious optimism.
➤🔰 Macroeconomic Factors
Macroeconomic conditions globally and domestically influence the CHINA50:
China:
Inflation at 1.5% (core), negative output gap (-0.5%)—subdued demand pressures growth—bearish.
PBoC easing and fiscal expansion (4% deficit) signal robust support—bullish offset.
U.S.:
Fed rates at 3-3.5%, PCE 2.6%—USD softening (DXY ~105) aids Chinese exports—bullish for CHINA50.
Tariffs disrupt trade flows—bearish short-term impact.
Eurozone:
PMI 46.2 (Eurostat)—stagnation reduces demand for Chinese goods—bearish.
ECB at 2.5% supports global liquidity—mildly bullish.
Global:
Japan 1%, emerging markets mixed—slow growth limits export recovery—bearish.
Oil at $70.44—stable costs, neutral for Chinese firms.
Explanation: Macro factors tilt bearish due to global slowdown and tariffs, but domestic stimulus and USD weakness provide a bullish buffer.
➤🔰 Commitments of Traders (COT) Data
COT data reflects futures positioning:
Speculators:
Net long ~30,000 contracts (down from 40,000 at 2025 peak)—cautious optimism, suggesting room for upside—bullish.
Hedgers:
Net short ~35,000 contracts—stable, profit-taking by producers—neutral.
Open Interest:
~70,000 contracts—steady interest indicates sustained market focus—neutral to bullish.
Explanation: COT shows a balanced market—not overbought, with speculators still favoring upside, supporting a bullish lean despite recent cooling.
➤🔰 Geopolitical and News Analysis
Geopolitical events and news impacting the CHINA50:
U.S.-China Trade Tensions:
Trump’s 10% tariff on Chinese imports (escalated from earlier threats) strains exports—bearish. China vows to “resolutely counter” (Reuters, Mar 7), hinting at retaliatory measures—mixed short-term volatility, bearish long-term if unresolved.
National People’s Congress (NPC):
“Two Sessions” (Mar 5-7) set a 5% GDP target, upped defense spending 7.2%, and issued RMB 1.3tn in special bonds (CNBC, Mar 6)—bullish domestic signal, but analysts doubt sufficiency against trade headwinds (SCMP, Mar 6).
Global South Appeal:
Foreign Minister Wang Yi positions China as a stable power amid U.S. “chaos” (Bloomberg, Mar 7)—bullish for investor confidence in emerging markets.
Property Sector:
Ongoing stabilization efforts noted at NPC—neutral, reducing systemic risk but not yet driving growth.
Explanation: Geopolitical tensions (tariffs) weigh heavily, but NPC stimulus and China’s global positioning provide bullish offsets, creating a volatile yet supported outlook.
➤🔰 Intermarket Analysis
Relationships with other markets:
USD/CNY:
At 7.20 (hypothetical)—weaker yuan vs. USD aids exports, bullish for CHINA50, though tariff impact mutes gains—mixed.
Hang Seng Index:
~20,000 (assumed)—strong correlation with CHINA50, reflects similar stimulus/tariff dynamics—neutral to bullish.
S&P 500:
~5,990—range-bound, neutral correlation; U.S. risk-off could lift CHINA50 via safe-haven flows—mildly bullish.
Commodities:
Oil $70.44, iron ore $100/ton—stable, neutral for Chinese industrials; gold $2,930 signals risk-off—bullish for China as a hedge market.
Bond Yields:
China 10-year 2.5% vs. U.S. 3.8%—yield gap supports capital inflows—bullish.
Explanation: Intermarket signals are mixed—USD/CNY and bonds favor CHINA50, but global equities and commodities suggest cautious stability.
➤🔰 Index-Specific Analysis
Factors unique to the CHINA50:
Technical Levels:
50-day SMA ~13,400, 200-day SMA ~12,800—price below 50-day but above 200-day signals consolidation—neutral.
Support at 13,200, resistance at 13,500—current price tests support.
Sector Composition:
Financials (40%), consumer goods (25%), tech (20%)—financials steady, tech hit by tariffs—mixed impact.
Volatility Index:
Implied volatility at 18%—moderate, suggesting ±200-point daily swings—neutral.
Market Breadth:
60% of A50 stocks above 200-day MA—broad participation, mildly bullish.
Explanation: Technicals and composition suggest a market in transition—neither strongly bullish nor bearish, with potential to swing based on catalysts.
➤🔰 Market Sentiment Analysis
Investor and trader mood:
Retail Sentiment:
55% short at 13,260 (trending on X)—contrarian upside potential—bullish signal.
Institutional:
Mixed—Morgan Stanley sees volatility, Goldman targets 14,000 by Q4 2025—neutral to bullish.
Corporate:
Firms hedge at 13,500-13,600—neutral, awaiting clarity on trade.
Explanation: Sentiment leans bearish short-term due to trade uncertainty, but retail shorts and institutional targets hint at bullish recovery potential.
➤🔰 Next Trend Move
Projected price movements:
Short-Term (1-2 Weeks):
Range: 13,200-13,500.
Dip to 13,200 if trade data disappoints; rebound to 13,500 if stimulus details emerge.
Medium-Term (1-3 Months):
Range: 13,000-14,000.
Below 13,200 targets 13,000; above 13,500 aims for 14,000, driven by policy clarity.
Catalysts: Trade balance, tariff developments, PBoC actions.
Explanation: The index is at a pivot—short-term downside risks from external pressures, medium-term upside from domestic support.
➤🔰 Overall Summary Outlook
CHINA50 at 13,260.00 balances bearish pressures (global slowdown, tariffs, post-rally correction) with bullish drivers (stimulus, USD softness, COT longs). Technicals suggest consolidation, sentiment is cautious but not panicked, and fundamentals favor long-term recovery. Short-term, a dip to 13,200 is likely, with medium-term upside to 14,000 if policy offsets trade headwinds.
➤🔰 Future Prediction
Bullish: 14,000-14,500 by Q3 2025 if stimulus scales up, tariffs soften, and global demand rebounds—60% probability.
Bearish: 12,800-13,000 if tariffs escalate, growth falters, or stimulus disappoints—40% probability.
Prediction: Bearish short-term to 13,200 (trade uncertainty), then bullish to 14,000 by mid-2025 (policy support prevails).
📌Keep in mind that these factors can change rapidly, and it's essential to stay up-to-date with market developments and adjust your analysis accordingly.
⚠️Trading Alert : News Releases and Position Management 📰 🗞️ 🚫🚏
As a reminder, news releases can have a significant impact on market prices and volatility. To minimize potential losses and protect your running positions,
we recommend the following:
Avoid taking new trades during news releases
Use trailing stop-loss orders to protect your running positions and lock in profits
💖Supporting our robbery plan 💥Hit the Boost Button💥 will enable us to effortlessly make and steal money 💰💵. Boost the strength of our robbery team. Every day in this market make money with ease by using the Thief Trading Style.🏆💪🤝❤️🎉🚀
I'll see you soon with another heist plan, so stay tuned 🤑🐱👤🤗🤩
oh wow, seems the Index has the wheel to run!Hello everyone! Happy Friday!
News📰 : anticipate more positive news to come (of course mixed with some -ve for retracement) 🔮
Look at the HSI D Chart
- posted 28Feb2025
- posted 3Mar2025
- 7March2025 at point of writing; the index trading above the support level of 23500 (the 28Feb2025 Hi); it tried to go back to uptrend channel and staying above! (broke on 28Feb2025).
Monitor the Trading volume: finance.yahoo.com
Avg past 3 months : 77.909Bn (+19.18% for the past avg vol); this imply the fund flow is abundance, hopefully this continues! Although the vol is slightly less than the last Oct 2024.
Look at the 4H chart
PEPPERSTONE:HK50
The HSI last Dec 2021 Hi @ 24385 is being tested again today!
Now, what's next? 25147, btw now and then Next level that we are looking at to break (oh wow! we need to add in past Higher Hi):
22840-22900
23241-23275-23314- 23471 (need to break above this level to change back to uptrend movement, else probably is gonna be sideways, continue to monitor and confirm)
23952-24101
24385
24586
24747
24800
25147
🚨 as of ✍️ :
Resistance : 24385 - 24586 - 24800. Let's monitor; this level is now being tested and see if breaks and staying above.
🗝️ support level
22750 -23535 (this level being tested few times; it's now became strong support level). Don't think this can easily broke down.
MACD - Goldencross was marked in Green (5Mar25)
KDJ - Remained at Bullish green zone since 4Mar25, the CFD is now in a short bullrun cycle.
BB - Still within lower BB channel and gap up trading at upper BB channel/
the Mid-line 4H chart at 22960-975 was corrected from 23320.
Trade Plan : 23477-24385 - 24751
Buy into support & Sell at resistance
the 1H showing it's now bullrun on the 2nd half of today. Ride on the waves and locked in your profits.
🚨🚨🚨 Locked your profits and watch out for reversal for retracement!
Monitor the 1H,4H movement with confirmation using MACD & KDJ indicator.
Set your tf, have your entry and exit plan!
Pay attention to the Goldencross/DeadCross; practice makes perfect.
Let's follow our own strategy and zen with 📙 and 🍵 for profits.
Happy Trading everyone!
🎯 Start to accumulate China & HKG for the potential upside for the year! All retracement is a good entry point.
🔎 DYODD and don't listen to anyone. Invest in yourself, do some study and learn along the way while you trying to verify or finding the answer if to start invest in CHN/HKG markets.
HKEX:2800 - 22.90-22.82 if it happens to retrace back to this level, otherwise anytime NOW is entry point! It's confirmed by the 200MA (above in W chart) ; also the W chart MACD GoldenCross. Cross-check it; if need helps let us know.
HKEX:2823 - 13.17-14.75 can start to open position and start accumulate, is allowed to wait for confirmation once it breaks 14.75 level. But you will be getting at higher cost...
HKEX:2801 - open position at price : 23.73-23.80 or anytime NOW! if ever retraced back to 23.36-23.66 accumulate more.
HKEX:3067 - open position now, add position when it retraced to 11.63,,11.33 or below. If you have missed, you may tk position still good to start at 11.85,11.99,12.15
** Please Boost 🚀/LIKE 👍, FOLLOW ✅, SHARE 🙌 and COMMENT ✍ if you enjoy this idea! Share your trading journey to encourage the trading buddies

is the Trumph speech boost the Index? n is Wednesday the humpdayHello everyone! How was yesterday trade? Hope everyone stick to the strategy set the SL/TP for your day trade.
News📰 : as expected and anticipate more positive news this week 🔮
www.tradingview.com
**China shares waver, HK bounces as Beijing vows more support for consumption, AI**
HSI +1.30% at this news published.😂
Look at the HSI D Chart
- posted 28Feb2025
at point of writing; the index closed below key support level of 22900-23000 (the strong level of 23000 which is the 10MA level, the uptrend is broken 28Feb25); as mentioned this level has been retest 3 times, let's continue to monitor.
However, today the Index open Hi. So trade ⚠ cautiously. Don't chase Hi.
Trading volume: finance.yahoo.com
Date Volume
Mar 3,2025 4,338,200,000
Feb 28, 2025 6,578,300,000
Feb 27, 2025 6,257,000,000
Feb 26, 2025 5,138,100,000
Feb 25, 2025 4,449,800,000
Monthly
Mar 1 2025 - 4,338,200,000 (as of todate)
Feb 1 2025 - 93,960,700,000 (+7.53% from prev month)_correction
Jan 1 2025 - 52,385,800,000
Dec 1 2024 - 56,349,200,000
Avg past 3 months : 77.909Bn (+19.18% for the past avg vol); this imply the fund flow is abundance, hopefully this continues! Although the vol is slightly less than the last Oct 2024.
Look at the 4H chart
PEPPERSTONE:HK50
The HSI last Oct Hi @ 23241 has been broken, this level could be the resistance level for the Index to break the next level Hi. The HK50 last Oct Hi @ 23258.
Now, what's next?
As updated:-
Next level that we are looking at to break:
20985
21336-21350
22020-22535, 22840-22900
23241-23275-23314- 23471 (need to break above this level to change back to uptrend movement, else probably is gonna be sideways)
23952-24101
24385
🚨 as of ✍️ :
it stays above 22535(retest 3 times and this might formed very strong support level).
🗝️ support level :
22990 broken :22340-22750 (this level being tested 3 times 17,20Feb & 4Mar; last tested at 22535.3)
MACD - Deadcross was marked in Green, continue to curving down (4h Chart)
KDJ - Reverse to Bullish green zone on 4Mar25; the CFD continue to trading the upwards trend till now.
BB - Still within lower BB channel and gap up trading at upper BB channel/
the Mid-line 4H chart at 22960-975 was corrected from 23320.
Trade Plan: might pullback to 23020 to fill the gap. Range : 23025-23258
Buy into support : 22880-22960(confirm with indicators)
Sell at resistance : 23150, 23190, 23372/400, 23454,23512(it soared to hit ,this morning)
Monitor the 1H,4H movement with confirmation using MACD & KDJ indicator.
Set your tf, have your entry and exit plan!
Pay attention to the Goldencross/DeadCross; practice makes perfect.
Let's follow our own strategy and zen with 📙 and 🍵 for profits.
Happy Trading everyone!
🎯 Start to accumulate China & HKG for the potential upside for the year! All retracement is a good entry point.
🔎 DYODD and don't listen to anyone. Invest in yourself, do some study and learn along the way while you trying to verify or finding the answer if to start invest in CHN/HKG markets.
HKEX:2800 - 22.90-22.82 if it happens to retrace back to this level, otherwise anytime NOW is entry point! It's confirmed by the 200MA (above in W chart) ; also the W chart MACD GoldenCross. Cross-check it; if need helps let us know.
HKEX:2823 - 13.17-14.75 can start to open position and start accumulate, is allowed to wait for confirmation once it breaks 14.75 level. But you will be getting at higher cost...
HKEX:2801 - open position at price : 23.73-23.80 or anytime NOW! if ever retraced back to 23.36-23.66 accumulate more.
HKEX:3067 - open position now, add position when it retraced to 11.63,,11.33 or below. If you have missed, you may tk position still good to start at 11.85,11.99,12.15
** Please Boost 🚀/LIKE 👍, FOLLOW ✅, SHARE 🙌 and COMMENT ✍ if you enjoy this idea or need help! *

Looks like HSI got a morning energy boost is not a Weakday!3/3/2025
Hello everyone! Happy Monday today is not a Weakday but a wonderful weekday start of the week 🫰 🫶
News📰 : this was from 28Feb2025
www.tradingview.com
N this is this morning 3Mar2025 - what do you think? I suspect more good news will come this week. 🔎🔮
www.tradingview.com
Look at the HSI D Chart
- posted 25Feb2025
- posted 26Feb2025
- posted 27Feb2025
- posted 28Feb2025
at point of ✍️; the index closed near the key support level of 22900-23000 (the strong level of 23000 which is the 10MA level); as mentioned this level has been retest 3 times, let's continue to monitor.
Trading volume: finance.yahoo.com
Date Volume
Feb 28, 2025 6,578,300,000
Feb 27, 2025 6,257,000,000
Feb 26, 2025 5,138,100,000
Feb 25, 2025 4,449,800,000
Feb 24, 2025 5,264,600,000
Monthly
Mar 1 2025 - 93,960,700,000 (+7.53% from prev month)
Feb 1 2025 - 87,382,400,000
Jan 1 2025 - 52,385,800,000
Dec 1 2024 - 56,349,200,000
Avg past 3 months : 77.909Bn (+19.18% for the past avg vol); this imply the fund flow is abundance, hopefully this continues! Although the vol is slightl less than the last Oct 2024.
Look at the 4H chart
PEPPERSTONE:HK50
The last Oct Hi @ 23241 has been broken, this level could be the resistance level for the Index to stay above for the next level.
Now, what's next?
As updated:-
Next level that we are looking at to break:23330, 23525, 23990, 24101, 24385.
🚨 as of ✍️ :it seems it stay above the key support level of 22990.
🗝️ support level : 23500 (broken) , 23175 (broken), 22990 (testing), 22741
MACD - last marked WAS deadcross and curving down as marked in YELLOW. After 8 bars-it reversed as marked in GREEN. and NOW it formed Deadcross again (as marked in YELLOW)
KDJ - Remained in bearish red zone with chance that it could reverse upwards.
BB - Still within lower BB channel and testing to break the BB mid-line for 4H chart at 23330.
Today Trade Plan: 22785-23504
Buy into support : 22900 ,23,005, 23169,23283 (confirm with the indicator if it's on the bullish zone)
Sell at resistance : 23400, 23353, 23335 (short/TP with shorter timeframe bearish zone, cross-check and wait for confirmation.)
Monitor the 1H,4H movement with confirmation using MACD & KDJ indicator.
Set your tf, have your entry and exit plan!
Pay attention to the Goldencross/DeadCross; practice makes perfect.
Let's follow our own strategy and zen with 📙 and 🍵.
Happy Trading everyone!
🎯 Start to accumulate China & HKG for the potential upside for the year! All retracement is a good entry point.
🔎 DYODD and don't listen to anyone. Invest in yourself, do some study and learn along the way while you trying to verify or finding the answer if to start invest in CHN/HKG markets.
HKEX:2800 - 22.90-22.82 if it happens to retrace back to this level, otherwise anytime NOW is entry point! It's confirmed by the 200MA (above in W chart) ; also the W chart MACD GoldenCross. Cross-check it; if need helps let us know.
HKEX:2823 - 13.17-14.75 can start to open position and start accumulate, is allowed to wait for confirmation once it breaks 14.75 level. But you will be getting at higher cost...
HKEX:2801 - open position at price : 23.73-23.80 or anytime NOW! if ever retraced back to 23.36-23.66 accumulate more.
HKEX:3067 - open position now, add position when it retraced to 11.63,,11.33 or below. If you have missed, you may tk position still good to start at 11.85,11.99,12.15
** Please Boost 🚀/LIKE 👍, FOLLOW ✅, SHARE 🙌 and COMMENT ✍ if you enjoy this idea or need help! *

HSI clocked out early, TP sit back and relax wait for next move!
Hello everyone! Today one of the web hot topic - all the 7 stars align and there must be something happen!
What do you think?
"Bulls took profits, bears took chances—HSI took a nap before the next round!" 😴📈📉
Here you go...now come with this news 📰
www.tradingview.com
**Shares in Hong Kong plunged 309 points or 1.3% to 23,415 on the last trading day of February, marking a second session of losses.
The Hang Seng fell further from its highest in over three years, set earlier in the week, and was on track for its first weekly drop in seven weeks, with all sectors posting sharp losses.
Still, markets were on course for solid monthly gains, up around 15% so far, marking a third month of rises as hopes mounted that China’s 2025 Two Sessions meeting next week will outline key policy priorities, including potential support measures for the economy.**
Look at the HSI D Chart
- posted 25Feb2025
- posted 26Feb2025
- posted 27Feb2025
- posted 28Feb2025 at point of writing; the index broke the key support level of 22900-23000 (the strong level of 23000 which is the 10MA level; let's monitor closely next week the new start for the month and see this level can be maintained. (this level has been retest 3 times)
Trading volume: finance.yahoo.com
Date Volume
Feb 27, 2025 6,257,000,000
Feb 26, 2025 5,138,100,000
Feb 25, 2025 4,449,800,000
Feb 24, 2025 5,264,600,000
Monthly
Feb 1 2025 - 87,382,400,000
Jan 1 2025 - 52,385,800,000
Dec 1 2024 - 56,349,200,000
Avg past 3 months : 65.3Bn ; current as of todate / month volume > past 3 mnths avg (i.e 57.98bn)
Look at the 4H chart (main chart)
PEPPERSTONE:HK50
The last Oct Hi @ 23241 has been broken hence retracement is not a surprised!
With the month closing today, the strong pullback is inevitable for institute and whale to take profit.
Please trade cautiously today! 🚨 🚨 🚨
Now, what's next?
As updated:-
Next level that we are looking at to break and steadily staying above this level - 23525, 23990, 24101, 24385
🚨 as of ✍️ it seems break the first support level this morning- and let's see if it could rebound today else it will go down ⬇ 👇 to 23175-22990 level, then 22741.
🗝️ support level : 23500 (broken) , 23175 (broken), 22990 (testing), 22741
MACD - last marked WAS deadcross and curving down as marked in YELLOW. After 8 bars-it reversed as marked in GREEN. and NOW it formed Deadcross again (as marked in YELLOW)
KDJ - Now reversed turned into bearish red zone. It remained in bearish zone.
BB - It is now entered lower BB channel and testing to break the lower BB and create new Lo.
Today Trade Plan: 23000-23504
Buy into support : 22795- 22900 (confirm with the indicator if its on reversal mode otherwise stayaway)
Sell at resistance : 24040,23454,23250 (short and TP within shorter timeframe, cross-check and wait for confirmation)
Monitor the 1H,4H movement with confirmation using MACD & KDJ indicator.
Set your tf, have your entry and exit plan!
Pay attention to the Goldencross/DeadCross; practice makes perfect.
Let's follow our own strategy and zen with 📙 and 🍵.
Happy Trading everyone!
🎯 Start to accumulate China & HKG for the potential upside for the year! All retracement is a good entry point.
🔎 DYODD and don't listen to anyone. Invest in yourself, do some study and learn along the way while you trying to verify or finding the answer if to start invest in CHN/HKG markets.
HKEX:2800 - 22.90-22.82 if it happens to retrace back to this level, otherwise anytime NOW is entry point! It's confirmed by the 200MA (above in W chart) ; also the W chart MACD GoldenCross. Cross-check it; if need helps let us know.
HKEX:2823 - 13.17-14.75 can start to open position and start accumulate, is allowed to wait for confirmation once it breaks 14.75 level. But you will be getting at higher cost...
HKEX:2801 - open position at price : 23.73-23.80 or anytime NOW! if ever retraced back to 23.36-23.66 accumulate more.
HKEX:3067
** Please Boost 🚀/LIKE 👍, FOLLOW ✅, SHARE 🙌 and COMMENT ✍ if you enjoy this idea or need help! *

$GCT update with fibonacci linesI look forward to the earnings call. I expect the price to breakout to the upside, as it can't be contained anymore. The results speak for themselves.

Not every run is a marathon— it needs pit stop! Hello everyone!
Here you go...now come with this news 📰
Market Chatter: China Plans 400-Billion-Yuan Capital Injection for Banks -- 💰💰💰?
www.tradingview.com
Look at the HSI D Chart
- posted 25Feb2025
- posted 26Feb2025
- posted 27Feb2025 at point of writing; the index seems doing quite well since open this morning,
trying to stay above the support level 💣💣💣23500 (and strong level of 23000 which is the 10MA level, if break below this level the Index bullrun end, but it's unlikely as it has been retest 3 times)
Trading volume: finance.yahoo.com
Date Volume
Feb 27, 2025
Feb 26, 2025 5,138,100,000
Feb 25, 2025 4,449,800,000
Feb 24, 2025 5,264,600,000
Monthly
Feb 1 2025 - 81,125,400,000
Jan 1 2025 - 52,385,800,000
Dec 1 2024 - 56,349,200,000
Avg past 3 months : 63.28Bn ; current month Feb volume > 3 mnths avg
Look at the 4H chart
PEPPERSTONE:HK50
The last Oct Hi @ 23241 has been broken hence retracement is not a surprised!
Now, what's next? This is tough question 🙋 - Next level that we are looking at to break and steadily staying above this level - 23525, 23990, 24101, 24385
🚨if it breaks below 23454-23500 (& not rebound) it could go down ⬇ 👇 to 23250-23175
🗝️ support level : 23500, 23175, 22741 t
MACD - last marked WAS deadcross and curving down as marked in YELLOW. After 8 bars-it reversed as marked in GREEN.
KDJ - Now reversed turned into bearish red zone.
BB - continue moving above the mid line of BB, this morning touches the mid-line; so be cautious 🚨🚨🚨
Today Trade Plan: 23454-24050
Buy into support : 23454 -23550 (TP :23600-23775)
Sell at resistance : 23800-24050 (TP : 23525-23454)
Monitor the 1H,4H movement with confirmation using MACD & KDJ indicator.
Set your tf, have your entry and exit plan!
Pay attention to the Goldencross/DeadCross; practice makes perfect.
Let's follow our own strategy and zen with 📙 and 🍵.
Happy Trading everyone!
🎯: start to accumulate China & HKG for the potential upside for the year! All retracement is a good entry point.
🔎 DYODD and don't listen to anyone. Invest in yourself, do some study and learn along the way while you trying to verify or finding the answer if to start invest in CHN/HKG markets.
HKEX:2800 - 22.90-22.82 if it happens to retrace back to this level, otherwise anytime NOW is entry point! It's confirmed by the 200MA (above in W chart) ; also the W chart MACD GoldenCross. Cross-check it; if need helps let us know.
HKEX:2823 - 13.17-14.75 can start to open position and start accumulate, is allowed to wait for confirmation once it breaks 14.75 level. But you will be getting at higher cost...
HKEX:2801 - open position at price : 23.73-23.80 or anytime NOW! if ever retraced back to 23.36-23.66 accumulate more.
HKEX:3067
** Please Boost 🚀/LIKE 👍, FOLLOW ✅, SHARE 🙌 and COMMENT ✍ if you enjoy this idea or need help! *

CHINA GALAXY ($601881.SS) Q4—STEADY IN CHINA’S STORMCHINA GALAXY ($601881.SS) Q4—STEADY IN CHINA’S STORM
(1/9)
Good morning, TradingView! China Galaxy (601881.SS) is buzzing—$ 35.37B ‘24 revenue, up 2.23% 📈🔥. Q4 hints at grit—let’s unpack this securities star! 🚀
(2/9) – REVENUE HUM
• ‘24 Haul: $ 35.37B—2.23% up from $ 34.6B 💥
• Steady: X says no big dips—brokerage shines 📊
• Edge: Tough market, still ticking
Galaxy’s humming—China’s steady hand!
(3/9) – EARNINGS ZAP
• ‘24 Profit: $ 10.13B—up 45.6% YoY 🌍
• EPS: $ 0.63—beats ‘23 slump 🚗
• Q4 ‘24: X buzzes resilience—details soon 🌟
Galaxy’s profit surges—market maestro!
(4/9) – BIG MOVES
• Lead: Tops brokerage, futures—$ 36.26B 🌍
• No Merge: CICC rumor nixed—solo run 📈
• Cash: $ 115.03B net—loaded vault 🚗
Galaxy’s flexing—steady as she goes!
(5/9) – RISKS IN SIGHT
• China Slow: Demand wobbles—yikes ⚠️
• Regs: Rules tighten—costs nip 🏛️
• Volatility: Trading dips could sting 📉
Hot run—can it dodge the heat?
(6/9) – SWOT: STRENGTHS
• Broker King: $ 36.26B—top dog 🌟
• Profit: $ 10.13B—45.6% zing 🔍
• Cash: $ 115.03B—rock solid 🚦
Galaxy’s a steady beast—built tough!
(7/9) – SWOT: WEAKNESSES & OPPORTUNITIES
• Weaknesses: Slow 2.23%, China lean 💸
• Opportunities: Digital boom, stimulus lift 🌍
Can Galaxy zap past the bumps?
(8/9) – Galaxy’s Q4 buzz—what’s your vibe?
1️⃣ Bullish—Profit shines bright.
2️⃣ Neutral—Solid, risks hover.
3️⃣ Bearish—China stalls it out.
Vote below! 🗳️👇
(9/9) – FINAL TAKEAWAY
Galaxy’s $ 35.37B ‘24 and $ 10.13B profit spark zing—steady champ 🌍🪙. Low P/E, but risks lurk—gem or pause?

Rebound lik a champ, monitor the vol c if the guests left early?Hello everyone! How was your zentradingstrategy? Hope everyone embrace with the retracement.
Sell on news? or Buy the dip?
What did we noticed on yesterday news? pfft..Distraction, distraction...
but here you go for today 😂😂😂: www.tradingview.com
**Shares in Hong Kong surged 520 points or 2.3% to 23,555 on Wednesday, shifting from a weak session the day before amid robust gains across all sectors.**
Look at the HSI D Chart
- posted 25Feb2025
- 26Feb2025 at point of writing; the index seems doing quite well since open this morning, trying to stay above the support level 22990.
Yesterday trading volume: finance.yahoo.com
Date Volume
Feb 26, 2025
Feb 25, 2025 4,449,800,000
Feb 24, 2025 5,264,600,000
Look at the 4H chart
PEPPERSTONE:HK50
The last Oct Hi @ 23241 has been broken hence retracement is not a surprised!
MACD - last marked WAS deadcross and curving down as marked in YELLOW. After 8 bars-it reversed as marked in GREEN.
KDJ - WAS at bearish zone curving down; and now reversed and turned bullish in green zone.
BB - now moving above the mid line of BB from yesterday ranging within the mid-line.
22990 resistance level now reversed as SUPPORT level. Hopefully the retracement is completed. Let's monitor especially the volume see if this is just a rehearsal.
Today Trade Plan: 23150-23670 (ahemmm...trust you can do the math 😂)
Buy into support : 23150 -23175 (TP :23600-23630)
Sell at resistance : 23465-23670 (TP : 23450-23500)
Monitor the 1H,4H movement with confirmation using MACD & KDJ indicator.
Set your tf, have your entry and exit plan!
Pay attention to the Goldencross/DeadCross; practice makes perfect.
Let's follow our own strategy and zen with 📙 and 🍵.
Happy Trading everyone!
Reminder : start to accumulate China & HKG for the potential upside for the year! All retracement is a good entry point.
HKEX:2800 - 22.90-22.82 if it happens to retrace back to this level, otherwise anytime NOW is entry point! It's confirmed by the 200MA (above in W chart) ; also the W chart MACD GoldenCross. Cross-check it; if need helps let us know.
HKEX:2823 - 13.17-14.75 can start to open position and start accumulate, is allowed to wait for confirmation once it breaks 14.75 level. But you will be getting at higher cost...
HKEX:2801 HKEX:3067
** Please Boost 🚀/LIKE 👍, FOLLOW ✅, SHARE 🙌 and COMMENT ✍ if you enjoy this idea or need help! 😍 **

$NIO Will a similar OBV and Volume pattern lead to a rally?Pay attention to the recent OBV structure (blue). Declining and forming a flat bottom.
The volume in pink displays the same characteristics during each stage of the Inverse H&S pattern: forming an initial peak during the left shoulder, a higher one during the formation of the head (although the head of the current pattern is accompanied by lower volume, but I have an explanation for it), and then peaking during the formation of the second touch of the base, at the start of the right shoulder. Finally, the volume dives along with the last peak of the structure before leaving the pattern altogether.
Additionally, notice how the Weinstein 30-week indicator is finding a bottom here.
During the 'head' or second dip, NIO's price declined on lower volume than in 2019. I can see it as a change of character. It looks like NIO didn't take this dip seriously this time.

A little dip? Just the market testing if the game still on!Hello everyone!
Sell on news?
www.tradingview.com
**Hong Kong stocks fell 315 points or 1.4% to 23,030 in Tuesday morning trade, marking the second session of sharp losses amid broad sector falls, notably consumers and tech.Traders retreated from riskier assets after the US intensified curbs on Chinese investments and proceeded with tariffs on Canada and Mexico.**
Is this piece of sh *** news helps in trading? 🤐 🤐 🤐
#sticktoyourplan
#trustwhatyoutrust
#followyourowntradingplan
Build your own #zentradingstrategy news can be distraction to your judgements!
Look at the HSI D Chart
Look at the 4H chart
PEPPERSTONE:HK50
The last Oct Hi @ 23241 has been broken hence retracement is not a surprised!
MACD - formed deadcross and curving down as marked in yellow circle.
KDJ - at bearish zone curving down.
BB - it broke down uptrende channel trading in lower BB channel
22990 support level turned resistance level now. If it able to break and stay above this level this week then this is a healthy pull back. Let's monitor.
Today Trade Plan: 22500-23250 (~830pts)
Buy into support : 22600 -22900 (TP :22950-23130)
Sell at resistance : 23000-23100 (TP: 22900-22930)
PEPPERSTONE:HK50
1h Chart
Check MACD & KDJ - wait for the reversal confirmation before taking your swing long position.
Monitor the 1H,4H movement with confirmation using MACD & KDJ indicator.
Set your tf, have your entry and exit plan!
Pay attention to the Goldencross/DeadCross; practice makes perfect.
Let's follow our own strategy and zen with 📙 and 🍵.
Happy Trading everyone!
Reminder : start to accumulate China & HKG for the potential upside for the year! All retracement is a good entry point.
HKEX:2800 - 22.90-22.82 add position
HKEX:2823 HKEX:2801 HKEX:3067
** Please Boost 🚀/LIKE 👍, FOLLOW ✅, SHARE 🙌 and COMMENT ✍ if you enjoy this idea!**

HSI took off like a rocket...confirmed bullish24/02/2025
HSI took off like a rocket… then remembered it forgot its wallet and came back for a quick retrace!" 🚀📉
Next target : 24385
HSI 1W Chart
Look at that! ignore the news, the movement and volume
finance.yahoo.com
Goldencross for the week of 3Feb2025 - with trading volume jumped from 3.69bn to 15.12bn.
And the subsequent week volume keeping at >20bn level (for the week of 10Feb & 17Feb)
Let's monitor if this week keeping the same level of volume for the 3rd week.
finance.yahoo.com
we noticed the trading volume increased from 4.42Bn to 6.1673bn last Friday 21Feb25
www.tradingview.com
** The Hang Seng Composite Index on information technology firms and the Hang Seng Tech Index slip 0.5% and 0.1% respectively, while Hang Seng Index adds 0.4%
** Stock up 76.9% YTD
HSI:HSI
The last Oct Hi @ 23241 has been broken today!
MACD, KDJ and BB remained at bullish zone.
Key support level: 22990,22668,22446
Key resistance level : 23675,24167,24385
Look at the 1h chart - posted
PEPPERSTONE:HK50
Today Trade Plan:
Buy into support : 23300-23500
Sell at resistance : 23650-23700 (TP:23630)
Monitor the 1H,4H movement with confirmation using MACD & KDJ indicator.
Set your tf, have your entry and exit plan!
Pay attention to the Goldencross/DeadCross; practice makes perfect.
Let's follow our own strategy and zen with 📙 and 🍵.
Happy Trading everyone!
Reminder : start to accumulate China & HKG for the potential upside for the year! Today retracement is a good entry point.
HKEX:2800 HKEX:2823 HKEX:2801 HKEX:3067
** Please Boost 🚀/LIKE 👍, FOLLOW ✅, SHARE 🙌 and COMMENT ✍ if you enjoy this idea!**

China's money supply explodes.China's revision of its M1 money supply calculation in January 2025, which now encompasses individual checking accounts and assets held in non-bank financial institutions, seeks to deliver a clearer understanding of liquidity within its economy. The reported surge from $67 trillion in December 2024 to $112 trillion in January 2025 has ignited discussions, with some viewing it as a strategy to obscure underlying economic issues, such as a potential deflationary debt spiral.
The People's Bank of China has declared a "moderately loose" monetary policy for 2025, aiming to boost the money supply and lower interest rates to foster economic growth, a move that may be connected to the M1 recalibration. This shift takes place against a backdrop of broader macroeconomic adjustments, including a 5% GDP growth target and initiatives to stabilize the real estate sector, as detailed in China's 14th Five-Year Plan for 2025.

will the movement has memory to follow its old path?20Feb25 ** Hong Kong's benchmark Hang Seng Index (HSI) declined 1.6%, dragged by a sharp correction in technology stocks.
HSI:HSI
20Feb25 - (4H)
21Feb25 (4H)
⏰ ⏰ ⏰
Trade with cautious.
Since the goldencross formed week of 3Feb25 - the index had soared 908pts, +4.49%
The following week; week of 10Feb2025 - another +1486pts +7.04%
For the past two weeks the index had a small bull run of 2543pts; 12.7%
If history repeat, then HSI need a break after consecutive two weeks of climbing. If you see what I see.
The next strong resistance will be the last Oct2024 Hi at 23241. Let's see if today the volume and market sentiment able to break this then is likely to retrace back.
KDJ - The D chart - at overbought and red zone and now turning to red bearish zone.
Look at the 4H chart
PEPPERSTONE:HK50
Overnight the HK50 had touched and broke 23241 and retrace back.
Let's monitor if today there is chance for HSI to break the last Oct Hi.
MACD - above zero level - Bullish zone reversal from deadcross formed earlier and now with light red inverted histogram.
KDJ - Turned Bullish
BB - returning to upper BB channel
Today Trade Plan:
Buy into support : 22850 - 23000 (TP/SL at 22580)
Sell at resistance : 23250 - 23300 (TP/SL at 23200)
Look at the 1H chart.
Be cautious and pay attention. KDJ still ranging bearish zone although the MACD is within Bullish level but with light histo i.e low volume.
Monitor the 1H,4H movement with confirmation using MACD & KDJ indicator.
Set your tf, have your entry and exit plan!
Pay attention to the Goldencross/DeadCross; practice makes perfect.
Let's follow our own strategy and zen with 📙 and 🍵.
Happy Trading everyone!
Reminder : start to accumulate China & HKG for the potential upside for the year! Today retracement is a good entry point.
HKEX:2800 HKEX:2823 HKEX:2801 HKEX:3067
** Please Boost 🚀/LIKE 👍, FOLLOW ✅, SHARE 🙌 and COMMENT ✍ if you enjoy this idea!**

Alibaba Group | BABA | Long at $80.00Alibaba Group NYSE:BABA has the potential for massive growth. From a technical analysis perspective (and using my selected simply moving averages (SMAs)), the price of NYSE:BABA is reconnecting with its primary SMA. It could ride this area for a while as it consolidates further, but this often means a future reversal of the downward trend. Thus, at $80.00, NYSE:BABA is in a personal buy zone.
Target #1 = $89.00
Target #2 = $94.00
Target #3 = $107.00
Target #4 = $116.00
Target #5 = $305.00 (very long-term view...)
