Wynn Short Update #2I been using this stock as hedge for market downturn for the last few weeks and it's already paid out multiple times.
it's looking ready to reject again. good risk/reward short here with a $3 stoploss.
Chinastocks

Green Pill or Red Pill, NIO - You Must Chose- strong social & hype fundamentals
- China trade risks already priced in
- Counter trade to Tesla failure/ meltdown
- institutional and media sentiment turning around
- direct access to massive organic growth China EV market
- intriguing stock to float, short % and borrowing rates

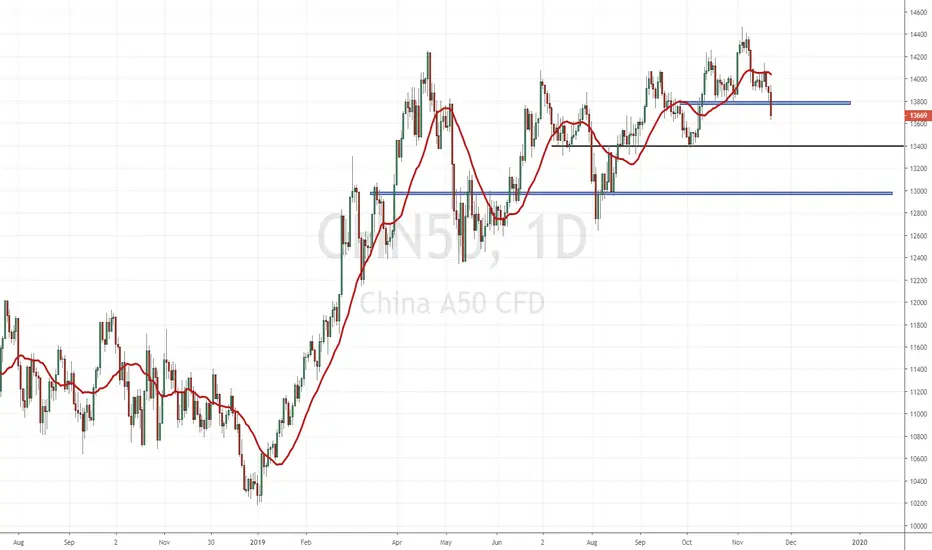
China 50 Reversal PatternThe daily chart of the China 50 gave us a reversal trigger on a Friday. Going forward this week would ideally like to see how the market opens to see if it can give us a pullback.
The market structure is apparent. Higher lows and higher highs. We hit a resistance and from here the higher lows (uptrend) began to weaken.
From here, we created and confirmed our first lower high with the break of the neckline on the head and shoulders pattern.
I would watch to see how price reacts at the 13400 zone, but main target would be 13000.
China A50, longChina A50 gave a buy signal on Nov 1st 2019 on day charts, as indicated on charts.
As we see now, price has formed a higher high and we will deep dive into the hourly and monthly charts for cues.
Look out for retracements and if price continues to make a higher Low, then treat it an entry point to buy more
Adding my earlier studies for different perspectives on charts
If you like what you see, please share a thumbs up and a comment in the section below
If there is any specific chart to be reviewed, share the details below and I will try and revert at the earliest
Lets discuss!
Cheers

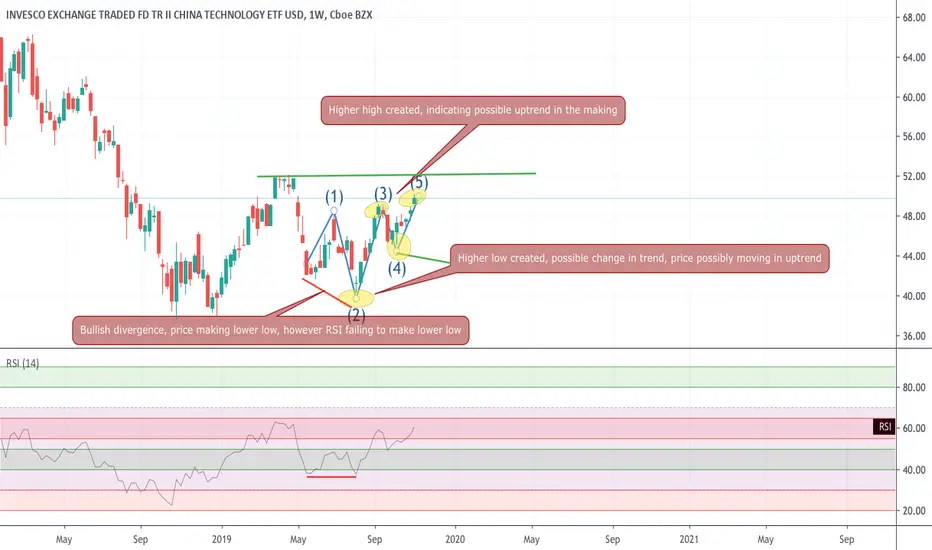
CQQQ, on weekly charts gaining strength - buy set upAs seen on the weekly charts, CQQQ seems to be changing directions. Bullish divergence seen recently as indicated in the chart and price getting into an uptrend, recent week high also broken and price now eying the 52.31 level breakout.
Important to see a retest and look out for price retracing and confirmation of uptrend if price makes a higher low than the most recent previous levels
2 ways to play
1. wait for higher low to be created and if next candle after that formation is positive, go long
2. Incase you want to wait for further confirmation, then wait for 52.31 levels to be breached and then go long
IF you like what you see, please share a thumbs up
Cheers
China showing bearish divergenceFOREXCOM:CHN50 showing bearish divergence where Price makes a new high and RSI fails to make a new high
Open short position given the specs on the chart
If you like, please share a thumbs up and your thoughts
Cheers


TENCENT WEAKNESSOn the weekly Chart we have a descending triange.
We also have a second descending triangle, which will break sooner or later.
Target is the 252-262 zone.

ALIBABA resistance breakoutBABA is breaking an important resistance, tested 4 times since late July.
It Opened above resistance, and is growing with above daily average volume .
Great risk reward ratio entering position entering a position at $181, sell around $195.

Shanghai Composite: Golden Cross. Potential for an strong rise.SHCOMP is currently pulling back off a Double Top formation near July's 3,050 Resistance. The key development here is the potential to have a Golden Cross formation on 4H.
Last time this pattern emerged was in mid February 2019, when again the price was pulling back after a Double Top. The result was an aggressive jump of +20%. Medium term investors can wait for the Golden Cross to take place, catch the low and then go long on the medium term. Target Zone: 3,250 - 3,400.
** If you like our free content follow our profile (www.tradingview.com) to get more daily ideas. **
Comments and likes are greatly appreciated.

Shanghai A composite, in the key resistance levelHello, Dear friends
China Shanghai A composite index just break the key level ~ 3000, but huge resistance in above, and 4H&1D RSI running in over bought region.
my strategy is retest the below key support level ~ 2830, to see if a reverse H&S could be formed or not.

China 50 Head and Shoulders?Seeing some weakness here on the China 50, as the buyers bid to make a new higher low has yet to succeed. If we break this 13800 zone, it will be a break of a flip/support zone. Indicating there is no strength with this break out. Be patient and await for the candle close.
Here is how it looks like on the 2 hour chart:
The head and shoulders is very clear. Still would await for a nice and strong close below this zone.
13500-600 is where I would see another flip zone acting as support.


Strong Close but Can FFHL Continue Higher?HUGE day today but I'm not sure if this news is enough to make a reason to keep this on the radar or not. I'm sure after today, the weekend warriors will notice this volume and price move.
"This is what happens when penny stocks release news afterhours. Just because the closing bell rings at 4PM EST, doesn’t mean you stop watching the market. Those who had access to aftermarket trading on Thursday could have reacted to the companies latest announcement. FuWei reported its quarterly and 6-month results, which seems to be the spark that lit this fuse."
From Top 3 Penny Stocks To Watch On Friday on PennyStocks.com
Results:
FuWei reported 10.7% growth in sales compared to the same quarter last year. It also saw EPS come in at $0.04 per share versus last year’s period of a $0.4 loss per share. The company’s plastic film products are widely used for food, medicine, cosmetics, and even tobacco.
NASDAQ:FFHL

600276, Jiangsu Hengrui Medicine Co. Ltd - Cup & HandleSSE:600276
Classic pattern, Cup & Handle, which in this case acts as a figure of continuation of the primary trend.
Let's take advantage of this breakout of resistance level.
Statistically as we know from our backtest based on our Entry Points, Stop Loss, Take Profit, we have a % positive realization of this trade equal to 35%.

FXI WAVE C of WAVE B IS NOW FORMING WE WILL SEE A BULL WAVE NOWWE ARE NOW ENDING C OF A MAJOR WAVE B LOW LOOK FOR A VERY STRONG AND VERY FAST UP MOVE FOR THE NEXT 30 TO 60 DAYS

Kweichow Moutai (600519) SSE short.All description on the chart.
Please, don't forget to like and follow.
Thank you.


China 50 Possible Head and Shoulders PatternWe have had a recent downtrend to the 13400 zone where it looked like we could see an inverse head and shoulders to the downside.
However, we failed to break below. Now we are attempting to create a head and shoulders pattern to the upside. Waiting for a break above 13700 with a nice close.
Equities seem to be ready to get a boost from world central markets with the promise of more cheap money. The ECB is tomorrow and they are likely to cut rates even negative and provide more stimulus. The US Federal Reserve is then on tap to do the same next week on the 31st.
The Chinese markets may have other issues. Talks of a banking crisis with Baoshang bank, and other economic problems...China's last GDP reading of 6.2% was the lowest in 27 years.

Long IqTradingView
Open position at $18.5
Stop loss at $17.5
Take profit at $20
Why this play?
As much as i would love to see a triple bottom for a long, I'm not sure we would get it. The china related stocks has been very beat up, especially IQ.
I have a seen a few of them reversal off already but iq hasn't really reacted much yet.
if we expect positive news on china trade deal, this would be a pretty good stock to go on long.

China Mobile buy signalsChina Mobile (CHL), Monthly chart: 10 years long(!) support zone + "Harami" candle pattern + Side of Bollinger bands (120,2) + Extended divergence on RSI(14)

NIO - NEUTRAL - Patential support 2.50Potential support for NIO at 2.50. I will update NIO welcome to follow the big potential
Don't try to cath a falling knife. No forcast, nor exitement as it still on a pretty steep slope down...

