Chinesestocks
Value Investment - BIDU - Improved Profitability After The VirusAll comments and likes are very appreciated.
_________________________________________________________________________________________________________________
Fair Value and Profit Drivers |
Our fair value estimate is $190 per share, with a 2020 P/E of 31 times and 2021 P/E of 25 times.
We expect a 5% CAGR in online marketing revenue in the next five years, driven by recovery in the longer term. This is because weak macroeconomics (resulting in weaker demand and pricing for ads), substantial increase in ad inventory by Bytedance and Tencent, and moving customers’ landing pages to Baidu’s platform play an important role in the current weakness. We do not expect these headwinds to persist in the longer term, except Baidu’s competitor still have room to increase ad load. As the moving of landing pages is completed, the economy recovers, iQiyi’s in-feed revenue improves after cleaning up unhealthy ads, and video content can be approved more quickly after the 70th national day on Oct. 1, 2019, we expect Baidu and iQiyi’s advertising revenue to recover from a low base.
We expect other revenue to grow at a 17% CAGR in the next five years, driven by strong growth at iQiyi. 49% of the others revenue was iQiyi’s membership revenue in 2019, which will see growth from increasing subscriber number and high-quality original and licensed content at iQiyi. Baidu will spend more marketing dollars up front for app installation and cultivating app usage, but revenue generated from the users will occur during the lifetime of the users. Hence, we expect to see revenue grow faster after initial investments. Should the return on investment be poor, Baidu will have no choice but to cut back on sales and marketing expenses, which will boost margin. DuerOS and cloud are also other areas of investments.
We assume operating margin will rise back to 20.2% in 2024, compared with 5.9% in 2019. Excluding iQiyi, Baidu’s core operating margin is assumed to rise to 20.2% in 2024 from 19.1% in 2019. We think our assumptions of only a small-margin recovery for Baidu’s core operation have sufficiently incorporated the ever-increasing competitive environment in the Internet sector. This is particularly true in searching for general information, because it is still a necessity, and wide-moat Baidu has a dominant market share of over 70% in search. We are confident that Baidu resume growth for search. Our five-year net revenue and operating profit growth are 9% and 40% respectively.
Wide-moat Baidu’s fourth-quarter 2019 results were largely within our expectations, and after fine-tuning our model, we are cutting our fair value estimate to $190 from $199. However, we think the shares are undervalued, as Baidu is on track for improved profitability after the coronavirus outbreak. Fourth-quarter 2019 year-over-year revenue growth was 6%, at the high end of the latest guidance range of 4% to 6% and its previous guidance of negative 1% to 6%. Meanwhile, Baidu core revenue in the quarter grew 6% year over year, excluding spin-offs, at the high end of the latest guidance of between 4% and 6% and the previous guidance of between 0% and 6%. Baidu’s net income was CNY 6.3 billion in the quarter compared with guidance of CNY 6.2 billion to CNY 6.7 billion. Net income of Baidu core rose 84% year over year, at the low end of the guidance of 83% to 90%. Management said it expects 2020 first-quarter revenue to decrease 5% to 13% year over year for Baidu and to drop 10% to 18% for Baidu core compared with advertising peer Weibo’s 15% to 20% drop. We assume an 18% year-over-year decline in the first quarter; a 3% decline in the second quarter; followed by a 9% increase in the second half of 2020; and no growth in the full year of 2020 for Baidu core revenue. Our non-GAAP operating expense plus cost of revenue for 2020 is 7% higher than the annualized level that is based on the more rational level in the fourth quarter of 2019. Our five-year revenue and operating profit CAGR are 9% and 40% (low base in 2019 due to record low margin of 6%), respectively, versus 9% and 11% previously.
Risk and Uncertainty |
We think Baidu faces high levels of risk, given intense competition along with questions as to whether its AI-related investment will generate satisfactory returns.
Though Baidu is the largest search engine in China, it is competing with the other two Internet giants, Tencent and Alibaba, and Google’s potential return to Chinese search market is also a threat. Regarding the search engine business, Tencent invested in Sogou, and Alibaba acquired UC Web, which owns a mobile search engine, Shenma. Competition has extended to each key area of mobile Internet usage, such as navigation, O2O services, online video services and so on. Baidu’s margins have been significantly dragged down by aggressive spending in video content and O2O marketing but recovered to 18.5% in 2017 from 14.2% in 2016 as Baidu divested margin-dilutive businesses.
The major Internet companies in China have been investing in AI-related business, such as cloud computing, voice and image recognition, and autonomously driven cars. At the current stage, it is difficult to predict whether Baidu will be the final winner in AI and whether the returns will reward its investment.
In addition, regulatory risk is a concern. Following the Wei Zexi incident in early 2016, Chinese authorities launched new regulations for online search and advertising, which clearly defined paid search results as advertising. These regulations took effect Sept. 1, 2016. Given stricter standards for online advertisers, Baidu’s online marketing services revenue growth declined to 1% in 2016. If the local authorities release more policies regarding Internet business, such as online advertising and online finance, Baidu’s revenue could be negatively affected.
Since 2017, Baidu has discontinued the disclosure of MAUs for its mobile search and mobile maps, which is possibly due to weaker numbers.
I and/or others I advise hold a material investment in the issuer's securities.
_________________________________________________________________________________________________________________
All comments and likes are very appreciated.
Best Regards,
I0_USD_of_Warren_Buffet
300330 Shanghai Huahongjt with a potential long term bottom5 waves up, 3 waves down, reaction on huge support, potential IHS formation. Looks good
NIO Breakout coming SOONTarget 1 : 5$ (Aligns with 100 Daily MA)
Target 2: 8$
NIO Breakout coming soon due to the further accumulation of good news!
The downward channel will be broken, and the confirmation is the break above 2.40 which also happens to previous support level.
The 1st target is 5$ which happens to be the 100 Daily moving average price point.
The 2nd target is 8$ which happens to be a previous resistance level.
The rally will come quickly... the market almost always performs well come holiday times.
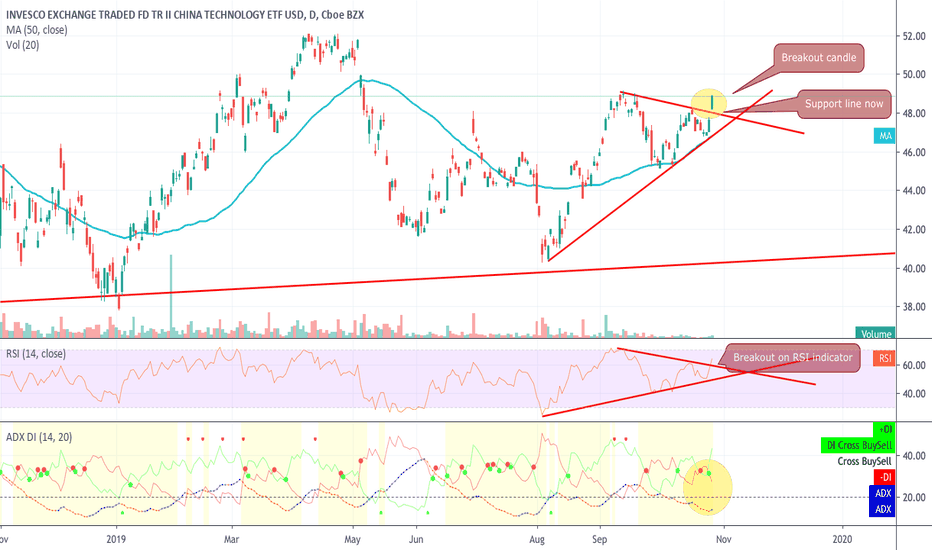
CQQQ - breakout - long with close Stop lossHi Friends , breakout on daily time frame on AMEX:CQQQ .
Look at the breakout with the Green candle peeping out of the triangle formation. RSI and ADX both showing strength (DM crossover the DM- but ADX still weak, but looks like gaining strength.
Watch out for possible retest of the newly found support line ( earlier resistance line) for a possible throwback down to the trend line and then momentum pulling to upwards if the news flow from the trade talks with China remain positive.
If the price renters the triangle then expect the lower support levels of the triangle to be tested fairly soon.
Please note, wait for candle formation (for daily timeframe, wait for close levels to confirm breakouts and also retest levels for finalizing any trade
One could look at entry at this level and place stop loss at 47.50 levels.
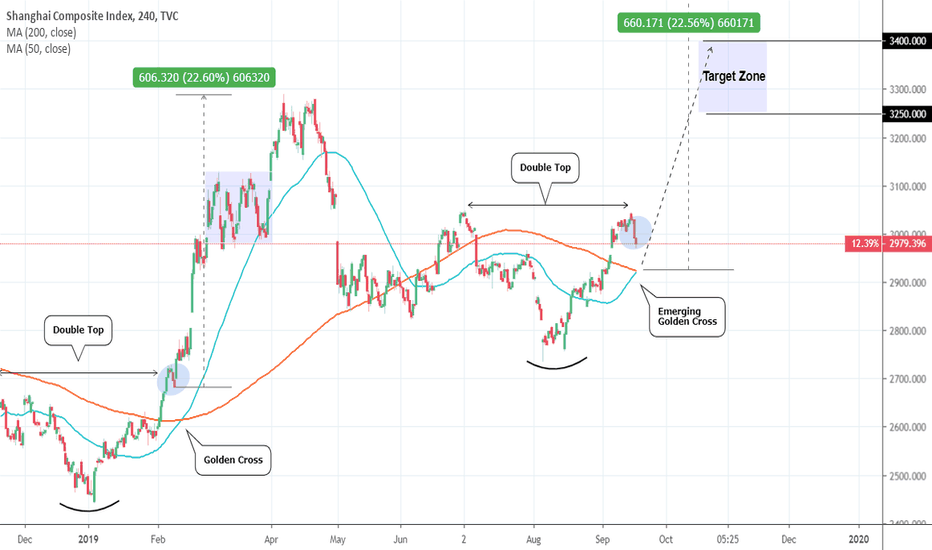
Shanghai Composite: Golden Cross. Potential for an strong rise.SHCOMP is currently pulling back off a Double Top formation near July's 3,050 Resistance. The key development here is the potential to have a Golden Cross formation on 4H.
Last time this pattern emerged was in mid February 2019, when again the price was pulling back after a Double Top. The result was an aggressive jump of +20%. Medium term investors can wait for the Golden Cross to take place, catch the low and then go long on the medium term. Target Zone: 3,250 - 3,400.
** If you like our free content follow our profile (www.tradingview.com) to get more daily ideas. **
Comments and likes are greatly appreciated.
China's Large Cap: Ready to test the 10 year Highs?With the U.S. - China trade deal developments ongoing and reportedly staying on positive grounds, the stock markets are globally on the rise in 2019. This is a good time to examine how the heavy Chinese companies are performing.
FXI is the index that tracks China's stocks with the largest capitalization. On the monthly (1M) chart we see that since the 2009 crash, it has been recovering on Higher Highs and Higher Lows, effectively constructing a Channel Up on 1M (RSI = 56.535, MACD = 0.600, Highs/Lows = 0.3822). These indicators show that it recently hit a low point and is on the early stages of a new bullish leg. On the chart this is evident by the January 2019 bounce on the inner lower Higher Low trend line (indicated in dash). What is also evident are the 1M Support Zone (28.20 - 28.70) and 1M Resistance Zone (52.90 - 54.00). The 1M Resistance Zone is our immediate target although the 10 year Channel Up suggests that it may break it and peak as high as 61.00.
In our opinion it is definitely a time to start looking at China's Large Cap more favorably.
We have already warned of this upcoming bullish leg on the Shanghai Composite Index on December 2018:
** If you like our free content follow our profile (www.tradingview.com) to get more daily ideas. **
Comments and likes are greatly appreciated.
NIO Bouncing Off Hard SupportPlenty of bad news coming out on this one. Cancellation of a factory in China, reduced government funding for electronic vehicle (EV) development, and profitability going ever into the abyss.
If this thing behaves anything like TSLA, we could see a nice bounce here. But why?
The EV space is rife with optimism and hope due to the disruptive nature of its products. Much like the internet disrupted traditional brick-and-mortar retailers and telecommunications companies, electronic vehicles threaten to disrupt traditional gas-powered transportation. Looking back on the performance of Amazon, Apple, Microsoft and the like over the past two decades, and considering their role in disrupting and creating markets, it is no wonder why investors associate electronic vehicles with a potentially bright future of massive returns. Disruption creates opportunity to take or create markets.
Yet there still remains the fundamental problem of profitability. If a company cannot turn a profit, how can it hope to be successful? Looking into the past, Amazon itself was unprofitable for the first 14 years that it was listed on the stock exchange, yet it was able to survive and thrive on the back of debt financing, steadily increasing its revenue and expanding its supply of collateral (equity). Regardless of the negative fundamental picture for new and disruptive companies, and the risk it poses on their survival, investors often look at them as massive opportunities.
For a stock like this, throw fundamentals out the window - this is the realm of human psychology. Hope, fear and greed will drive the price into insane extremes, and timed correctly, can be quite profitable. The only fundamental here is this: can it continue to acquire debt?
With all of that said, there is a setup to go long here. Hard support sits around 5.5 with plenty of upside on hopes and dreams beyond.
Shanghai Index: Buy the pull back.The Shanghai Composite Index has seen a considerable rise since the start of the year, which we predicted in December ( ). The parabolic rise on 1D has reached past the overbought zone (RSI hitting 80.000) and as it got close to the 0.500 Fibonacci retracement level (3,015), we should start see it consolidating. The strongest candidate for a pull back however is the 0.618 level (3,150). We are willing to buy any such pull back and target the 0.786 level at 3,340.
See below how we predicted this +22% rise in December:
** If you like our free content follow our profile (www.tradingview.com) to get more daily ideas. **
Comments and likes are greatly appreciated.
Is this the right time to start buying Chinese stocks?Since the all time highs in 2007 the Shanghai Composite has not recovered those levels failing on successive Lower Highs. This has created a Triangle pattern on the Monthly chart with Higher Lows. We can't be sure which trend line has to be followed to mark the new Higher Low as both have valid grounds. In any case, the index is approaching its long term technical low, which was either on October's 2,449.20 or will be near 2,100. 2,500 is currently the MA200 period on the monthly chart, so there are more chances to see the recovery starting now. Our early estimates place the long target at 4,380.
** If you like our free content follow our profile (www.tradingview.com) to get more daily ideas. **
Comments and likes are greatly appreciated.
MINSHENG HOLDINGS - (SZSE:000416) - D1* Looking bearish on D1.
* Conditions are ready for the movement which i am expecting for.
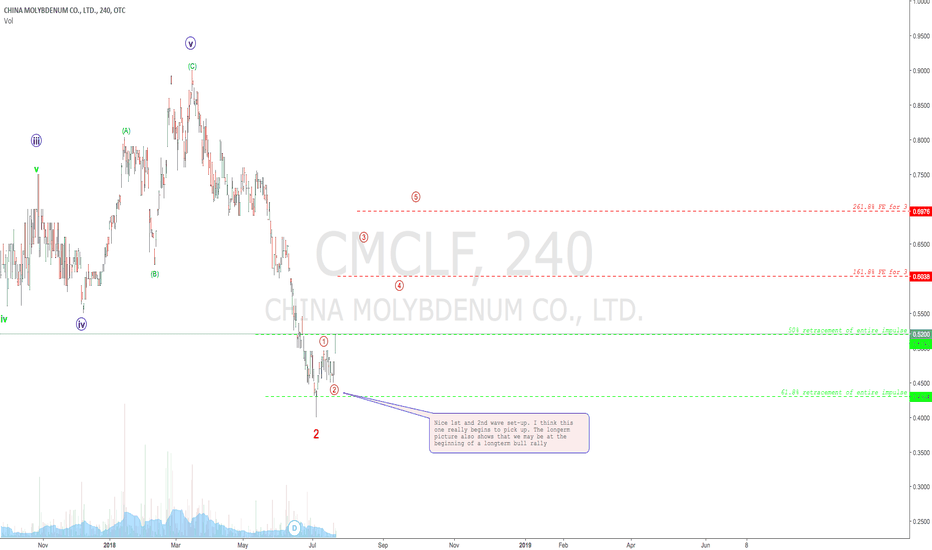
China Molybdenum Co looks like a great buyCMCLF looks substantially bullish both short term and longterm. We are also currently trading really good entry levels.
Below is the longterm picture. If we stick to this picture, trading this will provide great opportunities to scale the position size up as the play builds.


