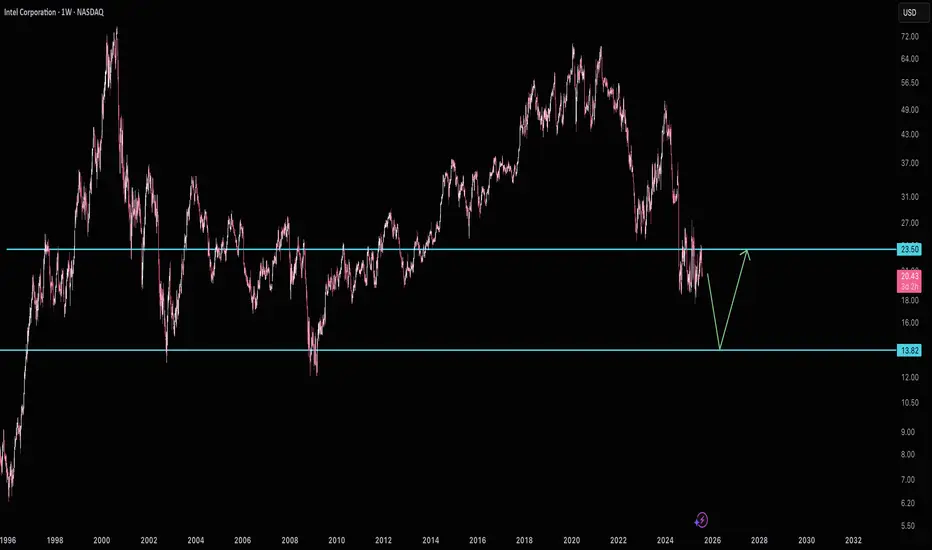
Intel looks to want $13Intel looks to be waiting below $24 resistance for $13 support. I wouldn't short it at it's current price, but I would be patient and wait for $13 if you're looking to buy. Good luck!
Chips
99% of people buying $NVDA don't understand this:🚨99% of people buying NASDAQ:NVDA don't understand this:
NASDAQ:GOOGL : “We’re boosting AI capex by $10B.”
Wall Street: “Cool, that’s like $1B or 0.06 per share for $NVDA.”
So from $170.50 at the time of news to $170.56 right?
No.
NASDAQ:NVDA trades at 98× earnings. So that $0.06? Turns into $6.00
Why?
Because people are expecting that to be happening every single year for 98 years and they're paying All of it Today in Full amount.
So NASDAQ:NVDA will get $1B more per year. But NASDAQ:NVDA price per share already increased by $100B in past 2 days 😂
Then it crashes 40% and everyone is wondering why.

Intel to 40. A bet on America's chip when the chips are downIntel is an interesting stock. I made a bet on it this week. It’s very cheap trading at book value. Lots of bad news has destroyed this stock while other chip stocks are at all time highs. With a new CEO running the show and investing in next gen chip production, I think he turns it around.
I think it's at 40 within a year, and makes new all time highs after that.

How expensive is Nvidia today?How expensive is NASDAQ:NVDA today?
❗ You're paying $40 today for $1 of next year's earnings
That's what Nvidia's forward P/E 40x means at current $172 per share
AI might be the future but you're prepaying for it like it's 2060 🤖

NVIDIA to $228If Nvidia were truly done for, why is it impossible to find their latest 5000 series GPUs?
Even if someone wanted to buy one, they simply can't.
The reason lies in Nvidia's commitment to fulfilling the soaring demand from AI data centers, which has left them unable to produce enough H100 and H200 models.
This situation also allows Nvidia to increase their profit margins significantly, capitalizing on the disparity between demand and the media frenzy surrounding them.
DeepSeek serves as a prime example of how out of touch mainstream media can be.
All DeepSeek did was replicate Chat GPT.
Training models requires substantial computing power. The panic surrounding Nvidia and other semiconductor companies is quite amusing; the demand for computing power is skyrocketing!
The gap between the reality of the AI mega-trend and the narrow focus of mainstream media is staggering! It's astonishingly out of touch! Just as out of touch as Cramer was when he declared META was done at $100, or when he thought Chat GPT would obliterate Google at $88.
Stock prices fluctuate between being overvalued and undervalued. While we have metrics like EGF and PE ratios to assess valuation, indicating that Nvidia is currently inexpensive, this doesn't guarantee it won't drop further. However, it is generally wiser to buy stocks when they are cheap rather than when they are costly.
The greater the deviation from the high then the greater the BUYING OPPORTUNITY being presented for the very best leading companies.
The key takeaway is that the deeper Nvidia falls during its corrections, the more advantageous it could be.
Those who are experiencing anxiety during these declines may find themselves selling at a loss, or for a marginal profit possibly around previous highs, while the stock has the potential to rise to $228 and beyond.
The potential for growth is significant; the $228 Fibonacci extension may not represent the peak. Attempting to predict a top for Nvidia could be misguided. Once it reaches $228, Nvidia might maintain a valuation similar to its current $130 level.


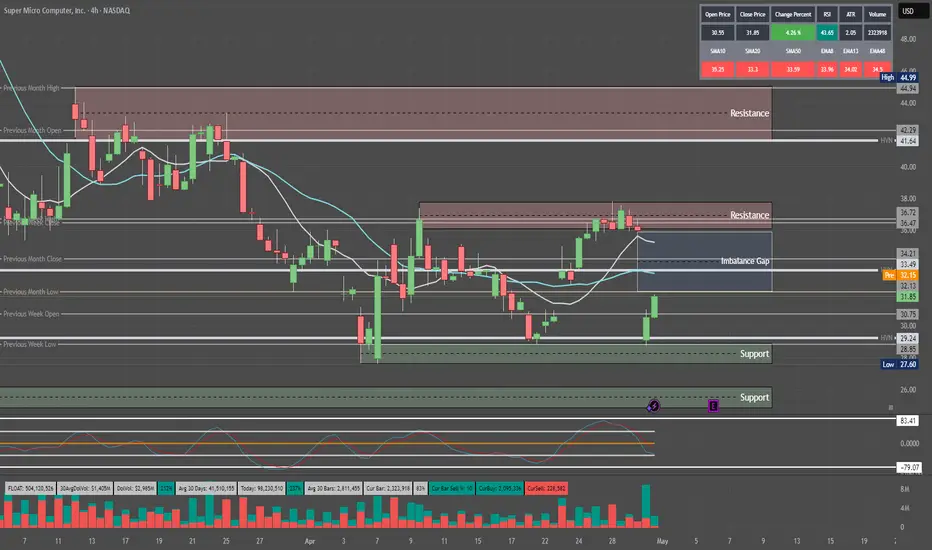
Quantum's SMCI Trading Levels 5/1/25Really don't understand this stock but retail really loves it. Seems like they want to push this to 36 for a possible run up into earnings before possibly dumping.
Nvidia : Should I be worried?Looking closely at Nvidia NASDAQ:NVDA , we can see that since March, the price has gravitated back to the Point of Control (POC) on the volume profile. From there, we’ve seen a solid reaction — up around 33%, after Nvidia had previously taken a sharp hit from its recent top.
In my view, it’s very possible that Wave 4 is now complete. It’s been a very complex, sideways consolidation, but that’s typical behavior for a fourth wave. Zoom out, and the bigger picture looks a lot cleaner — this whole range doesn’t seem nearly as messy on the higher timeframes.
That said, I’m not fully bullish yet. For me, $122 is the key level. Only once we break and hold above $122, I’ll shift into a more confidently bullish stance. Until then, it’s still possible we revisit the $80–$85 range, maybe even sweep the previous low. It doesn’t have to happen, but structurally, it’s still on the table.
Given the broader uncertainty — macroeconomic pressure, U.S.–China tensions, regulatory noise — I’m staying cautious. For now, I’m mainly focused on this from an 8-hour chart perspective. Until we get that confirmation above $122, I’m not rushing into any aggressive positions.

Nicest setup I’ve seen in a while-Not complicated; why make it?Tesla with perfect technically sound pattern
Five or six things coming together, including a perfect tag of the breakout line, a perfect tag of the long-term uptrend line a Bollinger band crash perfect tag of the Fibonacci .62
It’s like a perfect set up
Not very complicated; why make it complicated?

Confessions from the Desk: Nvidia is Up, I Am NotIt’s Friday, the sun is shining, and Nvidia is up. Unfortunately, I am not.
Nvidia sits smugly at $137.19, while my $140 call is officially DOA—dead on arrival, with no chance of resuscitation. I’d like to say I’m surprised, but at this point, it feels like the market is just personally messing with me.
To add insult to injury, my carefully curated basket of stocks has been bouncing around like a drunk day trader on margin. One minute, I think I’m up; the next, I’m refreshing my portfolio like a gambler waiting for a miracle. Spoiler alert: the miracle never comes.
Meanwhile, Nvidia has been making big boy moves—cutting its stake in Arm Holdings, taking a bite out of China’s WeRide, and ghosting Serve Robotics and SoundHound AI like a bad Tinder date. The result? Stocks are moving, headlines are flashing, and somewhere in a penthouse office, a hedge fund manager is smirking at my pain.
Let’s break it down:
Nvidia dumps 44% of Arm Holdings – Apparently, even they have commitment issues.
Exited Serve Robotics & SoundHound AI – Serve was rolling along nicely until, well... it wasn’t. SoundHound AI got the boot, too, and its shares fell 25%. Ouch.
Pumped 1.7 million shares into WeRide – WeRide stock shot up 76%. That’s cool, but guess who doesn’t own WeRide? This guy.
Also bet on AI cloud firm Nebius – Stock rose 8%. Lovely. Again, not in my portfolio.
Now, as Nvidia makes its AI master moves, I sit here staring at my screen, watching Serve Robotics—one of my few February winners—go completely sideways. That’s right, folks. Nvidia’s got a plan, but my portfolio? It’s just vibing.
But hey, it’s Friday, the sun is out, and at least I don’t own SoundHound AI. Small wins, right?
Happy Friday

2000 $CSCO vs 2025 $NVDA, is the similar crash possible?🚨 Could Nvidia be the next Cisco? 🚨
In 2000, Cisco dominated networking with its own chips. But competitors used cheaper, nearly as effective chips, and the stock dropped from $82 to $8 in just 2 years. Is the same fate possible for Nvidia?
Cisco invested heavily in its IOS CLI and aggressively defended it.
Nvidia did the same with CUDA, taking action against anyone trying to make alternatives.
But now, competition is heating up.
DeepSeek and other companies could lead those who over-invested in Nvidia chips on borrowed money to offload them, flooding the second-hand market with GPUs.
Meanwhile, the Magnificent 7 might slow down orders since they already have tons of Nvidia chips stockpiled.
Just like Cisco switches were 80% off in 2001, could we see a similar scenario with Nvidia?
And let’s talk about the $2000 RTX 5090 — would you buy one today?
Nvidia has committed huge resources to TSMC for chip production. They could be facing an overstock issue, and slashing prices could hurt profit margins. 😬
We will soon know the direction it will go, next few quarters will show us all.

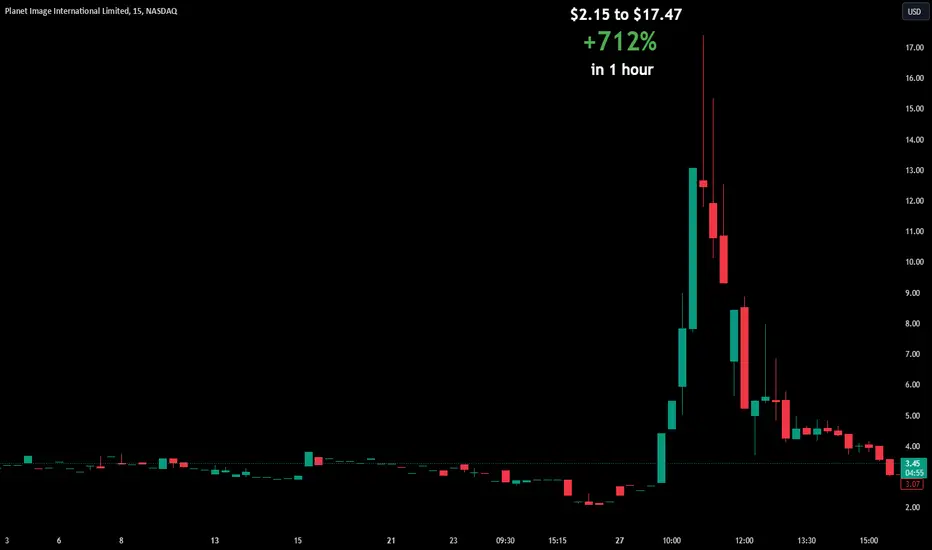
+712% in 1 hour $2.15 to $17.47 $YIBOWild moves in the markets today, this stock making the largest one which ended where it started.
That tells you profits must be locked, especially when huge percentages are reached 🎯
Nvidia at $220 in 2025 ?Key Drivers for NVIDIA's Growth:
Surging AI Demand: NVIDIA's GPUs are integral to training sophisticated AI models. The company's latest Blackwell GPUs are sold out for the next 12 months due to unprecedented demand from major tech companies, underscoring NVIDIA's pivotal role in AI advancements.
Data Center Expansion: NVIDIA's data center revenue has experienced remarkable growth, with a 409% increase driven by the escalating need for AI chips. This trend highlights the company's dominance in the data center GPU market.
Strategic Collaborations: NVIDIA's involvement in Project Stargate, a significant U.S. AI infrastructure initiative led by SoftBank and OpenAI, is expected to drive future revenue and alleviate concerns about peak compute demand, contributing to NVIDIA's long-term growth.
Analyst Confidence: The consensus among Wall Street analysts is a "Strong Buy" rating for NVIDIA, with an average 12-month price target of $176.86, indicating a 20.3% upside from the current price.
Bullish Price Target:
Considering these factors, a bullish price target for NVIDIA over the next 12 months could easily be $220. This projection aligns with the high forecast among analysts and reflects confidence in NVIDIA's sustained growth trajectory.
Conclusion:
NVIDIA's strategic positioning in the AI sector, robust data center growth, and strong market sentiment make it a promising investment for those seeking exposure to the burgeoning AI industry.
Please note that this is just my view and is not financial advice.

easy play on ASMLI’ve been closely monitoring the monthly chart of ASML Holding (Euronext) and have identified a compelling setup that aligns with my long-term strategy. Previously, I shared an idea on TradingView with an ambitious $1200 price target, based on the stock’s strong long-term uptrend and solid fundamentals. However, upon further analysis, I’ve identified an internal trendline, which provides additional clarity and reinforces my bullish outlook. Interestingly, a similar internal trendline has been observed in other stocks like Super Micro Computer, further validating this structure.
Technical Analysis:
Primary Uptrend:
ASML is in a well-established long-term uptrend, confirmed by the primary ascending trendline connecting historical lows since 2012. This line showcases the structural strength of the stock and consistent investor confidence.
Internal Trendline Confirmation:
The recently identified internal trendline connects intermediate lows formed during price retracements, indicating a temporary slowdown in growth while maintaining an overall bullish structure.
This internal trendline has previously acted as dynamic support, suggesting it may serve as a critical reference point for future price action.
Key Price Levels:
The current price (631.5 EUR) sits near a confluence zone between horizontal support and the internal trendline. This presents a strong entry point for a long position with an attractive risk/reward ratio.
Significant support has been identified around the 600 EUR level, reinforcing my confidence in a potential price rebound.
Long-Term Price Target:
My long-term price target remains at $1200, which I believe is achievable as the stock continues to respect its bullish trend. This target aligns with ASML’s historical growth trajectory and the robust potential of the tech sector.
Entry Timing:
The recent bounce off the internal trendline and the +1.66% daily gain signal positive accumulation and increased buying interest. I plan to go long now, taking advantage of the dynamic support, with a stop loss set just below 590 EUR to manage risk effectively.
ASML Holding offers a compelling investment opportunity, supported by a solid technical structure and clear bullish potential. The internal trendline, combined with horizontal support and the broader long-term uptrend, strengthens my confidence in entering a long position. With a $1200 target and a well-defined risk management plan, I believe this is the right time to position for the next leg up in this stock.

NVDA Stock Surge: A Technical Analysis PerspectiveBased on Elliott Wave (EW) 2.0 analysis and the Fibonacci retracement tool, NVDA has shown a significant bounce recently, indicating potential future gains.
Elliott Wave 2.0 and Fibonacci Insights
Using the advanced EW 2.0 theory, we have observed a retracement for wave 3, with NVDA bouncing impressively from the $90 mark. The Fibonacci retracement tool, which complements EW analysis, highlighted this key support level. This confluence of technical indicators suggests a robust bullish trend.
Target Price and Timeline
Based on this analysis, NVDA is projected to reach at least $140. This anticipated move aligns with the upcoming U.S. presidential election, providing a potential catalyst for continued momentum in the market.
Investors should consider these technical insights and market conditions when evaluating NVDA's potential. As always, it's important to conduct thorough research and consult with your financial advisor before making investment decisions.

NVDIA Don't miss this opportunity. Can even reach $240.NVDIA (NVDA) gave us the most solid buy entry back on our August 08 signal (see chart below), following a -35% decline:
Such declines are standard technical buy opportunities especially when taken place at the bottom (Higher Lows trend-line) of the 2-year Channel Up (since October 2022). As you can see, the stock made new All Time Highs (ATH) and as it remains below the middle of the Channel, the upwards potential is significant.
As long as the 1D MA200 (orange trend-line) supports, we remain bullish on our original long-term Target ($190.00) but now we feel confident to target by the start of 2025 the upper layer of the pattern, setting Target 2 at $240.00 (Fibonacci extension 3.0).
Note also that, as mentioned on our previous analysis, the current Bullish Leg continues to look very similar to the one that bottomed on October 2022. This is also evident on their 1D RSI fractals.
-------------------------------------------------------------------------------
** Please LIKE 👍, FOLLOW ✅, SHARE 🙌 and COMMENT ✍ if you enjoy this idea! Also share your ideas and charts in the comments section below! This is best way to keep it relevant, support us, keep the content here free and allow the idea to reach as many people as possible. **
-------------------------------------------------------------------------------
💸💸💸💸💸💸
👇 👇 👇 👇 👇 👇

Bearish Reversal in VanEck Semiconductor ETF (SMH)The NASDAQ:SMH ETF shows a significant price decline, with a recent drop of 5.40%, as highlighted by the red bar. This price action suggests a bearish reversal after hitting a high of 283.07. The current support level is around 200.49, marking an 18.88% drop from the recent high. Additionally, the Darvas Box indicates a range between 247.16 and 283.07, suggesting potential consolidation in this area before the next directional move. The downward trend aligns with overall market corrections in the semiconductor sector, which could present a short opportunity if price breaks below key support levels. Traders should keep an eye on macroeconomic factors influencing this sector, as well as earnings reports that might impact semiconductor stocks. NASDAQ:ASML

Target 784, around 7%FOllowing weekly chart and got a long signal from my indicator.
TP 784
SL close under 706 weekly close.

Little DipperBuying Support 'Supply/Demand' has dried-up.
Stay below the moving averages.
Even the Dividend did Not help.
Did Not participate in the Rally with the Rest of the mkt.
Another Dismal earnings upcoming.

Qcom Currently Qcom is ranging and positions at CMP should be avoided, as shown above buys or sells can be taken upon the break and retest of the key levels

MU, Can it do it?There is a lot of hype for this name on X
The trendline from 2023 bottom has been holding strong as support and now we have the 200EMA as well.
I will likely take a stab at it above 91 targeting 100

SMCI This is honestly the last stand.Super Micro Computer Inc. (SMCI) suffered yet another brutal sell-off following the announcement of a delay in filing its 10-K annual report. This may prove to be a catastrophic one as technically not only did it fail exactly on its 1W MA50 (blue trend-line) but also saw the stock test the bottom of its multi-year parabolic support, the Higher Lows Zone since the week of July 05 2022.
This was basically the last time the 1W MA100 (green trend-line) got tested with the current week coming the closest since then. The 1W MA100 last broke during the unexpected COVID flash crash in March 2020, so technically it is the stock's longest Support. If it fails to hold and SMCI closes a 1W candle below it, the long-term parabolic growth pattern is invalidated and we will risk testing the 1W MA200 (orange trend-line) at a price potentially around $250.00.
If on the other hand the 1W MA100 holds (and we will need the news sentiment to drastically reverse in order to achieve that, something that currently can't be seen on the horizon), then we can see another +400% long-term rally, in which case we estimate a Target around $2000, the stock's next critical psychological growth level.
-------------------------------------------------------------------------------
** Please LIKE 👍, FOLLOW ✅, SHARE 🙌 and COMMENT ✍ if you enjoy this idea! Also share your ideas and charts in the comments section below! This is best way to keep it relevant, support us, keep the content here free and allow the idea to reach as many people as possible. **
-------------------------------------------------------------------------------
💸💸💸💸💸💸
👇 👇 👇 👇 👇 👇

Is Intel's New Process Node a Game-Changer?Intel's latest reveal, the Intel 3 process node, promises to revolutionize the tech landscape with substantial performance and efficiency gains. But could this be the strategic breakthrough Intel needs to outmaneuver its competition?
Enhanced Performance and Density for Leading-Edge Computing
Intel's commitment to process technology leadership leaps forward with the Intel 3 process node, boasting an impressive 18% performance improvement and a 10% density increase over the previous generation. Tailored to meet diverse customer needs, Intel 3 offers four distinct variants, each optimized for specific applications, from high-performance computing to AI.
First Leading-Edge Foundry Node Drives Ecosystem Growth
Intel 3 marks a pivotal shift in Intel's strategy, as its first leading-edge process technology is made available to external customers through Foundry services. This move positions Intel as a key player in the foundry market, potentially reshaping the competitive landscape.
Manufacturing Readiness and High-Volume Production
Achieving manufacturing readiness in late 2023, the Intel 3 node has successfully transitioned to high-volume production, powering the Intel Xeon 6 processor family. This real-world application demonstrates its capability in server-grade computing solutions, solidifying Intel's technological prowess.
A Stepping Stone to the Future of Computing
As the final evolution of Intel's FinFET technology, the Intel 3 node provides a robust foundation for future advancements, paving the way for the forthcoming RibbonFET technology and the Angstrom era with Intel 20A and 18A process nodes.
Curious to know more about how Intel's latest innovation could impact the future of computing? Dive into the full analysis and uncover the potential ripple effects on the semiconductor industry.
