BUYING DIPS AND EATING CHIPS (Btc-Usdt)Last night….saw some uptrend but held my bearish position since $39,967 previously…….thought they had us in the first half not gonna lie. Now I will continue to push for lower threshold, unless people wake up on Monday’s and decide to buy but let’s see how stocks perform. Historically the week starts off bearish for stocks and ends the week bullish. But the world is unpredictable as ever nowadays. Buy those dips and Eat those Chips! (Using Pionex trading bots) currently up +22%
Chips

Intel at PCZ of Bullish Gartley with Bullish DivergenceI bought a little earlier at $50 not being sure if it would pullback to the PCZ but now that it's here i will be adding major size to the trade with my stop below X.

NVDA Downtrend.Looks like in downtrend.
hoping to hit ~270 range to support the earnings and post which it would come to ~200 range.
May be in FEB last to March timeframe.
Somehow I have feeling during this transient bear market almost all scripts would hit pre-pandemic levels.
Note : Not an investment/trading advise. Please do you own DD.

ACLS - Axcelis TechnologiesWould like a pullback into the 50-day line to get long ACLS.
Just had a beat and raise report and has ran up on huge volume since. The growth estimates are very good and the company operates in what may be the best area of the market, semiconductors.

NVDA Massive flagNVDA approaching breakout level.
If we don't see a rejections off the up trendline, there is a chance we go back to retest ATH.

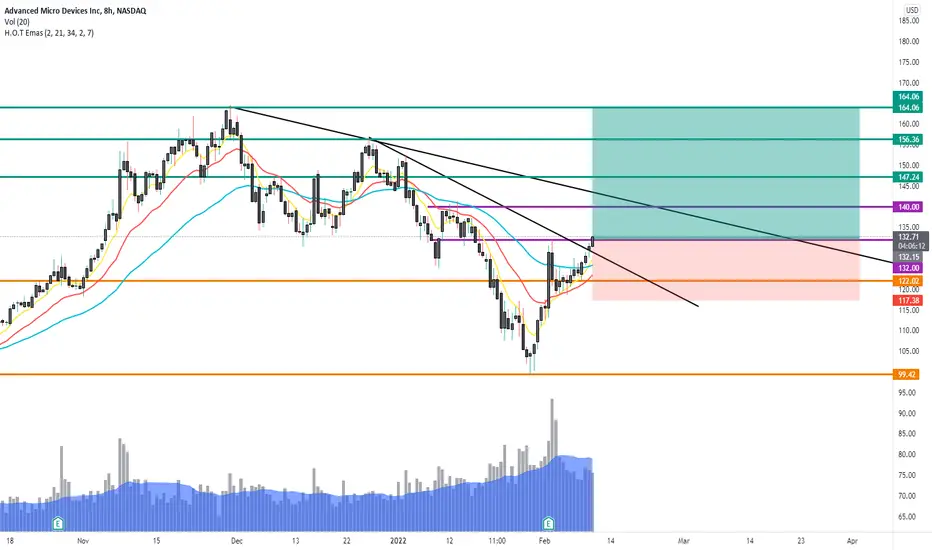
AMD breaking outNice set up and breakout today.
Lines on the upside are possible targets (resistances)
Tomorrow can be a catalyst to have this name flying towards ATH.
Advanced Micro Devices (NASDAQ: $AMD) Is Down 36% From ATH PriceAdvanced Micro Devices, Inc. operates as a semiconductor company worldwide. The company operates in two segments, Computing and Graphics; and Enterprise, Embedded and Semi-Custom. Its products include x86 microprocessors as an accelerated processing unit, chipsets, discrete and integrated graphics processing units (GPUs), data center and professional GPUs, and development services; and server and embedded processors, and semi-custom System-on-Chip (SoC) products, development services, and technology for game consoles. The company provides x86 microprocessors for desktop PCs under the AMD Ryzen, AMD Ryzen PRO, Ryzen, Threadripper, AMD A-Series, AMD FX, AMD Athlon, AMD Athlon PRO, and AMD Pro A-Series processors brands; microprocessors for notebook and 2-in-1s under the AMD Ryzen, AMD A-Series, AMD Athlon, AMD Ryzen PRO, AMD Athlon PRO, and AMD Pro A-Series processors brands; microprocessors for servers under the AMD EPYC and AMD Opteron brands; and chipsets under the AMD trademark. It also offers discrete GPUs for desktop and notebook PCs under the AMD Radeon graphics and AMD Embedded Radeon brands; professional graphics products under the AMD Radeon Pro and AMD FirePro graphics brands; and Radeon Instinct and AMD Instinct accelerators for servers. In addition, the company provides embedded processor solutions under the AMD Opteron, AMD Athlon, AMD Geode, AMD Ryzen, AMD EPYC, AMD R-Series, and G-Series processors brands; and customer-specific solutions based on AMD CPU, GPU, and multi-media technologies, as well as semi-custom SoC products. It serves original equipment manufacturers, public cloud service providers, original design manufacturers, system integrators, independent distributors, online retailers, and add-in-board manufacturers through its direct sales force, independent distributors, and sales representatives. Advanced Micro Devices, Inc. was founded in 1969 and is headquartered in Santa Clara, California.

QCOM will bleedRide the current trend. Or stay in cash till it drops to $130.
Put options are too expensive at the moment so its not worth doing PUTS.
If shorting fees are low then go ahead.
I'm heavy cash waiting for the market to reverse.
Expect the market to continue to bleed for a few more weeks.

$UCTT go long, potential outperformer in semi equipment spaceUCTT has begun to outperform the overall semiconductor industry represented by the etf SMH. The trend has clearly been broken on the weekly chart.
There has been a good amount of volume in this week so far, creating that very bullish weekly candle. Hoping we finish strong this week. Looking to create a position if it shows continuation.
EV/EBITDA ratios for the leaders in the semiconductor manufacturing equipment; as you can see UCTT has the best one since any EV/EBITDA below 10 is considered healthy.
8.2577 UCTT
16.5404 AMAT
19.0102 LRCX
18.1225 KLAC

AMD - Chinese chips decliningChinese chips are seeing shortages across the board
NASDAQ:AMD
XETR:AMD
BCBA:AMD
BMV:AMD
MIL:AMD
FWB:AMD
NEO:AMD
SWB:AMD
HAM:AMD
SIX:AMD
DUS:AMD
LSE:AMD3
FTX:AMDUSD

All the relevant levels on TSMTSM is the most significant and more relevant chip manufacturer in the world. Probably you have one of these chips in the computer you are using right now or maybe in your car. With all that said, let's take a look at the most important levels on the current chart.
* Yesterday (13/01/2021), TSM made a new all-time high (ATH) after 307 days of corrections inside a flag pattern and a decline of 24.33%
* Flag patterns are continuation structures; this means that after the breakouts, we tend to observe new impulsive movements in the same direction as the previous one.
What we will do now is explain possible bullish and bearish resolutions based on the levels we have:
BULLISH SCENARIO: The price has 3 levels we can use to consider closing positions: First fibo extension, cloned channel, second fibo extension (useful for swing and position traders). Assuming the price replicates the previous impulse that started in April 2020 and finished in February 2021, we should expect a movement of 330 days towards 204 (where the 2nd fibo extension and the cloned channel converge). Remember that when you are looking for big and extended movements you need to be open to corrections during your trade or investment (for example, on key levels)
BEARISH SCENARIO: The price is not able to surpass the resistance zone created by the previous ATH, and from here we observe a bearish movement towards the next target we have, "The ascending trendline) at around 119
Thanks for reading! feel free to add your ideas on the comments ;) Have a great weekend.

$AAPL Bearish FOMC Setup$AAPL follows $SPY almost to a tee with wicks and candles. The orange line is $SPY overlayed on top of the AAPL chart. $AAPL is in a descending channel and a break under the 174.43 level with a $SPY confirmation has a level from 174.43 to 172.31. Puts under this level have potential to fall all the way to the 170.34 level.

BABA 2022 LongT1 is ~123 first level, but has potential to reach T2 around 131 - 132 before the end of January.
The ADRs are more about 'what is happening with China regulation' more than anything else. HOWEVER, BABA has one of the best abilities long-term in my opinion. The earnings have been great and their ability to evolve will surely happen -- just as it has with Amazon (AMZN). The big difference is BABA will have the capability to change the landscape by becoming competitive with Apple (AAPL) through chip manufacturing and potentially acquiring companies that compliment companies here in the U.S., who are dependent on specific technologies.

looking for entry points on $AMDAMD still has a long runway until INTC starts to crank out chips from the 2 fabs in Arizona. Looks like there is a little bit more give in AMD but it could result in better entry points.
RSI looks like it could fall more before it truly becomes oversold on the daily.
MACD curling up for a potential cross.

Long NVDA HereBeautiful consolidation is occurring here with $NVDA after the Fed clarified tapering decisions today.
Nice bounce off the 0.618 Fib level with RSI curling back up as well after hitting lows on the daily timeframe. It appears to be a great entry if NVDA can clear the 0.786 Fib level next.
Just my personal opinion, not investment advice!

My 5cents about AMD short term tradingIt seems like AMD has break the tunnel and continue going upwards, although tapering and interest rate hike kicking in, I believe it will still have momentum to continue moving up and beyond. however, for a shorter term trading strategy, I just use the tunnel height as a target.

TINTINTINTINCheatsheet for Tin. Tin futures plus the only three 'real' equity postions one can consider


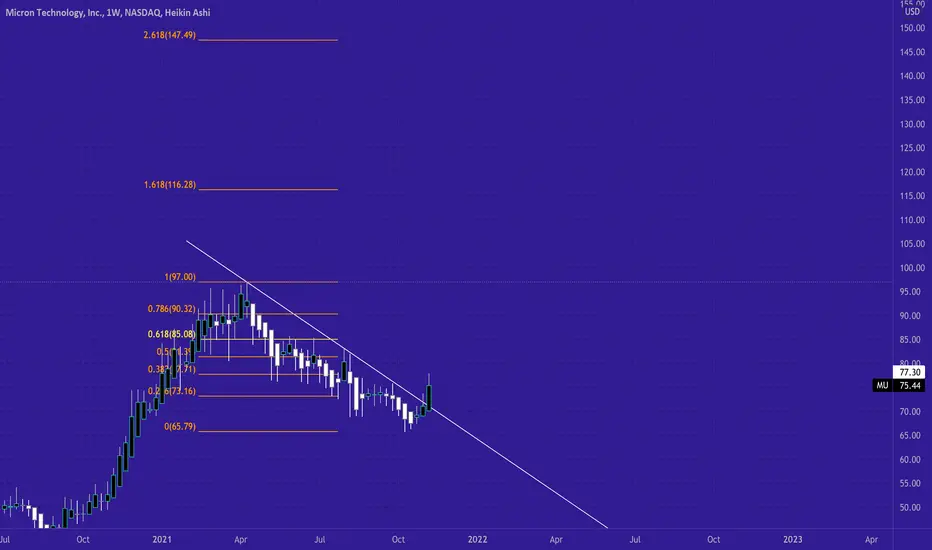
MUMicron is a long based off the technical breakout on the weekly timeframe.
Targets lower 80 area and above there possibly 100.
Chips have been running like crazy, does it continue?
AMD Short Setup - 1st Ever Mean ReversionI look at this stock over its lifetime and cannot, for the life of me, find a single mean reversion.
I thought to myself, "hmm, maybe I'm missing something?"
I took the log scaling off and immediately thought otherwise.
Short and wouldn't wait too long.
-De-visivePigShort
NASDAQ:AMD
CURRENCYCOM:US100
TVC:NDX
TVC:IXIC
CME_MINI:NQ1!

INTC - Provides Intel on the State of Affairs in MANUAfter a run ahead of EPS, the 46.07 ended up another Ghost in the ALGO Machine.
EPS for Intel, another Disasater after FAB MANU ASML's ugliness, Lucky for ASML
the Dippers were all too anxious to Bid it back up erasing 1/2 its losses from
805.
Earnings Season has added more complexity to the Mix.
NQ made a run for the top of the Range @ 15513/17 - only to unload to its
Prior close by ZERO.
It gave back all the gains on INTC... all of them.
These are the challenges to EPS, volatile and setting up for the unseemly news
from Chips. Today's Intel Dip buyers were dunked to the 52.50 Level on the DOM,
the scene of prior High Crimes and Felonies.
As Semi's continue to report, they will continue to reveal Q3 was indeed a disaster,
lots of Fudge, no Walnuts.
Today's EPS was TECH heavy, tomorrow is Freaky Friday - the most overused Day
of the Week to Crush the VX Complex.
With the 400 Ticks of CF ahead, it will, no doubt be challenging.
Trade Safe, it is very dangerous at present.
Timeframes are in Conflict, complete conflict. Weeks end will begin to resolve this
when we see where the Weekly Candle closes. Last Week's close = 15134.50.

AMD flag formationThe US markets have taken a beating over the last few weeks but as sellers start to reside we could see some short term recoveries across the market on some strong players.
Im watching AMD closely with this flag formation, not ruling out a drop back further yet before a bounce but the market structure is set for a continuation
Fib levels from the last bullish rally are being respected so targeting the 1.272 extension of around 130+ over coming months

$AMD | WEEKLY WATCHLIST 9/27AMD has been quite frustrating throughout this wave 4 pullback. Possible we see a breakout of this extended bullish falling wedge to play upside in the next 1-2 weeks. Looking to retest the $114 level, above that we get a larger breakout to ATHs.
However if we reject the falling wedge resistance here, possible we see waves D and E to complete an ABCDE corrective wave, rather than the proposed ABC above.
Will go cautiously long over $107.
