Smart Money Sell Setup on Gold (15-Min TF)# Smart Money Sell Setup on Gold (15-Min TF)
### 🔍 Market Context:
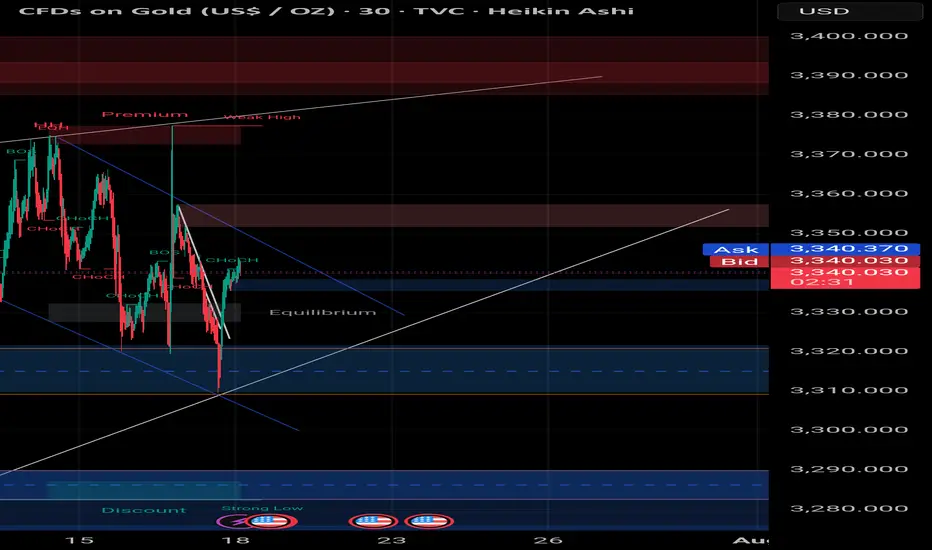
Gold has recently formed a strong bullish retracement after a sharp impulsive bearish move. Now, price has returned to a critical zone — the **Equilibrium level (EQ)** — which also aligns with a **valid supply zone** and **bearish trendline resistance**.
This zone is often considered the "decision point" where Smart Money evaluates whether to continue upward or resume the previous bearish trend.
---
## 📉 Strategy: Sell Limit Based on Structure + Liquidity
### ✅ Entry Zone:
**3341.500 – 3343.000**
(At the EQ zone + premium pricing area)
### 🛑 Stop Loss:
**Above 3345.000**
(Just beyond the last liquidity wick and top of supply)
### 🎯 Take Profit Targets:
- **TP1:** 3338.000 → First demand zone
- **TP2:** 3332.500 → Liquidity sweep target under previous lows
### 📐 Risk to Reward Ratio:
**1:3 or higher**, depending on execution precision.
---
## 🔎 Confluences Supporting the Setup:
| Factor | Confirmation |
|--------|--------------|
| EQ Zone (50% of previous move) | ✅ |
| Supply Zone | ✅ |
| Bearish Trendline Resistance | ✅ |
| Liquidity above EQ | ✅ |
| CHoCH + BOS (Market Structure Shift) | ✅ |
---
## 🧠 Why This Setup Works:
This is a classic **"Premium Price Rejection"** in a bearish environment, combining:
- Institutional logic (EQ level)
- Structural resistance (previous BOS)
- Liquidity traps above
---
## 🧵 Summary:
- **Sell Limit:** 3341.5 – 3343
- **SL:** 3345
- **TP1:** 3338
- **TP2:** 3332.5
- **RR:** 1:3+
- **Style:** Smart Money / Liquidity + Structure Based
---
🔔 **Disclaimer:** This is not financial advice. Always do your own analysis and manage risk accordingly.
#gold #XAUUSD #smartmoney #tradingview #liquidity #supplydemand #priceaction #forex #structure
Choch-bos-strategy
How to use Dynamic Market Structure to track market moves🔍 Idea Overview
This chart demonstrates the effectiveness of the Dynamic Market Structure Indicator in live conditions, capturing key Break of Structure (BoS) and Change of Character (ChoCH) points. Each zone dynamically adapts based on price behavior and helps identify crucial turning points.
📌 Highlights from the Chart
• ✅ Early BoS detection led to accurate identification of the bullish breakout before the major rally starting May 7.
• ✅ Multiple successful ChoCH zones indicated potential reversal areas and pause zones during sideways consolidation.
• ✅ The green (BoS) and red (ChoCH) horizontal zones aligned perfectly with price reaction levels, acting as reliable support/resistance.
• ✅ During the pullback post-high, the indicator caught clear bearish ChoCH before price dropped nearly $2,000, showing high responsiveness.
📊 Summary of Performance
• Rally captured from ~95,000 to ~104,000 with early BoS signals.
• Sideways zones around 103,000–104,000 marked with structural shifts that predicted stalling.
• Post-drop behavior accurately highlighted re-test of ChoCH zones before reversal attempts.
⚙️ Indicator Logic (Brief)
• BoS (Green): Confirms trend continuation when structure breaks in the direction of the trend.
• ChoCH (Red): Signals a potential trend reversal with key level break.
No repainting. Zones are locked once confirmed.
In volatile markets like BTC, accurate detection of structural shifts can define risk and opportunity. This indicator consistently tracked evolving zones and highlighted major inflection points — without lag or overfitting.

Looking LongEUR/JPY has finally shown a Break of Structure within the higher timeframes. This gives me clear indication that the CHOCH yesterday was correct. Thus I should be looking for buyging positions.
