CHRUSDTsee and watch :)
After the defeat of the resistance range, it has pullback that range and seems to be ready for another bullish rally ...
CHR

CHR retested previous ATH as supportPossibly a nice DOJI reversal going to form tonight to continue to uptrend very soon.
First TP around 1.18 and then 1.75 ish level.
All current profits will stream into DOT from my side to add one final stack during the last possible day of crowdloans.


CHR/USDT is under selling pressure ?As per chart, it looks short signal according to indicator and chart techanical data. targets are mentioned on the chart and taking entry from the support would be safer if btc shakes the market at 63K
#NFA
#DYOR
#TradeSafe

CHR, WE DID IT! :)Yes. Here is one of the top-mentioned scenarios for CHR. No indicator and confusing thing! Just enjoy life with trading simply...
+80 Growth!!!

CHR trapped retail on top now its Anxiety phase next denial fearIt clearly formed clear Head and shoulders. now buyers are in anxiety phase , soon to denial phase than fear n desperation phases open small short position to capture 10-15% down side .
GL NFA

CHR/USDTCHR is in accumulation for more than 6 months now , expect a breakout in coming days.
Also weekly downtrend is broken now :
Bought here , Targets on chart.

CHR 300%+ GAINS AHEAD!Head and shoulders pattern formed on Daily, (more like cup and handle on weekly), and broke the daily and 2 day zone with a very strong bull candle. Price is a little choppy right now for shorter term entry, so best play is to just put a position in and hold bc the gains on this are going to be ridiculous. Over 100% away from first fib level! and over 300% away from the 3.618, which based on past price is most likely where we will see it go to before a longer term retest.
**This thing is an ABSOLUTE GEM**
DYOR

chrCHR /USDT
SPOT/x3
🌳 BUY : below 0.72 $
🎯 TARGETS on the chart
{tp1 : 55%}
{tp2 : 80%}
⚠️ STOPLOSS : DAILY CLOSE BELOW 0.57 $

chrCHR/USDT
SPOT/x3
🌳 BUY : below 0.72 $
🎯 TARGETS on the chart
{tp1 : 55%}
{tp2 : 80%}
⚠️ STOPLOSS : DAILY CLOSE BELOW 0.57 $

$CHR/BTC 3D (Binance Spot) Falling wedge near breakoutChromia is holding above 100EMA support and looks ready for another bull-run!
More information about that NFT patform, also a DeFi / BSC token on chromia.com
Current Price= 0.00000592
Buy Entry= 0.00000590 - 0.00000536
Take Profit= 0.00000785 | 0.00000946 | 0.00001129
Stop Loss= 0.00000452
Risk/Reward= 1:2 | 1:3.45 | 1:5.1
Expected Profit= +39.43% | +68.03% | +100.53%
Possible Loss= -19.72%
Fib. Retracement= 0.382 | 0.618 | 0.883
Margin Leverage= 1x
Estimated Gain-time= 5 months

CHR - NFT Boom Activate 🚀300%+🚀CHR is a fantastic NFT ecosystem that has had some dealing with the united states airforce in the past - makes you wonder why it hasn't taken flight yet.
Well it looks like we're about to leg up hard - breakout has already happened, retrace has already happened, and gratuitous spending is about to happen when it comes to the BPT subscriber base.

CHR/USDT /SAVE USD FOR NEXT WEEKTHIS IDEA IS THATS TO SHOW YOU 2 CASES SO FOR ME IM OUT FROM THE MARKET .
Thank you and Good Luck!
Attention: this isn't financial advice we are just trying to help people on their own vision.

CHR USDT- CHR has cross trend line and now retest it now
- 0.478 is a strong resistance
- positive H&S

CHR, HIGH POTENTIAL...!I really love chr that how is moving upward! Be careful that we have a strong resistance zone.
-Go ahead-

CHR/USDT TRADE SETUP!Hello everyone, if you like the idea, do not forget to support with a like and follow.
CHR looks good here and hovering near the bottom of the trendline. It is currently trading inside a triangle. When it breaks the triangle it can pump well.
Entry range:- $0.3485-$0.3585
Target1:- $0.3710
Target2:- $0.3882
Target3:- $0.4120
Target4:- $0.4344
SL:- $0.3288
Leverage:- 3x-5x
If you like this idea then do appreciate it with like and follow.
Also, share your views in the comment section.
This isn't financial advice. DYOR before investing.
Thank You!

CHR reverse head and shoulders#CHRUSDT
$CHR broke out the upper line of falling wedge and touched the first resistance zone as I expected, current support is around $0.35 that may touch another time then go upward to reach $0.5. in weekly time frame I can see a inverted head and shoulders pattern that $0.5 is its neck line, a break above this resistance can lead price toward $0.79 that is the target of head and shoulders.
$CHRUSDT EW prediction- shortterm it may play this way - $CHR $CHRUSDT EW prediction- shortterm it may play this way

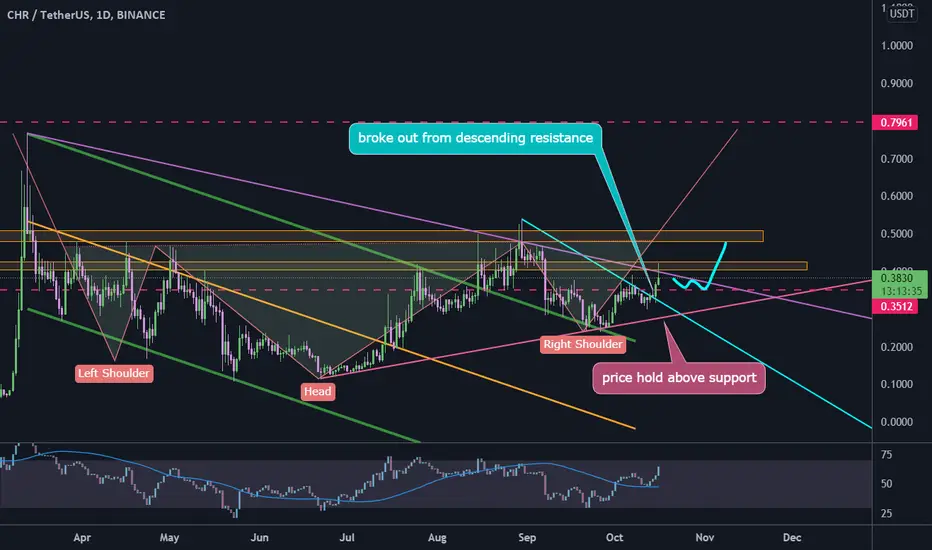
CHR broke out resistance#CHRUSDT
$CHR broke out from descending resistance line and hold above the ascending support, a break above the next descending resistance can head up price toward $1 in long term.

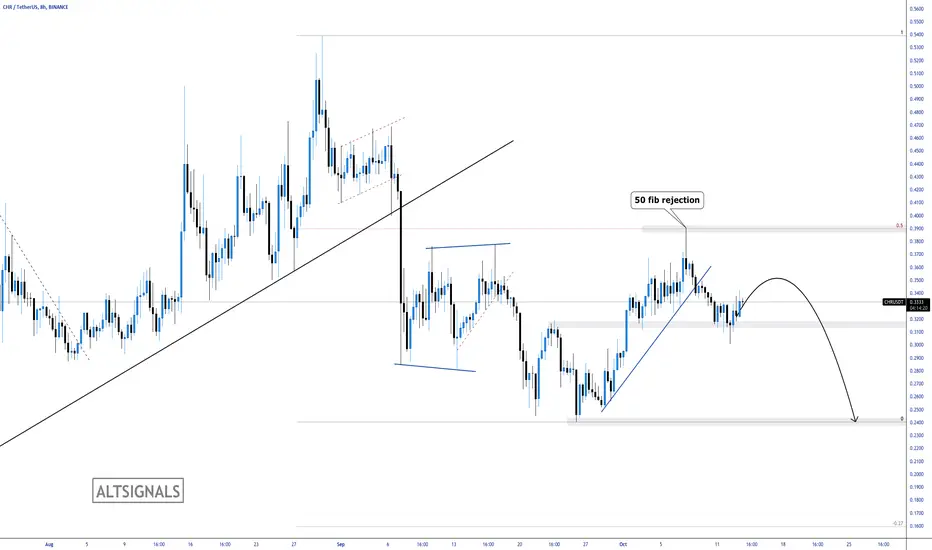
CHR - Key LevelsChromia is trading within 3 key levels. We recently rejected the 50 fibonacci before breaking down out of a short term bullish trend.
We are looking for further bearish momentum back to the 0.24 level.
Watch for bear flags and take Chromia down.
CHRUSDTAs chr break the resistance and retested it, it's my grow up to the next support, if it doesn't loose this zone.
This is just an idea
Not financial advice

CHRUSDT Daily TimeframeSNIPER STRATEGY (new version)
It works ALMOST ON ANY CHART.
It produces Weak, Medium and Strong signals based on consisting elements.
NOT ALL TARGETS CAN BE ACHIEVED, let's make that clear.
TARGETS OR ENTRY PRICES ARE STRONG SUPPORT AND RESISTANCE LEVELS SO THEY CAN ACT LIKE PIVOT POINTS AND REVERSE THE WAVE (or act like a mirror that can reflects light) BASED ON STRENGTH OF THAT LEVEL.
ENTRY PRICE BLACK COLOR
MOST PROBABLE SCENARIOS TARGETS GREEN COLOR
LEAST PROBABLE SCENARIOS TARGETS RED COLOR
DO NOT USE THIS STROTEGY FOR LEVERAGED TRADING.
It will not give you the whole wave like any other strategy out there but it will give you a huge part of the wave.
The BEST TIMEFRAMES for this strategy are Daily, Weekly and Monthly however it can work on any timeframe.
Consider those points and you will have a huge advantage in the market.
There is a lot more about this strategy.
It can predict possible target and also give you almost exact buy or sell time on the spot.
I am developing it even more so stay tuned and start to follow me for more signals and forecasts.
START BELIEVING AND GOOD LUCK
HADIMOZAYAN

CHR, NEW UPDATE !!!CHR could break the resistance and reach our targets successfully. So, we need a rest before another bullish movement.
