Chromia Loading up for a big moveHere's a quick Look at CHR daily chart. As we can see, the price has been forming a bigger descending triangle and a break to the upside could be around the corner! The best entry would be, when the price breaks above the descending triangle with good amount of volume. Definitely one to keep an eye on.
-------------------------------------------
The idea is: Buy the breakout from the descending triangle and take profits at the levels shown in the chart.
Targets:
1. 0.97$
2. 1.2$
3. 1.5$
4. 2$
-------------------------------------------
What are triangles when it comes to trading?
Key points:
"1. In technical analysis , a triangle is a continuation pattern on a chart that forms a triangle-like shape.
2. Triangles are similar to wedges and pennants and can be either a continuation pattern, if validated, or a powerful reversal pattern, in the event of failure.
3. There are three potential triangle variations that can develop as price action carves out a holding pattern, namely ascending, descending, and symmetrical triangles."
-------------------------------------------
If you like the content, then make sure to comment and like the post :D
Follow me for daily profitable trading setups
BTC dictates the market. If BTC falls, then Alts will fall as well. Trade safe!
Chromia

CHR short or long? (update)Black Mountain Analytical Team:
We will wait for the price reaction to the Resistance line and the static Resistance range. After the price reaction, we can enter.
We are currently monitoring it to catch it in the first price movements.
TREND LINE-Resistance area
Wait for the reaction to Trend
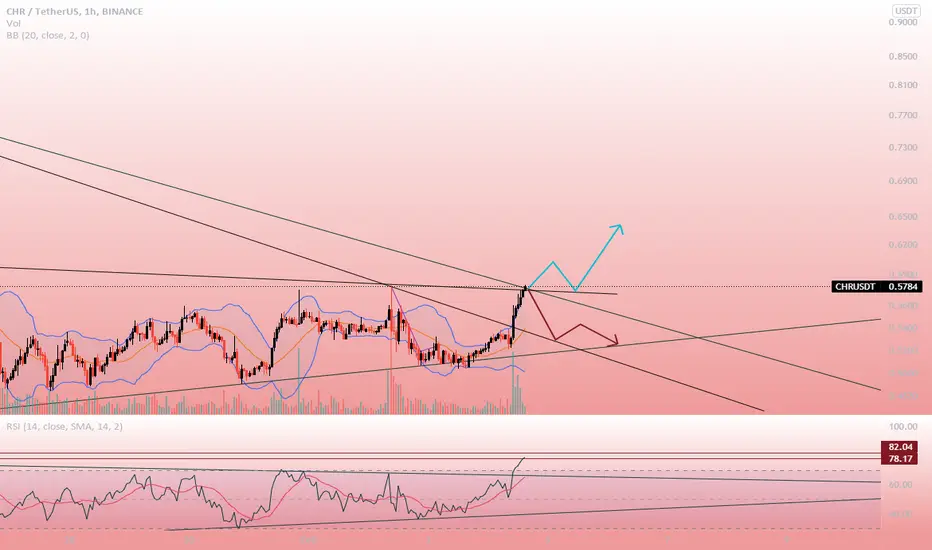
CHR LONG ??Black Mountain Analytical Team:
We will wait for the price reaction to the trend line and the static support range. After the price reaction, we can enter.
We are currently monitoring it to catch it in the first price movements.
TREND LINE
Wait for the reaction to Trend


CHROMIA , CHRUSDT 1DLets PUMP it !
All supports and resistances are marked on the chart. As we can see, the price is in an important range and recommended to keep an eye on it ...
Follow our other analysis & Feel free to ask any questions you have, we are here to help .
📊 #CHRUSDT ( Chromia )
💹 Time Frame : Daily
🔵 Personal Opinion : HODL
👤 Saeid.Mahbob
📅 01.31.2022
❤️ If you apperciate my work , Please like and comment , It Keeps me motivated to do better ❤️

CHRUSDTHello Crypto Lovers,
Mars Signals team wishes you high profits.
we are in the daily time frame. There is the S1 support line which has supported the price. If it holds, it can move up to the R1 resistance and then R2. You can buy it here or you can also wait for it to touch S1 and buy there.
Warning: This is just a suggestion and we do not guarantee profits. We advise you to analyze the chart before opening any positions.
Wish you luck


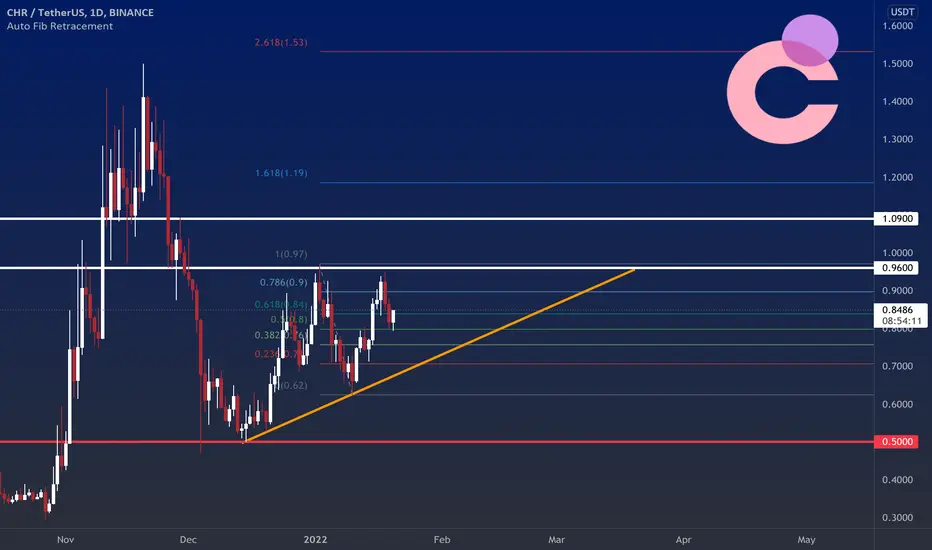
CHROMIAOn a daily TF, the trend is negative, and the upward movement is weak. If it breaks $ 0.96 resistance, the target of $1.09 will be activated. If it stabilizes above $1.09, it will be an uptrend; Otherwise, wait for the $ 0.50 level retest.
Chromia: BearishChromia bounced off the resistance level. Asset broke trough off the lower boundary of ascending channel. Decline to support level at 0.63 is expected to happen.


CHR for the ⭐ 🚀 300% in sightCHR breaking out on the indicators, getting set for ATH
This pattern has possibility of over 300% profit.
Follow me so you can get early exit signal.
Remember to like, share and follow for more timely analysis.

Chromia : Metaverse 2022 🎉Chromia is a project designed to combine the best of two worlds: the convenience and reliability of relational databases and the cryptography-based security of blockchain.
I believe that this gives the project strong fundamentals and a promising future.

Chromia Loading up for new ATH! Keep an eye on this oneHere's a quick Look at CHR 6 hr chart. As we can see, the price has printed a bigger Cup & handle pattern and and a break above 1$ could lead to a revisit of previous ATH! CHR has been doing well while the rest of the market has been down. Its just about time when we see a New ATH for this coin! Definitely Keep an eye on this!
The best entry would be, when the price breaks above 1$ with good amount of volume .
-------------------------------------------
The idea is: Buy when the price breaks above 1$ and take profits at the levels shown in the chart.
Targets:
1. 1.08$
2. 1.2$
3. 1.5$
4. 2$
-------------------------------------------
If you like the content, then make sure to comment and like the post :D
Follow me for daily profitable trading setups
BTC dictates the market. If BTC falls, then Alts will fall as well. Trade safe!

Long $CHRChromia is in the ascending channel. I expect consolidation above MA20 level (with possible short-term decrease under the moving average) with the subsequent growth to the upper boundary of the channel.
As support we have MA20 and also the trend line
Resistance is at levels: 0.96 - 1.12
Always consider the state of the market.

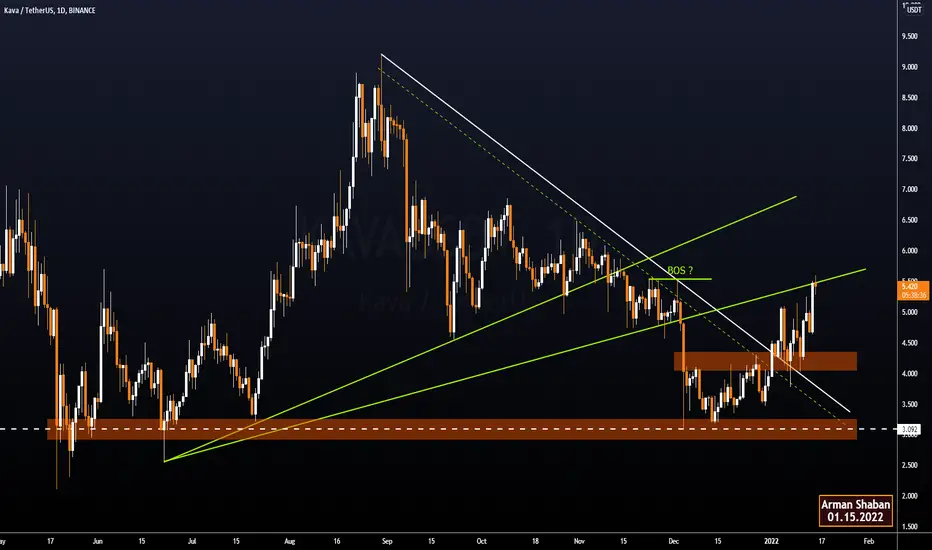
KAVAUSDT Daily TA : 01.15.22 : $KAVAAll supports and resistances are marked on the chart. As we can see, the price is in an important range and recommended to keep an eye on it ...
Follow our other analysis & Feel free to ask any questions you have, we are here to help.
⚠️ This Analysis will be updated ...
👤 Arman Shaban : @ArmanShabanTrading
📅 15.Jan.22
⚠️(DYOR)
❤️ If you apperciate my work , Please like and comment , It Keeps me motivated to do better ❤️
Conditional Long Trade on $CHRA possibly forming head and shoulders pattern in $CHR.
The neck line is encountered with the 200 exponential moving average. Also the trend line crossing in the RSI increases the likelihood of success of the trade.
A good entry is crossing 0.7500 and the the target is 0.7840.
SL for me is 0.7400.
Good Luck.

Chromia buy opportunity- Overal market structure is bullish with higher highs and lows
- Touched the trendline that dates from late september 2021
- Faked the green support zone
- Bullish candles: bearish body with long lower wick followed by bullish engulfing and three white soldiers. This made for a good move last time around (compare the blue arrows)
- MACD crossover about to take place
- Broke above the 50 EMA
Setting my SL just below the EMA. Taking the $0.93 level as a conservative target. Where the $1.42 level is a more aggressive target. Given the state of the market I would advice caution though when taking this trade.

CHRAnother longer term swing trade.
Entry1: Above $0.78
Entry2: $0.7370 to $0.76
TPs: $0.95, $1.22, $1.41
SL : $0.72

CHRUSD FALLING WEDGE PATTERNCHR/USDT
FALLING WEDGE DETECTED
Breakdown confirmation from the pattern
We can spread entry or wait the target
Becareful guys!
MARKET STILL NOT GOOD

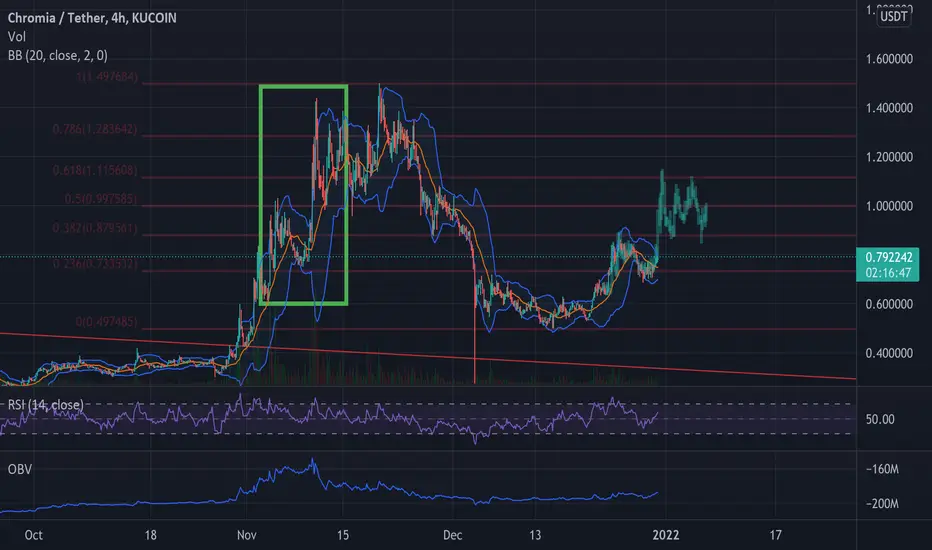
Could this pattern repeat on Chromia?Chromia has been doing pretty well after recovering from the december lows. Holding well in this dip and already gaining upwards momentum.
I couldnt help but realise this pattern re occur (one in green rectangle). if you look closer it is very similar and if it plays out could signify a local top at the 618 level of the current fib retracement from the dip.
Furthermore the red line you see all the way down is a trend line that exists from previous ATH to subsequent tops and once that broke CHR flew like there is no tomorrow.
The recent crash wick retested this line so it is possibly a nice confirmation of upward move.
CHRUSDT - SHORTThere is a short position in CHRUSDT Chromia
CHRUSDT Chromia
🔴Short Now or set on Key Level 0.8350
🟢Target 1 0.7760
🟢Target 2 0.7155
❌Stop loss 0.8550
#K_Level
Please support our activity with your likes and comments.
