CHR on a bullish tearOver the past week Chromia has gone up 80%, but I believe there might be more in this ons. At this stage of the market cycle we shouldn't be suprised to see 2x or more moves.
Bullish:
- Touching on the -0.618 FIB (daily level)
- Strong bullish divergence on the MACD
- Descending wedge
- On a support level
Bearish:
- EMA's moving closer together
- Price has used the 50 EMA beautifully as support over the past weeks (red arrows) but has now broken below it. Will this mean that it'll also serve as strong resistance?
Setting my stop loss just below the most recent swing low and the 200 EMA.
How do you feel about this setup?
Chromia

CHR could continueChromia came to our -1.618 FIB level to give us our profit targets. If you're looking for a play here, this might be the setup for you.
- Retracement to the -1.618 level we had already alligns with the .382 FIB level we can draw from the recent run
- Bullish divergence already on the RSI (could increase)
- Stop loss set below most recent swing low, support zone and golden pocket.
Safe trading y'all

On the rise.Chromia has proped up 40 percent and looks to be in a penant which will push it back into the upward channel. Follow for daily posts!

CRYPTO : CHRUSDT (Daily). Let's Run ??CHRUSDT try to break the ATH level and during the process before, it broke from the symetrical triangle. The first level support is at A, but i think it need consolidation first for more confirmation (?). The next support is at level B. Remember to have a stop loss plan :D.

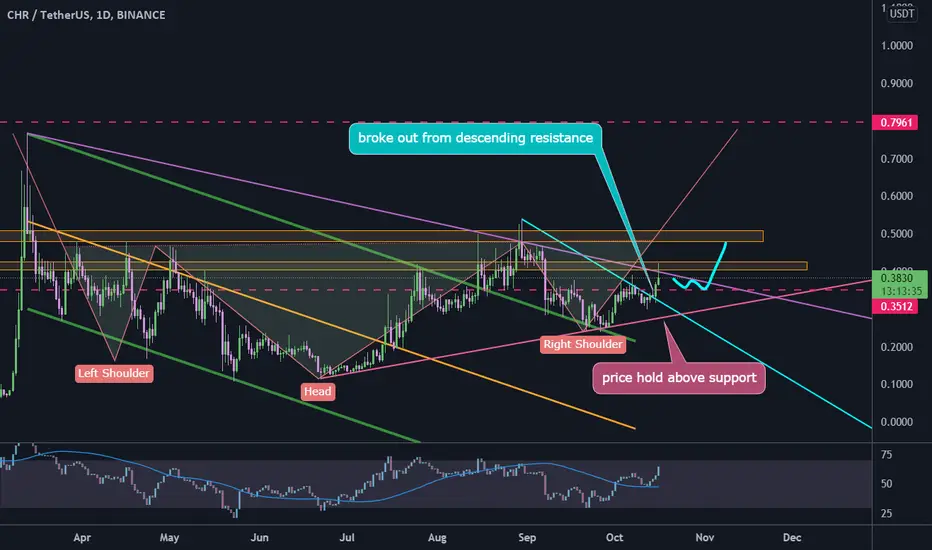
CHR 300%+ GAINS AHEAD!Head and shoulders pattern formed on Daily, (more like cup and handle on weekly), and broke the daily and 2 day zone with a very strong bull candle. Price is a little choppy right now for shorter term entry, so best play is to just put a position in and hold bc the gains on this are going to be ridiculous. Over 100% away from first fib level! and over 300% away from the 3.618, which based on past price is most likely where we will see it go to before a longer term retest.
**This thing is an ABSOLUTE GEM**
DYOR

$CHR/BTC 3D (Binance Spot) Falling wedge near breakoutChromia is holding above 100EMA support and looks ready for another bull-run!
More information about that NFT patform, also a DeFi / BSC token on chromia.com
Current Price= 0.00000592
Buy Entry= 0.00000590 - 0.00000536
Take Profit= 0.00000785 | 0.00000946 | 0.00001129
Stop Loss= 0.00000452
Risk/Reward= 1:2 | 1:3.45 | 1:5.1
Expected Profit= +39.43% | +68.03% | +100.53%
Possible Loss= -19.72%
Fib. Retracement= 0.382 | 0.618 | 0.883
Margin Leverage= 1x
Estimated Gain-time= 5 months

CHR long#CHR broke through the mid-term trandline which is also the resistance of the symmetrical wedge. In case of daily candle close above the trendline - bullish movement is expected to reach the #ATH in few next weeks

CHRUSDT CHR was pumped yesterday and now took hold the trendline check the chart.İts not a financial advice.DYOR

CHR reverse head and shoulders#CHRUSDT
$CHR broke out the upper line of falling wedge and touched the first resistance zone as I expected, current support is around $0.35 that may touch another time then go upward to reach $0.5. in weekly time frame I can see a inverted head and shoulders pattern that $0.5 is its neck line, a break above this resistance can lead price toward $0.79 that is the target of head and shoulders.
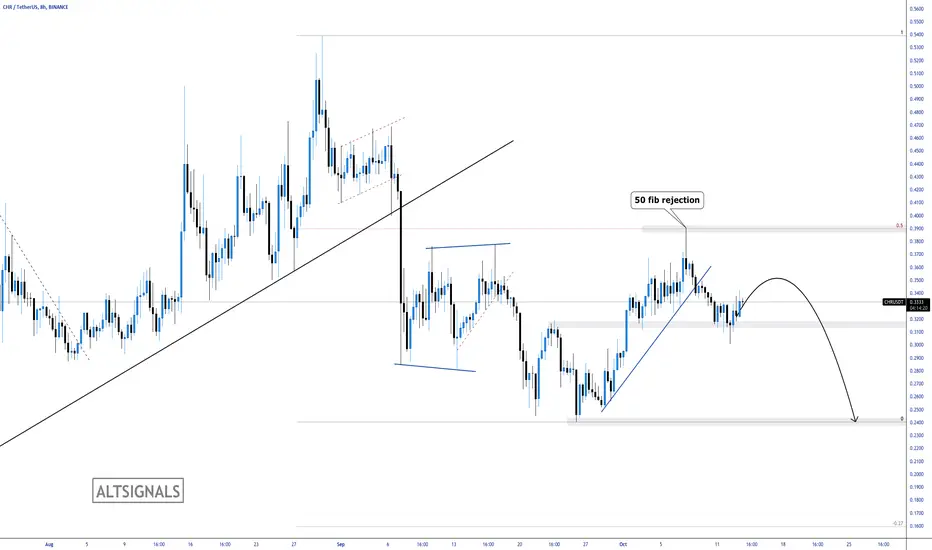
CHR - Key LevelsChromia is trading within 3 key levels. We recently rejected the 50 fibonacci before breaking down out of a short term bullish trend.
We are looking for further bearish momentum back to the 0.24 level.
Watch for bear flags and take Chromia down.
CHRUSDT Daily TimeframeSNIPER STRATEGY (new version)
It works ALMOST ON ANY CHART.
It produces Weak, Medium and Strong signals based on consisting elements.
NOT ALL TARGETS CAN BE ACHIEVED, let's make that clear.
TARGETS OR ENTRY PRICES ARE STRONG SUPPORT AND RESISTANCE LEVELS SO THEY CAN ACT LIKE PIVOT POINTS AND REVERSE THE WAVE (or act like a mirror that can reflects light) BASED ON STRENGTH OF THAT LEVEL.
ENTRY PRICE BLACK COLOR
MOST PROBABLE SCENARIOS TARGETS GREEN COLOR
LEAST PROBABLE SCENARIOS TARGETS RED COLOR
DO NOT USE THIS STROTEGY FOR LEVERAGED TRADING.
It will not give you the whole wave like any other strategy out there but it will give you a huge part of the wave.
The BEST TIMEFRAMES for this strategy are Daily, Weekly and Monthly however it can work on any timeframe.
Consider those points and you will have a huge advantage in the market.
There is a lot more about this strategy.
It can predict possible target and also give you almost exact buy or sell time on the spot.
I am developing it even more so stay tuned and start to follow me for more signals and forecasts.
START BELIEVING AND GOOD LUCK
HADIMOZAYAN

🆓Chromia (CHR) Sep-30 #CHR $CHRThe buying force appeared at 0.25$ zone and CHR could move towards 0.36$ and 0.5$ zones. But if it loses 0.25$ zone, it will fall sharply to 0.2$ zone
📈RED PLAN
♻️Condition : If 1-Day closes ABOVE 0.25$ zone
🔴Buy : 0.25$
🔴Sell : 0.36$ - 0.5$
📉BLUE PLAN
♻️Condition : If 1-Day closes BELOW 0.25$ zone
🔵Sell : 0.25$
🔵Buy : 0.2$
❓Details
🚫Stoploss for Long : 10%
🚫Stoploss for Short : 5%
📈Red Arrow : Main Direction as RED PLAN
📉Blue Arrow : Back-Up Direction as BLUE PLAN
🟩Green zone : Support zone as BUY section
🟥Red zone : Resistance zone as SELL section
🅰️A : The Close price of 1-day candlestick is Above the zone
🅱️B : The Close price of 1-day candlestick is Below the zone

CHR/USDT
Wait the 29 September there is an action On Chromia
Targets
T1:0.41
T2:0.53
T3:0.6437
T4:0.7542
T5:0.8667

CHROMIA/USDTChromia is looking really nice and ready for a move up, we might be done dipping on this one but there's still the possibility of wicking the green box which is why I recommend setting some lucky orders over there just in case!
Take profits at the blue box if you would like, I personally recommend securing some profits there to readd if it provides a decent pull back.
If not interested in swing trading just close out your whole position at the red box!

Chromia is Ready!currently in a symmetrical triangle, got rejected at the 0.618 fib and found support one the 100 day MA. The optimal zone to buy will be in the green square above the 0.236 fib in the coming days. From there I expect a breakup
I hope you found the idea interesting;)

CHR soon will break the resistance Car now is facing 0.48$ as a resistance .. once break the first target will be 0.7$
then retest the 0.48$ before start the trip to 5$

CHR/USDT LongCHR charts looks very good
Finished from wave 2 and soon will start the trip of wave 3 which will target 2.3$
After that maybe we will face a correction to wave 4 which will target 1$
Then target 4.5/5$ the end of the trip

$Chromia big breakout coming...Chromia is an open-source public blockchain conceived of by Swedish company Chromaway AB. The Chroma token (CHR) was launched in May of 2019. The technology behind the Chromia blockchain is adapted from an earlier technology called ‘Postchain’, a solution provided by Chromaway AB for enterprise clients.
$Chromia big breakout is coming!

$CHR/BTC 4h (Binance Spot) Falling wedge near breakoutChromia has formed a bullish pattern and looks ready to break-it, but we may see a last pull-back to 100EMA first.
Current Price= 0.00000871
Buy Entry= 0.00000838 - 0.00000806
Take Profit= 0.00000926 | 0.00001012 | 0.00001132
Stop Loss= 0.00000739
Risk/Reward= 1:1.25 | 1:2.29 | 1:3.73
Expected Profit= +12.65% | +23.11% | +37.71%
Possible Loss= -10.10%
Fib. Retracement= 0.618 | 0.893 | 1.272
Margin Leverage= 1x | 2x
Estimated Gain-time= 2 weeks

Retracement and then upRetracement and then up. it’s a new uptrend, and looking for an opportunity for a buys setup, on the retracement level shown in the charts

Triangle breakoutTriangle breakout and slightly down to the support you after you go to the resistance drawn

CHR updateChromia going to breakout the resistance
Market Cap $193,438,518
24 Hour Trading Vol $54,012,762
Fully Diluted Valuation $340,939,262
Circulating Supply 567,369,439
Total Supply 567,369,439
Max Supply 1,000,000,000

🆓Chromia (CHR) Aug-7 #CHR $CHRThe buying force appeared at $0.3 area, this is an important support area of CHR because it will decide the next trend of CHR. If CHR doesn't lose this zone, it will rise sharply to $0.4, $0.48 or even $0.7 this August. But if it loses this $0.3 zone, it will fall sharply to $0.25 or even $0.2 area
📈BUY
🔴Buy : 0.293-0.307$. SL if B
🔴Buy : 0.39-0.41$ if A. SL if B
📉SELL
🔴Sell : 0.39-0.41$. SL if A
🔴Sell : 0.47-0.49$. SL if A
🔴Sell : 0.68-0.72$. SL if A
♻️BACK-UP
🔵Sell : 0.293-0.307$ if B. SL if A
🔵Buy : 0.244-0.256$ if A. SL if B
🔵Buy : 0.195-0.205$. SL if B
❓Details
🕯Timeframe : 1 Day
📈Red Arrow : Main Direction as BUY and SELL section
📉Blue Arrow : Back-Up Direction as BACK-UP section
🟩Green zone : Support zone as BUY section
🟥Red zone : Resistance zone as SELL section
🅰️A : The Close price of candlestick is Above the zone
🅱️B : The Close price of candlestick is Below the zone
