CHZ/USDT CHZ/BUSD Trade IDEACHZ is currently making cup and handle structure, This is how i would like to plan my trade. I would wait to break and retest resistance around 0.14~0.15. I would set take profits for short, midterm and long term (runner) with a tight stop loss. These are just my thoughts and they are not trade signals by any mean.
This is not an entry signal. Please Do your own research..
CHZUSD

$CHZ #CHZ | LTF SHORTThe red box most probably will work as resistance so i looking at bearish breakers (retracement etc.) around $0.1633 . If the price loses red box, the price may dump more than we expect. Have a good weekend!

CHZ has recorded a 15% price drop over the past weekCHZ has recorded a 15% price drop over the past week, with most of the drop coming from the previous day. After buying support took the price to the $0.1444 resistance range, as this level has seen a lot of reaction in the past and is considered an important supply level, it has caused short-term buyers to save profits. The corrective wave has a high downward slope. Therefore, there is a possibility that the price will enter a time correction. But very important and reliable support is considered in the range of $0.1144, which is located exactly on the midline of the main descending channel. If the price hits this area, we can expect a positive reaction. In this case, there is a possibility that after the correction, we will see another attempt to return the price to the resistance of $0.1144 to $0.1160.

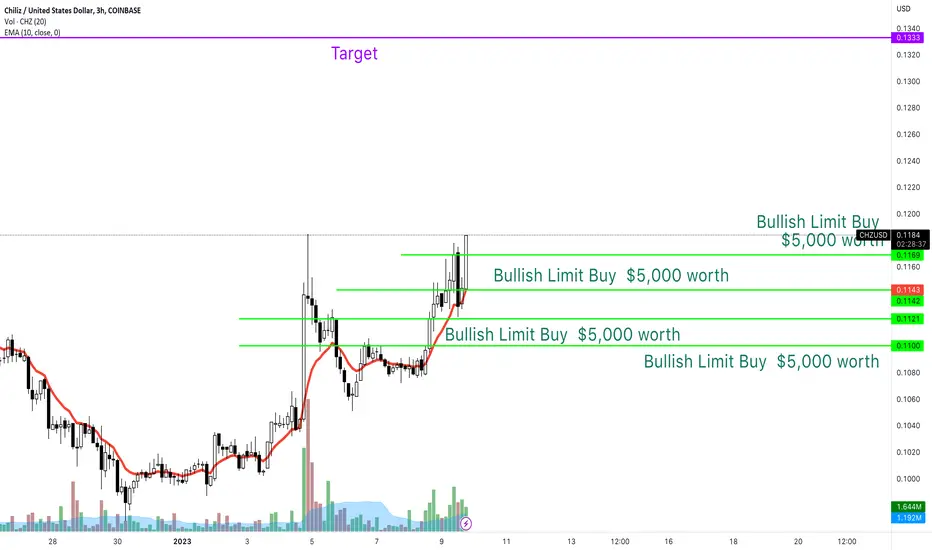
CHZ CAN GO UPPERHi, dear traders. how are you ? Today we have a viewpoint to BUY/LONG the CHZ symbol.
For risk management, please don't forget stop loss and capital management
When we reach the first target, save some profit and then change the stop to entry
Comment if you have any questions
Thank You


CHILL OUT BROLooking for CHZUSD to pop into the 50 ema on the daily. This had a nice 10 ema bull set up on the daily. Looking to buy a dip. THE GOAL is to be in and out of this trade before Thursday morning. Looking for about a 15% gain overall, is the goal!


CHZAlerted my group to buy at .116c spot & leverage trade here. Thinking something like this is about to happen.

CHZ/USD :: Short for Long time ?CHZ/USD :::
It is in a descending channel and the overall trend is moving downwards .
The support has been broken and there is a big price difference until the next support, and this creates a good opportunity for a sell position .
If the next support is also broken, it will continue its path to the bottom of the channel .
<<< Good luck >>>

CHZ-USDT-11-01-2023, Chiliz (D)My view and hold are in the downward direction.
Possible resistors are the blue lines I drew.
Not investment advice.
Let's watch and see, good luck.
Thank you.


CHZUSDT Analysis - 2 JANUARY 2023Hello Guys, Today's Analysis is on the CHZUSDT Symbol in a 15m Time frame, I Hope it Will be Useful for You, Don't Forget to Like, Follow, Comment

DUMP MR CHZHello guys
easy invalidation as you see this major weekly and monthly resistance.
short it
thanks.

CHZUSD - 80 % drop is possible (SHORT)hi everyone.
CHZUSD looks very bearish. It's been in a long-term downtrend.
Let's be honest. There's no support until $0,021
This coin can drop even 80 % or more if we see a capitulation.
You are warned ! The big drop is coming.

CHZUSDT - 1200% upside potential after a 40 - 60% drop from hereCHZ - chiliz
the leading NFT token, is in a continuous downtrend since the 2021 top.
it has come to the price where the accumulation would probably start.
Although BTC having a CME gap at 12K would take it further down to 0.08 - 0.04. This would be an area to start DCAing CHZ for the relief rally of 2023 around OCT 2023 we might see a huge upside for CHZ at around 0.35 - 0.55...
The chart is drawn on a Monthly Timeframe. its not suggested to use it for futures/options.
**** It's not financial advice.

CHZUSD ❕ above the rangeThe FIFA World Cup 2022 ends in 2 days, which means that interest in fan-tokens will soon drop, which will affect the price of CHZ.
The RSI chart is in the sellers area (4H, 1H and 30m TFs)
I expect a continuation of the decline if the price fixes under the upper boundary of the range.

CHZ looks bullishI hope you are fine
Before anything else, be careful if you do a transaction, don't forget to manage the volume and leverage and set the stop, and the transaction in this time frame is not low risk in the market.
I detected a diametric in the 4-hour time frame, which seems to go up for wave f. The red box is strong resistance.

Chiliz CHZ price "gives signals" of possible growth soonCHZ price was expected by many to grow during the World Cup, which is coming to an end, as Chiliz is one of the sponsors.
But the CHZUSDT price was falling all the time.
And now, at the end of the World Cup, CHZ buyers began to restrain the fall by purchases, and for the last few days, the price has been testing the liquidity zone of $0.125-0.140 from above.
Some kind of inversely proportional effect from the sponsorship turned out)
It seems that in the coming weeks, the CHZUSDT price has every chance to make +90% growth . It will be "very funny" if the growth impulse starts immediately after the end of the World Cup)
From the point of view of risk management, we believe that buying CHZ in the range of $0.125-0.140 is quite balanced in order to gain a long position. Medium and long-term growth targets are $0.259 and $0.55, respectively
_____________________
Did you like our analysis? Leave a comment, like, and follow to get more

CHZ UPDATE CHZ is on ABC correction I am expecting to get a regular flat ( bullish flag )
green lines are the targets above
for long time investors , based on bullish flag pattern rules : CHZ could hit 15-17$ in next 5-10 years
peace :)

CHZUSDT - Bullish divergenceHi everyone, as we can see CHZ is printing a bullish divergence on 4Hs, the confirmation for bullish theory should see a close above the white horizontal line, in which case i think we will see a nice rally to 0.20, 0.145 is important level to hold.
Thank you all

CHZ-USD WeeklyCHZ-USD Weekly trend. The trendline is around 0.1170. This is the maximum drop level. But it may not want to go down there.
