Civic Bull Market Bullish Wave On (PP: 926% - 1526%)Civic's bull market bullish wave is on after a very nice long-term double-bottom pattern.
Back in August 2024, CVCUSDT produced a major low coupled with a reversal candlestick pattern. Back in April 2025, last month, CVCUSDT did the same, a higher low and technical double-bottom and now it is moving with maximum strength. This weekly session is one of the strongest sessions/candles in years. After a higher low, this means that the 2025 bullish wave and cycle is fully on.
The long-term double-bottom, between August 2024 and April 2025, is also a long-term higher low vs June and August 2023, this means that this pair has been growing long-term from its base. This is a strong bullish signal that reveals a new All-Time High happening in 2025. This can turn into something awesome.
An easy target here is mapped at $0.63 for a nice 320% profits potential. Remember, this is only because the bullish action is already ongoing. If we take the total potential from the market low, this same target would be equal to more than 747%, and it is an easy target.
The next target and new All-Time High sits at $1.54, with total profits potential reaching 926%. The same, from the bottom up, the April low, this same target will yield a huge 1,952%. That would be the total 2025 bull market bullish wave, but guess what? It can go higher...
Thanks a lot for your continued support.
Namaste.
Civic

CVCUSDT (Civic) Updated till 01-01-25CVCUSDT (Civic) Daily timeframe range. PA still on consolidation range and its been long time now. when money flows into mcap if it can stay above 0.1475 it do have potentials of nice setups. for now PA trying to get over 0.2191 which will valid after confirm close.

CVCUSDT (Civic) Updated till 05-10-24CVCUSDT (Civic) Daily timeframe range. we can see a nice move from its local low. made some easy profits myself from it. its trying for a push against 0.1973. a clean close can run it toward 0.2611. but for that its need that clean close. recent support at 0.1514.

(CVC) civic "ICO" Early fudning for civic came in the form of an ICO, crunchbase.com metrics.
Initial coin offerings give a chance for people to buy the token before it is available for public trade on markets. Less decentralized than if the token had made no sales before being pushed to market.

CIVIC (CVCUSDT) Surges 200% in Price, Further Gains PossibleCIVIC (CVCUSDT) has experienced a phenomenal surge in price today, skyrocketing a staggering 200%. The price, which was previously hovering around $0.10, has broken free and reached a new high of $0.30
A possibility of further price gains, with some predicting a breakout if the monthly candle closes above $0.41. In this scenario, the price could potentially reach $0.60.

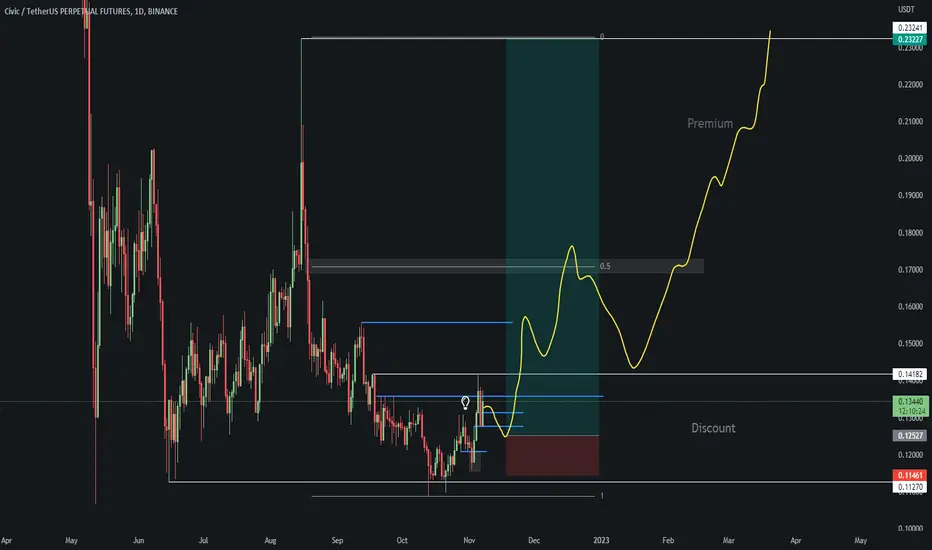
CVC/USDT Can Rally if it Holds the Below Support Level👀🚀💎Paradisers, be on high alert! #CVCUSDT is poised for a compelling opportunity as it prepares to retest ascending support, indicating a robust bullish move ahead.
💎We've observed #CIVIC consistently respecting an ascending support line on the 1D timeframe, suggesting a solid foundation for bullish potential. Currently, it's approaching the crucial support level at $0.1329.
💎If it holds steady here, there's a strong likelihood that it will target the significant resistance at $0.24, with the RSI hinting at a possible upward trajectory, adding weight to this bullish perspective.
💎Conversely, if #CVC loses momentum and breaks below this key support, be ready for a bullish rebound from a lower Demand Zone at $0.113. A slip below this level would indicate a marked downward trend for $CVC. Keep your strategies flexible and stay sharp for any market fluctuations.

CVCUSDT(Civic) Daily tf Range Updated till 26-03-24CVCUSDT(Civic) Daily timeframe range. pretty good performance from this one. i had a position from 0.1923 played out very well. not much of pushback here at 0.3201 depend on swing sellers. gaining upperhand from 0.3201 can give it a good advantage.

Civic | A Forgotten GemDo you remember Civic?
Back in the days, aka 2017/2018, it was all the rage, all the hype...
The guy that owns this project was well respected or at least we saw good news about him all the time.
We don't here anything about it anymore but the chart looks good and we are technical analyst and traders... Let's have a look!
For Civic (CVCBTC), we had a bull market that lasted 301 days.
From November 2020 until August 2021.
As the bear market came, Civic remained really strong and still trades within a long-term higher low.
And this pair is now consolidating within a range that has been active since June 2021.
In plain English, this one is showing strength.
It has also proven itself by being around since 2017.
I will cut this analysis short... Keep an eye on this one, it has potential for sustaiend long-term growth.
Namaste.

CVCUSDT - LongLong here on CVC. Breakout and retest of a consolidation, SL below previous low.
First target 0.105
Second target 0.109

CIVIC/USDT looking for longshi,
Sharing another swing long position am waiting for. I'm expecting a 100% return from this asset class.
I like that chart and lot's of fud in the market which can trigger a drop into my buying level.
Chart is messy am sorry but that's what I'm seeing.
Manage your risk and don't risk more then 1-3% to stay in the game.
All the best- INshALLAH
CVC - CIVIC - DaytradingCivic looks like it is about to make a nice little jump. Better jump on the bandwagon now.

Civic potential pump BINANCE:CVCUSDT
CVC To the moon +150 - 300% soon, I hope
STOP LOSS is most important than making profit.

CVC Civic key expected Coin for the Week cvcusdc cvcusdt cvcbtcCVC Civic key expected Coin for the Week cvcusdc cvcusdt cvcbtc

Crypto ID Systems - Why Zero-Knowledge Proofs Are the FutureThe Russian-Ukrainian crisis, the tanking of the Russian stock exchange (and its subsequent shutdown) has put the economic future of Eastern Europe in a very uncertain state. Why Zero-Knowledge Proofs like zk-STARK and zk-SNARK (combined with KYC and AML methods) might see a renewed interest in the crypto industry in the near future. (And probably for the longer term as well.)

CIVIC Daily TA : 02.19.22 $CVCAll the supports and resistances are marked on the chart and everything is clear in this analysis , but , just in case , if you had any questions or doubts Please feel free to ask in the Comment section .
Follow our other analysis & Feel free to ask any questions you have, we are here to help.
⚠️ This Analysis will be updated ...
👤 Arman Shaban : @ArmanShabanTrading
📅 19.Feb.22
⚠️(DYOR)
❤️ If you apperciate my work , Please like and comment , It Keeps me motivated to do better ❤️

CVC, will this level withstand pressure from sellers?CVC is in the value area. It is worth pointing out that on every rise a large volume appeared at the top. This is a bad signal, a signal that big players are distributing their capital and selling at every opportunity.
From the technical analysis point of view, it is worth mentioning that the price has repeatedly tested the key level, which acts as support. Additionally, we can point out that the CVC also squeezes near this level. These are signals for a breakout. In case of a breakdown, there could be a good opportunity to sell.
Write in the comments all your questions and instruments analysis of which you want to see.
Friends, push the like button, write a comment, and share with your mates - that would be the best THANK YOU.
P.S. I personally will open entry if the price will show it according to my strategy.
Always make your analysis before a trade.

Civic (CVC) formed big bullish Gartley for upto 281% huge moveHi dear friends, hope you are well and welcome to the new trade setup of Civic ( CVC ) token.
Previously we had a nice harmonic trade of CVC:
Now again on a weekly time frame, CVC has formed a bullish Gartley . There is strong support at $0.22 and also a 100 simple moving average support as well.

CIVIC making a base for the 2nd wave?butterfly harmonic pattern:
X=$8.59
A=$0.0049
AB=0.78 XA
BC=0.88 AB
0.78 BC=$0.568
0.88 BC=$0.955
0.78 XA=$1.74
0.88 XA=$3.67
1.13 XA=$22.61
1.6 BC=$42.77
1.27 XA=$65
1.41 XA=$181
2 BC=$311
1.6 XA=$855
2.24 BC=$1081

CVC/USDT buy signalThe pump is coming shortly. I'd hope it will start any time today but might consolidate for a little while beofe.

Dino coins about to pamp!!Civic is one of my coin back in 2017.. the founder is Vinny Lingham been following him since back in 2017.. one of the OG's in Bitcoin!

Civic Long Term TargetsCivic one of the most good project in digital identity
i think in the first two week of december CVC fly to 1$
i bought it in 0.4$ range and if the price drops to this range i'll add some more

CVC/USDT updateHi all,
My CVC/USDT was activated tonight. After we saw manipulation at many coins yesterday, I think we have a nice entry for CVC/USDT.
Why do I see a buying opportunity?
- We had manipulation / fake breakouts before
- Bullish sentiment of crypto (I look at BTC and ETH as sentiment indicators)
- Candle rejected to close below .81, so there is a possible retest
- Price is in bigger support area
Always do your own research and use proper riskmanagement. Please share your thought on CVC/USDT
EDIT: My stop loss is a bit lower than in the chart

CVC/USDT Potential Bullish ScenarioHi there,
I have been following CVC for half a year now. After the extreme pump of early September, the expected dump and consolidation came as a result.
Since the price is back above the support/resistance of $.45, I am waiting for a buy scenario. My ideal situation where I get the most confirmations is a breakout above $.56 which is also a key Fibonacci level and resistance area at the same time. Then I wait for a retest before entering a trade (leverage/futures). patience is the key.
