CKBUSDT – Still Time to Catch the Move?Some say the move is over.
But when you know what to look for, you see what others miss.
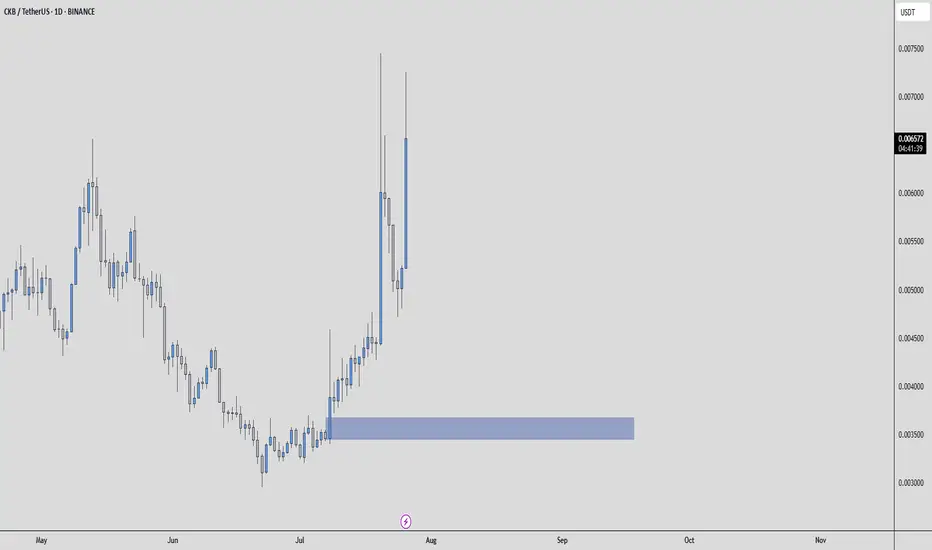
🧠 Smart Entry Zone
The blue box sits right below value on the volume profile, where weak hands panic and smart money prepares.
On the footprint, we’re seeing signs of absorption, aggressive sellers hitting into passive buyers.
CDV is stable, showing strength beneath the surface.
These are not guesses, they're signals built on experience and data.
🎯 What I’m Doing
If price returns to the blue box:
✅ I’ll wait for renewed absorption
✅ CDV must support the move
✅ Structure reclaim confirms the intent
When these align, I don't hesitate.
Because when you have a plan, you're not reacting, you’re executing.
📌I keep my charts clean and simple because I believe clarity leads to better decisions.
📌My approach is built on years of experience and a solid track record. I don’t claim to know it all but I’m confident in my ability to spot high-probability setups.
📌If you would like to learn how to use the heatmap, cumulative volume delta and volume footprint techniques that I use below to determine very accurate demand regions, you can send me a private message. I help anyone who wants it completely free of charge.
🔑I have a long list of my proven technique below:
🎯 ZENUSDT.P: Patience & Profitability | %230 Reaction from the Sniper Entry
🐶 DOGEUSDT.P: Next Move
🎨 RENDERUSDT.P: Opportunity of the Month
💎 ETHUSDT.P: Where to Retrace
🟢 BNBUSDT.P: Potential Surge
📊 BTC Dominance: Reaction Zone
🌊 WAVESUSDT.P: Demand Zone Potential
🟣 UNIUSDT.P: Long-Term Trade
🔵 XRPUSDT.P: Entry Zones
🔗 LINKUSDT.P: Follow The River
📈 BTCUSDT.P: Two Key Demand Zones
🟩 POLUSDT: Bullish Momentum
🌟 PENDLEUSDT.P: Where Opportunity Meets Precision
🔥 BTCUSDT.P: Liquidation of Highly Leveraged Longs
🌊 SOLUSDT.P: SOL's Dip - Your Opportunity
🐸 1000PEPEUSDT.P: Prime Bounce Zone Unlocked
🚀 ETHUSDT.P: Set to Explode - Don't Miss This Game Changer
🤖 IQUSDT: Smart Plan
⚡️ PONDUSDT: A Trade Not Taken Is Better Than a Losing One
💼 STMXUSDT: 2 Buying Areas
🐢 TURBOUSDT: Buy Zones and Buyer Presence
🌍 ICPUSDT.P: Massive Upside Potential | Check the Trade Update For Seeing Results
🟠 IDEXUSDT: Spot Buy Area | %26 Profit if You Trade with MSB
📌 USUALUSDT: Buyers Are Active + %70 Profit in Total
🌟 FORTHUSDT: Sniper Entry +%26 Reaction
🐳 QKCUSDT: Sniper Entry +%57 Reaction
📊 BTC.D: Retest of Key Area Highly Likely
📊 XNOUSDT %80 Reaction with a Simple Blue Box!
📊 BELUSDT Amazing %120 Reaction!
📊 Simple Red Box, Extraordinary Results
📊 TIAUSDT | Still No Buyers—Maintaining a Bearish Outlook
📊 OGNUSDT | One of Today’s Highest Volume Gainers – +32.44%
📊 TRXUSDT - I Do My Thing Again
📊 FLOKIUSDT - +%100 From Blue Box!
📊 SFP/USDT - Perfect Entry %80 Profit!
📊 AAVEUSDT - WE DID IT AGAIN!
I stopped adding to the list because it's kinda tiring to add 5-10 charts in every move but you can check my profile and see that it goes on..
CKBBTC
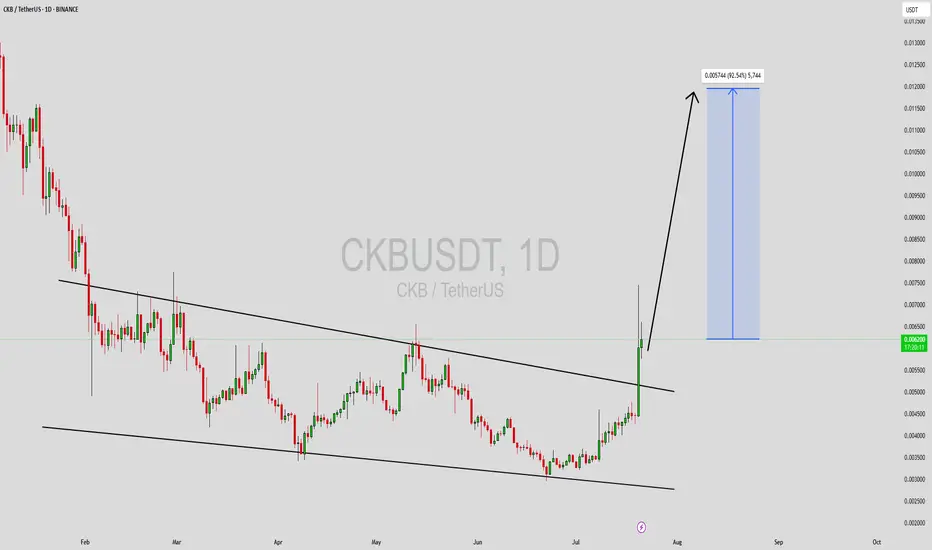
CKB Forming Descending ChannelCKBUSDT is currently showing strong signs of a potential breakout from a descending channel pattern, a formation widely interpreted as bullish once price breaks above the channel's resistance line. This setup, combined with consistent good volume, indicates that the asset has likely found a solid base and is ready for a significant upside move. Based on the pattern's breakout potential and technical projections, a gain of 80% to 90%+ is expected if the breakout confirms with strong momentum.
The descending channel has allowed CKB (Nervos Network) to consolidate after previous highs, cooling off indicators like RSI and setting the stage for a healthier, more sustainable bullish run. Nervos is gaining traction as a blockchain platform focused on interoperability and layer 2 scalability, attracting developer interest and investor attention. This fundamental strength adds weight to the technical breakout scenario.
Market participants should closely watch the price action near the upper boundary of the channel. A daily close above this resistance with strong bullish volume would validate the breakout and open the door for an extended rally. As investor interest grows and trading volume remains elevated, this could serve as a catalyst for CKBUSDT to surge toward the projected targets.
✅ Show your support by hitting the like button and
✅ Leaving a comment below! (What is You opinion about this Coin)
Your feedback and engagement keep me inspired to share more insightful market analysis with you!
Where is the rebuy zone for CKB? (2D)From the point where we placed the red arrow on the chart, the CKB correction has begun.
It seems that CKB is in a bearish wave C.
We have identified two entry points for rebuy, where a position can be taken in the spot market.
A daily candle closing below the invalidation level will invalidate this analysis.
For risk management, please don't forget stop loss and capital management
Comment if you have any questions
Thank You

CKBUSDT: Bouncing from Support LevelCKBUSDT technical analysis update
CKB's price has touched a strong support level on the weekly chart and is now bouncing from it. We can expect a bullish move from the current level. On the daily chart, the price has dropped below RSI 30, which is another bullish sign for CKB.
This is a good time to accumulate some CKB.
Target 300%-500%
Regards
hexa

#CKB/USDT#CKB
The price is moving within a bearish channel pattern on the 12-hour frame, which is a strong retracement pattern and was broken to the upside.
We have a bounce from a major support area in green at .008700
We have a tendency to stabilize above the Moving Average 100
We have a downtrend on the RSI indicator that supports the rise and gives greater momentum, and the price is based on it to rise after it was broken upward.
Entry price is 0.011000
The first target is 0.015500
The second goal is 0.019000
The third goal is 0.02230

CKB looks bullishPrice has tested an important flip range and then formed a bullish iCH on the chart. In this situation, a POI has been formed for us, and we will look for buy/long positions in this range.
A trigger line is also broken on the chart
The targets are marked on the chart.
Closing a daily candle below the invalidation level will violate the analysis.
For risk management, please don't forget stop loss and capital management
When we reach the first target, save some profit and then change the stop to entry
Comment if you have any questions
Thank You

CKBUSDT Inverse Head and Shoulders PatternCKBUSDT Technical analysis update
CKB price is forming an inverse head and shoulders pattern. The price of the right shoulder is now moving towards the neckline for a potential breakout, 100 and 200 EMA act as good support for the right shoulder. If the breakout occurs, we can expect a strong bullish move in CKB.
Only buy after the neckline breakout.
Stop Loss: $0.0111

CKBUSDT - 4H Bullish trendThe CKBUSDT 4-hour chart indicates a significant breakout above a long-term descending trendline, suggesting a potential bullish reversal. The price action has successfully breached this resistance, signaling a shift in market sentiment from bearish to bullish. This breakout is accompanied by increased volume, which adds credibility to the upward movement.
Additionally, there is a support zone highlighted in green that has held firm, providing a strong base for the recent upward momentum. If the price continues to hold above the trendline, we can expect further gains, with the next target potentially being the $0.026 level. Traders should monitor this breakout for sustained buying pressure and consider long positions while keeping an eye on the support zone for any potential pullbacks.

CKB - 7600% Profit in 2024, buy nowThe CKB coin looks very promising for the upcoming bull market. On the weekly chart, we have a falling wedge, bullish reversal pattern that is currently breaking out! It's always important to take a look at the volume indicator when it comes to breakouts. The bullish volume is extremely high, which confirms my bullish bias. From the Elliott Wave perspective, we have a triple-three corrective pattern that has been completed, which is also a very good sign. Where to take profit? On the chart, you can see 3 profit targets. It's up to you how long you want to wait for your profits. Let me know what you think about my analysis, and please hit boost and follow for more ideas. Trading is not hard if you have a good coach! Thank you, and I wish you successful trades.
What Is Nervos Network (CKB)?
Nervos Network (CKB) is an open-source public blockchain ecosystem. Its goal is to create a peer-to-peer (P2P) crypto-economy network where users can access a wide range of provably secure blockchain services and capabilities.
The Nervos mainnet launched in November 2019 with a novel dual-layer architecture. There’s a base layer where the consensus mechanism operates and smart assets are stored, and a computation layer where transactions are processed.
The base layer, also known as the Common Knowledge Base, has its own cryptocurrency called CKByte (CKB). It uses the Proof-of-Work (PoW) consensus mechanism and drives the Nervos ecosystem. It is used to pay miners for keeping the network safe, managing network resources, and letting users store things on the network.
The Nervos Network allows developers to create decentralized applications (dApps) that can operate on various blockchain systems. Any of the network layers can be used to run both decentralized apps and smart contracts.
Let me know what you think about my analysis, and please hit boost and follow for more ideas. Trading is not hard if you have a good coach! Thank you, and I wish you successful trades.

CKB NEW VOLUME INCREASEThank you for reading this update.
Depending on our study we see that CKB has a good chance of volume increase.
This updates depending on day trade, And the market should confirm with time the right market way.
#Nottradingadvice
#For Day traders take always profits when the market increase
#Expect nothing from the markets, but follow what it shows.

#CKB/USDT#CKB
The price is moving in a triangle from the beginning of November 2023
We are about to break the triangle strongly
We are top Moving Average 100
The price now is 0.003464
The first target is 0.003457
The second goal is 0.003820
The third goal is 0.004000

CKBUSDT Resistance Breakout!CKBUSDT Technical analysis update
CKB price has approached its resistance line, accompanied by a gradual increase in volume on the 1H chart. While this could suggest potential upward movement.
Buy zone : Below $0.0155
Stop loss : $0.0135
Regards
Hexa

Pendle - one of the strongest coin, 445% profit in weeksPendle is one of the stronger coins currently on the crypto market. We can see that we have had a pretty long consolidation where whales were accumulating coins. Of course they want to make money, so they sent the coin to the upside. We can see that the uptrend is starting to be parabolic, which is very good because you can make a lot of money in a short period of time. My profit target is the 2.618 FIB extension, which is 445% profit from the current price if you buy the coin right now.
About Pendle - Pendle is a protocol that enables the tokenization and trading of future yield. With the creation of a novel AMM that supports assets with time decay, Pendle gives users more control over future yield by providing optionality and opportunities for its utilization.
Let me know what you think about my analysis, and please hit boost and follow for more ideas. Trading is not hard if you have a good coach! Thank you, and I wish you successful trades.

CKB IS VERY BULLISH (1D)We are in a large diamond diametric that looks like the E wave is over.
By maintaining the green area, it can be pumped up.
Please note that the time frame is daily and time consuming.
For risk management, please don't forget stop loss and capital management
Comment if you have any questions
Thank You


Nervos Network (CKB) forming a bullish BAT for upto 23% moveHi dear friends, hope you are well and welcome to the new trade setup of Nervos Network (CKB) coin with US Dollar pair.
Recently we caught a nice pump of CKB as below:
Now on a 4-hr time frame, CKB is about to complete a bullish BAT move for another pump soon.
Note: Above idea is for educational purpose only. It is advised to diversify and strictly follow the stop loss, and don't get stuck with trade

Nervos Network (CKB) formed bullish Cypher for upto 11% pumpHi dear friends, hope you are well and welcome to the new trade setup of Nervos Network (CKB) coin with US Dollar pair.
Our last successful trade of CKB was as below:
Now on a 4-hr time frame, CKB has formed a bullish Cypher pattern.
Note: Above idea is for educational purpose only. It is advised to diversify and strictly follow the stop loss, and don't get stuck with trade

CKB HAVE A CHANCE TO PUMPBefore anything, I must say that this setup is not a low-risk setup. Don't forget capital management and stop. According to the structure, this symbol has the chance of an increase

CKB COIN Can Make 100% 😲Hi Traders , please if you like ideas do not forget to support it with your like and comment , thank you so much and we will start stay tuned for new ideas. Every day I post profitable ideas a day.
CKB looks bullish wait brakout resistance zone with good Vol
This Coin Can Make Easy 50% + has Low Market Cap
stay tuned for new ideas
Every day I post profitable ideas a day you You can check them out on my profile

CKB is a buy LONG LONG LONGI appreicate the chart looks messy, however also clean. alot of channels and i understand this may not play out however if we go very bullish this is the type of run that CKB could go on taking it up to the 15c area which is a 3000% run, worth some more analysis

Nervos Network CKB Price Targets and Stop LossCKB/USDT
Entry Range: $0.0125 - 0.0135
Price Target 1: $0.0147
Price Target 2: $0.0163
Price Target 3: $0.0195
Stop Loss: $0.011

CKB/USDT BREAKOUT SOON! EXPECTING 200% PROFIT FROM HERE!!Hello everyone, if you like the idea, do not forget to support with a like and follow.
Welcome to this CKB/USDT TRADE setup. CKB looks great here.
CKB is trading inside a falling wedge-like structure where the breakout is still pending. CKB has very strong support shown through the green box. Accumulate this in the green box and hold it for a few months for a nice profit.
Entry range:- $0.010-$0.011
Target:- 200%
SL:- $0.0090
If you like this idea then do support it with like and follow.
Also, share your views in the comment section.
Thank You!

CKB something to considerthoughts on where CKB could go long term
alot of copied fractals but will follow a 1,2,3,4,5 elliot wave nicely
