Crude oil is in a good position to make a rally.The main idea is to buy oil futures. This conclusion was based on Elliott wave principle. I hope you know basics of this type of techical analysis, if not i suggest you to read elliott wave principle by Robert Prechter.
Lets come back to chart. Overall I suspect that we will see strong impulse move, that will end 4th wave and than we will see new bottom near 15 usd. The timing is always hard to predict, but depends on wave relations, its should take 2-3 years before we will see 15 usd per barrel. Yeah its a long run, but we have nice opportunity to enter a nice trade now, in the last move upside. I think that 4th wave of a big move down that started from 2011, will take form of a combination: zigzag - flat. We have already seen zigzag and AB of flat, now i hope to see a good impulse move labeled C that will end 4th wave.
CL

CL 4h Chart breakdownWe can observe CL is still in that bearish channel but the price has now created what I believe a highly bullish wedge. Price targets marked as per fib retracements. If we do get a break to the downside, please watch 43.50's area as a buy opportunity.


CL - Crude is outside the fork and could hit $43 soon.The current bar could be the re-test of the L-MLH.
This would indicate a further drop.
Taking the prior angle of price flow to find the potential target, the number would be around $43.
P!

Cl strong longIt's time to throw sellers out of positions
Trade without indicators and trend lines is realistic

What Is Going On With Crude Oil ??Not sure what to make of crude at this juncture. It looks like oil is riding towards 58 i.e the channel top with a CCI divergence to support that case. But the risk of breaking lower is still very present. Any idea guys?

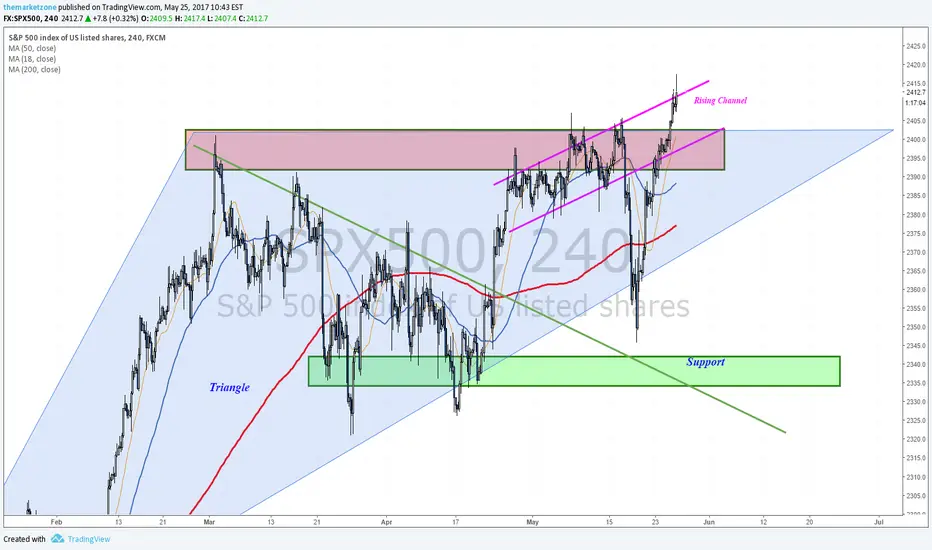
Top of a trading channel - Will it close below 2400? SPX rallied today to new record high but it is now threatened by falling Oil prices.
Pay attention to the top of the channel now. Should act as resistance.
A close below 2400 can generate a weekly false breakout.
Low risk, high potential reward
CrudeOilWe have brokeout the strong channel and now support line became ressistance line. Waiting for continue the trend.

CL on a larger TF / Start of crucial two months for USOILThis shows what, in my opinion, CL might do in the next couple of months. CL will reveal its hand on the day of the OPEC meeting (whatever people think, OPEC WILL create a strong reaction). After that meeting, the candle we get is going to show many things. However, I believe movement after the meeting, into summer, will be much more interesting and violent. It will be very strong, giving us a new HOY or a new LOY. During these months, I will provide maps daily / weekly showing what I think will be happening on smaller TF's using primarily Andrews, Indis and PA.
A: If we manage to get above the 1y TL, in my opinion it will drift around it until the OPEC meeting. Then we might see a surge to the TL5, quite possibly will try to take it out. If price manage to get above it, I believe new HOY will appear. If the OPEC candle will be anything like November, it is more than likely.
B: If we don't retake the 1y TL2, might retest the low (and TL3) around 44.60, which would on a bigger TF make a double bottom of sort. Then surge into OPEC meeting and the decision in the blue cluster.
Looking a bit further ahead, at July, that cluster (blue circle) might be very interesting, and a likely target for consolidation before the most important move in 2017 (after all the geopolitical nonsense and OPEC). If that TL5 isn't taken out with the OPEC candle, it might provide the roof for price and a consolidation zone.

CL daily candle with higher highsCL Tagged the midline of the fork early in the AM today. It appears to still be bullish. Thinking it will test the midline again and zoom through it.
Tomorrow, may come back and retest the midline of the fork @ $48.2 and head up for a test of the $50.2 area.
CCI is still heading toward the zero line for a cross.
Thinking this whole drop this morning to was to get SPX down to $2384 and then to have continued strength to push it up to new highs.

CL - Crude Oil Zoom & Test and here comes another short target:This one is classic.
Zoom, test and a potential re-test.
However, the target is the lower medianline parallel.
If we close above the centerline, then chances are very high for a pullback to the upside.
P!

CL on solid support, waiting for instructionsCL tested the 25% area of the fork and should now be headed up to the midline (50%) area for a test. CCI is currently at -46 and should start to cross the zero line to continue heading over 100. Should see more bullish continuity during the E I A report tomorrow on 5/10/17 and also on Thursday when the OPEC monthly report is released.

Target for short term bearish channelThis is a target for short term bearish channel. Approx time is 3-6 days.

CL - Crude with three potential targetsThis is a wild ride, but we are not unhappy don't we ;-)
The prior LT chart gave us a great indication about the fall.
A closer looks reveal that the drop from above is the logical swing that markets do.
Targets?
Well, we have a couple of them as you see on the chart.
See the circles? One at the A/R-Shift, and two other ones at the different centerlnes.
First I even expect a pullback, since markets swing.
The yellow, thin down sloping mini Forks centerline is key!
If price jumps above it, we can expect a bigger pullback.
If price just test/retest it, then another entry is praying to be taken.
So, let's be patient, ride the grumpy bear and see if we can load up some.
P!

CL - Crude on a very longterm view.The blue centerline was respected very good.
The white U-MLH is not bad too.
There is a high chance that price will meet the centerline...hoooly...how about below 25, or even 20?
Looks totally crazy, yes, to me too ;-)
But hey, we follow the path of price & forks.
We act upon what we see, not what we wish to see...veeery hard sometimes hehe...
Put context around it - it makes charts & price action more clear.
P!

