Crude OilPair : Crude Oil
Description :
Completed " 12345 " Impulsive Waves and " A " Corrective Waves
Break of Structure and Retracement
Fibonacci Level - 50.00% / 61.80%
RSI - Divergence
Bullish Channel as an Corrective Pattern in Short Time Frame
Crude Oil Futures WTI (CL1!)

EQT projected earnings growth of 95.06%, from $2.43 to $4.74EQT is one of the largest natural gas producers in the US, with a strong market position and recent strategic acquisitions that could contribute to its growth.
There is a projected earnings growth of 95.06%, from $2.43 to $4.74 per share, which could drive the stock price up

CRUDE OIL Pair : Crude Oil
Description :
Bullish Channel as an Corrective Pattern in Short Time Frame and Rejection from Daily Resistance
RSI - Divergence
Break of Structure
Symmetrical Triangle as an Correction in Short Time Frame with the Breakout of Upper Trend Line

WTI crude looks set to bounceMomentum has clearly been in favour of bears over the past week for WTI traders, but given it has fallen over 10% from the January high it could be argued the move is oversold (at least over the near term).
A doji formed on Monday to show bears are losing their grip, and the fact it is forming a base above the 2023 open price and $72 handle adds to the case for a technical bounce. Moreover, bears entered around the January highs but volumes declined as prices fell to suggest the move is running out of steam, and RSI (2) was oversold on Friday.
The bias is for a bounce towards the weekly and monthly pivot points around 74.50 - 74.80 whilst prices remain above Monday's low.

Occidental Petroleum Corp.: Bullish Bias. ContinuationTo be successful on Wall Street, it is important to be flexible and be able to recognize changing market winds - the patterns that tell investors when to get in and out of the market.
Sometimes a breeze is a warm and inviting wind: assets rise in value, and it seems that everyone is making money.
Other times, it turns into a violent storm, leaving in its wake financial destruction, memories of the past, and hope that better times are yet to come.
Occidental Petroleum Corporation (often abbreviated as Oxy in reference to the symbol and logo) is an American company engaged in hydrocarbon exploration in the United States and the Middle East, as well as petrochemical production in the United States, Canada and Chile.
The oil company, among other Value Investing Assets, has become one of the main beneficiaries of the weakening and reversal of WFH ("Working From Home") disinflationary trends that quickly shook the entire financial world against the backdrop of the Covid-19 pandemic in Q1 2020. But faded also just as quickly, while since the first quarter of 2021, in two years, many growth assets have been undermined, rocked by scandals, or completely destroyed.
It was revealed in March that Warren Buffett's Berkshire Hathaway added more shares to an already large bet on Occidental Petroleum, according to an SEC Form 4 report released on March 7, 2023.
The Buffett conglomerate bought nearly 5.8 million shares of the oil company over multiple trading sessions in March, at prices ranging from $59.85 to $61.90, according to the documents.
Berkshire now owns 200.2 million shares of Occidental, totaling 22.2% of the oil company's shares, up from 21.4% previously.
Occidental shares are currently among the top 10 Berkshire holdings. The energy company outperformed the S&P 500 index last year, more than doubling in price.
In March, Occidental CEO Vicki Hollub said in an interview with CNBC that she met with the 92-year-old investor, noting that they talked about the oil and gas industry and related technologies.
Last August, Berkshire received regulatory approval to buy up to 50% of Occidental, sparking speculation that Berkshire could eventually buy out the entire Occidental company.
Berkshire also owns $10 billion of preferred shares in Occidental and has warrants to buy another 83.9 million shares of common stock for $5 billion, or $59.62 each. The warrants were obtained as part of the company's 2019 deal that helped finance the purchase of Anadarko Occidental.
While many investors even now continue to believe in the crypto-snow that melted without a trace the winter before last, the technical picture indicates the possibility of Growth comtinuation in value investment assets, incl. Occidental Petroleum - after the completion of the 0.618x Fibonacci retrace to the Growth that began later to Russian President "Special Military Operation" announcement in Q1'22.
Also, the support of weekly SMA (200) in CL1! - Crude Oil Futures adds bullish bias to market participants.

☄ Natural Gas Futures: This Is Ground Control To Major TomThis publication was partially created by ChatGPT AI, under request to Highlight Ten Factors That Could Drive Natural Gas Prices Below Zero in 2023.
Good or bad, y'all be the judge. But here's what ChatGPT said...
As an AI, I cannot guarantee the accuracy of such statements, but based on common knowledge, the following factors may be the reasons why natural gas prices drop below zero in 2023:
1. Growth in the use of alternative energy sources such as solar and wind energy.
2. Increasing US shale gas production, which will lead to an increase in global supply.
3. Reduced demand for natural gas due to switching to other types of fuel.
4. Increasing natural gas production in highly competitive countries such as Russia and Qatar.
5. The weakening of economic activity in various countries of the world, including China, the US and Europe.
6. Reducing inflation in various countries, which reduces the cost of natural gas.
7. A record increase in natural gas inventories caused by a reduction in demand and an increase in production.
8. Disputes between countries-suppliers and consumers of natural gas, which may lead to a decrease in exports and imports.
9. Increasing competition in the natural gas market from other producers such as Iran and Iraq.
10. Development of new technologies that make it possible to obtain energy from other sources without the use of natural gas.
Technical picture in Natural Gas Futures indicates the biggest YTD decline over the all history of Natural Gas Futures trading since early 1990x.
The main chart is adjusted for futures change All History Chart.

WTI stalls around resistanceThe core bias remains for a move up to $77, but as price action during the current rally on the 1-hour chart is choppy and has stalled near resistance, we're looking for a dip lower to around $73.
Also note that the weekly and monthly pivot points are hovering above the 10/20-day EMAs, which adds conviction that an interim top may be about to form.

WTI OIL Technical pull-back. Buy on these levels.WTI Oil (USOIL) gave us the most optimal buy entry last time we made a call on it (January 22, see chart below) and almost touched the 79.40 Target before pulling back:
The pattern that has emerged is a Channel Up that started since the December 13 2023 bottom. The recent top at 79.30 is a technical Higher High for the Channel Up and the rejection has started the new Bearish Leg to a Lower Low (bottom of Channel Up). However the price may not pull-back that far this time as the 4H RSI is testing its Higher Lows trend-line that has been holding since the December 06 2023 RSI Low and has already given 3 contact points for buy entries.
As a result this is where we are placing our 1st buy, with which we are targeting 83.00, being the 0.618 Fibonacci retracement level from the Top and right under Resistance 2 (83.60). That will establish a new 'diverging' Channel Up (dotted lines), that will aim for a similar Higher High range (+12.15%) as the January 28 High.
Since however the price already broke below the 4H MA50 (blue trend-line), we have to consider the possibility of a lower decline, which can indeed be as low as the bottom of the Channel Up, on a -9.00% decline (such as the January 03 Low). We believe though that in order to establish the new medium-term uptrend, the 1D MA50 (red trend-line) has to hold, so most likely this is the potential max downside extension. With that long, we will target the top of the (blue) Channel Up at 81.00, a little lower than the previous +14.40% Bullish Leg.
-------------------------------------------------------------------------------
** Please LIKE 👍, FOLLOW ✅, SHARE 🙌 and COMMENT ✍ if you enjoy this idea! Also share your ideas and charts in the comments section below! This is best way to keep it relevant, support us, keep the content here free and allow the idea to reach as many people as possible. **
-------------------------------------------------------------------------------
💸💸💸💸💸💸
👇 👇 👇 👇 👇 👇

Crude Oil is Primed for Gamma ScalpingCrude Oil price have remained sharply range bound for the last two months. CME Group’s West Texas Intermediate (WTI) futures have traded between USD 70-80 a barrel since early November last year. Sharply shifting supply and demand outlook explains range bound trading in crude oil.
In this paper, we discuss diverging factors affecting crude oil price and illustrate gamma scalping strategy to harness returns from range bound price moves. Gamma scalping is a well-established dynamic options strategy that enables investment returns from sharply oscillating price moves.
CRUDE OIL’S DIVERGING PRICE OUTLOOK
Tailwinds powering the oil prices increase is fuelled by (a) OPEC+ members decisions on deep supply cuts, and (b) geopolitical risks in the middle east remains elevated. On the day of the conflict escalation, crude prices spiked 2.6% higher.
Some of these attacks have affected crude oil tankers in the region risking supply disruptions.
Headwinds pressing oil prices down include record US crude oil production. The US churned 13.25 million bpd (barrels per day) of oil in Q3. That is more than 3 million bpd higher than Russia (second largest producer).
EIA expects strong US production to continue through 2024 with growth driven by rising well efficiencies in US oil rigs.
Globally, crude production growth is expected to slow but still rise by 0.6 million bpd in 2024 with higher US production offsetting the decline from OPEC nations. Expectedly, this has led to a widening premium for Brent crude compared to WTI.
Demand outlook for crude oil remains uncertain. Slowdown in demand growth remains a concern. EIA forecasts global oil consumption to rise by 1.4 million bpd in 2024. This represents a slowdown in growth compared to prior years (1.9 million bpd in 2023).
Slower economic growth translates into lower crude oil consumption. As such, supply-demand dynamic may remain unchanged despite slowing production growth.
NAVIGATING DIVERGING OIL OUTLOOK
With both bullish and bearish drivers for crude oil in active play, a directional position in crude oil might not be able to provide intended hedge for adverse price move. In a market with plenty of uncertainty and characterised by oscillating prices, gamma scalping can be used to harness consistent gains.
INTRODUCTION TO GAMMA SCALPING IN CRUDE OIL
Gamma scalping is an options trading strategy in which a trader continually adjusts their holdings to profit from small price movements in the underlying, while maintaining a directionally neutral position.
Gamma scalping involves dynamic hedging by continually neutralising options delta. Delta is the value by which options prices change for every dollar change in crude oil price. Gamma is the value by which delta changes for every dollar change in crude oil price.
Gamma scalping profits from small & frequent volatility in crude oil prices regardless price direction. With gamma scalping, traders can gain from both upward and downward price moves.
ILLUSTRATING GAMMA SCALPING IN CRUDE OIL
Gamma can be scalped in multiple ways. Common among them involves establishing a long straddle which is a combination of long call and a long put using at-the-money (“ATM”) options expiring on the same date.
Hypothetically, we can follow three simple steps to set up gamma scalping:
Step 1: Buy (“Long”) ATM Call Option and Put Option (aka Long Straddle)
At the hypothetical strike price of USD 70/barrel, premiums required for buying Straddle (calls and puts at-the-money option expiring on 14/Jun 2024) is USD 12/barrel (USD 6 each for call and put) which translates to USD 12,000 per lot. At inception, the delta should be at or near zero.
In practice, delta for ATM calls and ATM puts can differ and the position may have a net non-zero delta. Investors can reference the pricing sheet on CME QuikStrike for realistic options premiums, delta values, and strikes.
The gamma of the long ~0.025 x 2 = 0.05. Gamma is the value by which delta will change for each change in crude oil price.
Long straddle at inception is delta neutral. Meaning, it does not have directional exposure. However, it has long exposure of 0.05 gamma which signals that delta will change when crude oil prices move.
Step 2: Dynamic Hedging When Crude Prices Move Higher
Consider an up-move of ten points with crude trading up at USD 80/barrel. This results in a new delta of +0.5 (due to Gamma of 0.05 and 10 point move in crude prices: 10 * 0.05 = 0.5 per barrel). This translated to delta of 500 per lot of long straddle.
To remain delta neutral, trader needs to sell 5 contracts of CME Micro WTI to balance the increased delta. As a result, the overall position now consists of:
• Long 1 x ATM call option with a strike price of USD 70, with expiry 14/June (LON24).
• Long 1 x ATM put option with a strike price of USD 70, with expiry 14/June (LON24).
• Short 5 x Micro WTI futures contract (MCLN2024) which provides exposure to 500 barrels of oil at USD 80/barrel.
Step 3: Harvesting Gains via Dynamic Hedging when Crude Prices Fall
Imagine crude oil prices fall to USD 70/barrel, new delta is -0.5 per barrel and -500 per lot of long straddle. To remain delta neutral, the trader needs to buy five lots of CME Micro WTI futures to neutralize delta once more. This results in a profit of USD 5,000 (sell at 80 and buy back at 70 per barrel; each lot of CME Micro WTI futures represents 100 barrels).
Overall position now consists of:
• Long 1 x ATM call option with a strike price of USD 70, with expiry 14/June (LON24).
• Long 1 x ATM put option with a strike price of USD 70, with expiry 14/June (LON24).
This trade can be executed multiple times repeating the same steps as above. If crude oil trades down to being with, neutralising delta would involve buying lower and then selling higher when prices recover.
SALIENT CONSIDERATIONS WHEN GAMMA SCALPING
Upfront Premiums: Long straddle requires an up-front cost. Gamma scalping will need to be executed multiple times to break even and recover the premiums. Up-front premium implies fixed downside with a well-defined maximum loss.
Dynamic Hedging: Gamma scalping requires continuous monitoring and adjusting of positions.
Time Decay: Options should be selected with sufficiently large days-to-expiry to minimize effect of time decay. Time decay of the option rise sharply closer to expiration massively shrinking the value of the long straddle.
Long Volatility: High gamma benefits from high volatility. The strategy should be utilized when volatility is expected to rise or remain high.
At Expiry: The options legs may expire at a net loss and require scalping to break-even. Example payoff analysis for different settlement prices for crude oil at expiry:
1. Settles at USD 60/barrel: The put option is US 10 in-the-money and the call option is worthless. Options P&L = USD (10 – (6+6)) x 1000 = Loss of USD 2000. Gamma scalping must have generated more than USD 2,000 to offset this potential loss.
2. Settles at USD 75/barrel: The call option expires worthless and the put option is USD 5 in-the-money. Loss of USD 7,000. Gamma scalping must generate at least USD 7,000 to break-even.
3. Settles at USD 70/barrel: The call and the put option both expire worthless; the entire up-front premium of USD 12,000 results in a loss. To break-even gamma scalping must generate at least USD 12,000.
MARKET DATA
CME Real-time Market Data helps identify trading set-ups and express market views better. If you have futures in your trading portfolio, you can check out on CME Group data plans available that suit your trading needs www.tradingview.com
DISCLAIMER
This case study is for educational purposes only and does not constitute investment recommendations or advice. Nor are they used to promote any specific products, or services.
Trading or investment ideas cited here are for illustration only, as an integral part of a case study to demonstrate the fundamental concepts in risk management or trading under the market scenarios being discussed. Please read the FULL DISCLAIMER the link to which is provided in our profile description.

CL once a week update Jan 29thSharing CL update from TTR.
Will be updating CL once a week or so.
CL is trending above its 5EMA on a daily level; first support sits at 76.10, and the main support is at 74.55±
The main target is above 82.50
Bullish trend was just started imo

Crude oil could rally from $72Price action has been very choppy on the daily crude oil chart, but if we place a line chart over the top is shows prices are trying to break out of a small triangle / pennant. Whilst these are usually expected to be continuation pattern, they can also make decent reversal pattern. And this case, we've see prices hold above $70 on a closing basis, and the lower candle wicks made a series of higher lows. Momentum is now turning higher.
Bulls could seek dips down to $72 (yesterday's low) or a break of its high, with an upside target around $78, near the 200-day MA and 100-day EMA.

WTI Jumps to $78, Key Fibo Level - The Next Big Risk?Mega-cap tech’s climb to jumpstart 2024 fooled many strategists who called for value, cyclical, and small-cap niches to outperform. The same old playbook has been in full swing, but could that be about to change? Consider that banks, not chips, ended this week at fresh multi-year highs following a late-week pullback among the big semiconductor names.
But there’s more action out there that few are paying attention to. Have you seen WTI crude oil recently? Tensions in the Red Sea have been ongoing for many weeks, but it has just been over the last few sessions that WTI has taken flight. The prompt month now trades near $78. Gasoline futures, meanwhile, rose above $2.30, implying a national retail pump price average near $3.25 over the coming weeks.
Consumers might not like that, and it would come immediately after a sanguine set of University of Michigan Surveys of Consumers for January. We will get an updated read on that Friday next week. I also point out in today’s featured chart that US light sweet crude oil is now at a pivotal Fibonacci retracement level on the chart. Watch how the bulls and bears battle it out as the calendar flips to February. If we rally through $78, and hold it on pullbacks, a rotation in the market could very well take place, right as mega-cap tech reports Q4 results.

USOIL free Signal Result✅CONGRATULATIONS to all✅ as i told you was had a big potential to continue pushing up cause the breakout of the channel was enough

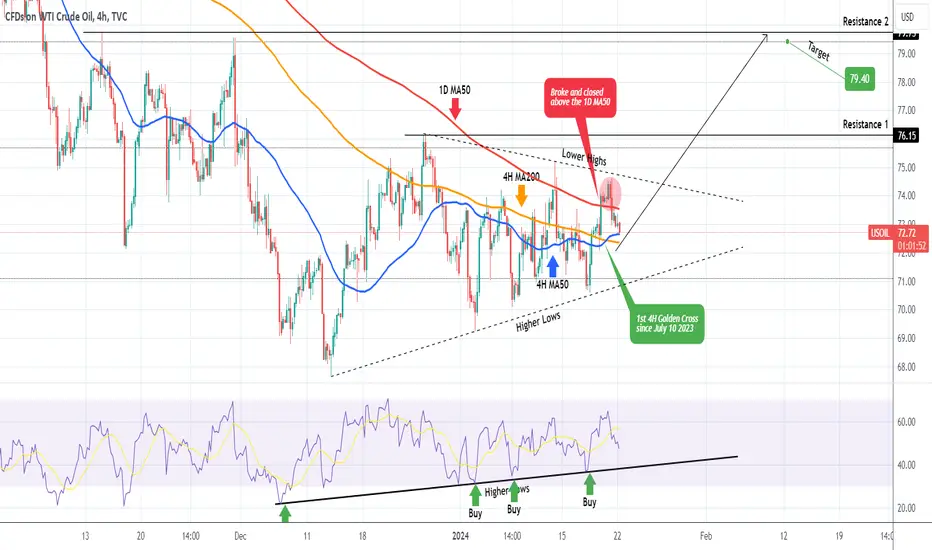
WTI OIL Major bullish signals last seen in July.WTI Oil (USOIL) Closed last week above the 1D MA50 (red trend-line) for the first time since July, which technically puts an end to the October - December 2023 downtrend but perhaps that's not the strongest bullish signal we've seen now. The asset completed on Friday a Golden Cross on the 4H time-frame, the first such formation since July 10th 2023.
That was at the start of a very aggressive rally up to late September to $95.00. We can yet speculate on such high target prices but on the shorter term, as long as the 4H RSI Higher Lows trend-line gives us another rebound, it should be enough not just to break above the Lower Highs of the price's Triangle but also above Resistance 1 (76.15). Our short-term target is 79.40, just below Resistance 2.
-------------------------------------------------------------------------------
** Please LIKE 👍, FOLLOW ✅, SHARE 🙌 and COMMENT ✍ if you enjoy this idea! Also share your ideas and charts in the comments section below! This is best way to keep it relevant, support us, keep the content here free and allow the idea to reach as many people as possible. **
-------------------------------------------------------------------------------
💸💸💸💸💸💸
👇 👇 👇 👇 👇 👇
How you can earn money from this ICT setup?Here you are, please read the summary about Oil price below~
📈 Oil prices surged in early trade on Thursday, extending the previous day’s sharp gains on concerns about Middle Eastern supply following disruptions at a field in Libya and heightened tension around the Israel-Gaza war.
🛢️ Brent crude rose 33 cents, or 0.42%, to $78.58 a barrel by 0101 GMT, while U.S. West Texas Intermediate crude futures rose 40 cents, or 0.55%, to $73.10.
📈 Both benchmarks rose by around 3% to settle higher for the first time in five days on Wednesday, with WTI seeing the biggest daily percentage gain since mid-November.
🚫 On Wednesday, local protests forced a full shutdown of production at Libya’s Sharara oilfield, which can produce up to 300,000 barrels per day. The field, one of Libya’s largest, has been a frequent target for local and broader political protests.
💥 Also on Wednesday, nearly 100 people were killed in blasts at an event to commemorate commander Qassem Soleimani who was killed by a U.S. drone in 2020. Iranian officials blamed unspecified “terrorists” and vowed revenge. However, no group has yet taken responsibility for the attack. The U.S. has seen no indication Israel was behind the blasts, White House national security spokesperson John Kirby said.
🔥 Swirling regional tensions from the ongoing Israel-Hamas war also continue to support oil prices.
🚀 On Tuesday, Hamas’ deputy leader was killed in a strike in Beirut - the first strike to hit the Lebanese capital in almost three months of near daily fire between the Israeli military and Iran-backed Hezbollah that had been confined to the border region.
🚢 Shipping concerns in the Red Sea also remained after Yemen’s Iran-backed Houthis said on Wednesday they had “targeted” a container ship bound for Israel. U.S. Central Command said the militant group had fired two anti-ship ballistic missiles in the southern Red Sea the previous day.
Technical Analysis:
As we can see there are demand zone and FVG near $68 to $70 since the middle of 2023.
Here is a sharp rebounce (Pin bar) on the demand zone. A good ICT Long setup for both Swing and Intraday traders!

WTI crude looks set to retrace before its next big leg higherWTI appears set tor a cheeky retracement. Volumes were falling during its leg higher from $68, and Wednesday closed with an exhaustion candle. Note the strong trading activity around $70 which indicates some bears were caught short and bulls initiated, which assumes short-covering helped fuel the rally and any retracement towards $70 could also be supported.
From here we’re looking for prices to revert to $70. But given the strong support around the June lows / $68 and false break of $70, the bigger picture view is for a bullish rally to develop following a retracement heading into the new year.
$80 seems feasible as an initial target, around the 200-day EMA. But as you’ll see in the next post, a bigger bullish reversal could be unfolding on the weekly chart.

oil and the secondary wave of inflation.before you read any further read my post from may:
---
in may of 2023 i called the top on oil and projected we come down into the $50-60 range. we ended up playing it out quite flawlessly. a lot of people were very angry at me for whatever reason back when i was calling for the top, probably due to their elevated levels of confidence and greed. those people got wiped out.
today, i bring to you a follow-up prediction, in line with my us10y prediction.
---
i'm predicting that oil hits $181 per barrel over the next year, which will cause a secondary wave of inflation.
---
oil w5 algo = $181

OIL in limbo, can go either way, waitingWe've called oil pretty decently before but a lil tough at the moment
Daily
#OIL has been in a bad downtrend.
Currently it is forming a symmetrical triangle.
Weekly
Oil is trading below its moving avgs.
Volume is lessening.
This is a hard commodity to call at times.
Anything can happen, war, cuts, etc...
Crude oil - $200 per barrelWe've all seen how oil reacted to the beginning of the Israeli-Palestinian conflict. I am sure that this conflict will not settle down quickly and will only increase. The conflict will involve other players in the region - Emen is proof of this fact.
How will oil react to this?
The suspension of supplies and other problems with oil supplies will provoke demand for oil and the price will go higher and in the next few years will renew historical highs up to $200 per barrel. I think this was calculated by the coalition of aggressor countries before the war started.
about TA
We see a strong horizontal level where there is a lot of liquidity (concentration of stop losses) which will be collected up to the level of the largest horizontal volumes from below. And only after that, we will see a global reversal, which is probably the end of the year - December
On the chart, I have shown levels from which I will try to take longs.
I hope there will be PEACE in the world.
Our world looks very humongous in terms of cosmic civilization sending tons of bombs to kill each other.
Best regards EXCAVO

WTI CRUDE OIL: Targeting the 1D MA50.WTI Crude Oil is rebounding today aggressively after hitting and holding the 1W MA200, which as we've discussed on our channel, has been the long term Support since February 1st 2021. The rebound has turned the 1D technical outlook neutral (RSI = 47.857, MACD = -0.970, ADX = 22.204) but the 1D RSI is inside a Channel Up, which indicates that there might be a hidden bullish divergence for the long term.
Nevertheless, we cannot discuss any +25% to +30% moves as those in April and July 2023 unless the 1D MA50 breaks. Until then, we will focus on the short term and aim just under the 1D MA50 (TP = 74.50).
See how our prior idea has worked:
## If you like our free content follow our profile to get more daily ideas. ##
## Comments and likes are greatly appreciated. ##

WTI OIL Bearish below the 1D MA50.WTI Oil (USOIL) got rejected two days ago near the 1D MA50 (blue trend-line), which has been the downward Resistance since October 24, despite the fact that the price marginally broke above the 3-month Channel Down.
As long as it stays below the 1D MA50, the trend is bearish and we will target the 68.00 Low. On the long-term though, this is a huge Buy Zone since March but the price only rallied sustainably when a 1D candle closed above the 1D MA50. The 1D RSI is technically repeating the December 2022 bottom pattern, but we will only engage in buying above the 1D MA50, in which case we will target 82.50, which is a level reached both on the March and July's rallies.
-------------------------------------------------------------------------------
** Please LIKE 👍, FOLLOW ✅, SHARE 🙌 and COMMENT ✍ if you enjoy this idea! Also share your ideas and charts in the comments section below! This is best way to keep it relevant, support us, keep the content here free and allow the idea to reach as many people as possible. **
-------------------------------------------------------------------------------
💸💸💸💸💸💸
👇 👇 👇 👇 👇 👇

Crude oil wants to make money to read this article!The recent rise and fall of crude oil, as a whole is a big shock, although it is an upward trend, but not so clear, yesterday's daily line is very unexpected unexpectedly closed the negative line, the rise is not coherent, such a market we understand as shock, today's thinking of shock more treatment, today's crude oil attention yesterday back to the low point is the bottom of the upward trend of 1 hour, Strong support is near 73.10, these two positions are the positions of bull sniping, and the positions of pressure are 75.50 and 76.50

Crude oil continues to go longIn recent days, we have been bullish on crude oil, whether it is the shape or the indicator has formed a big counterattack signal at the daily level of bulls, 74.40 resistance position has not been able to suppress the bulls of crude oil, yesterday we bought at 72.70 and took profits at 74.10! A perfect profit. So how does the oil trade at the current price?
