WTI Light Sweet Crude Oil, 5/30/23A two-sided framework continues through summer between 62.14 long-term support, and 82.93 long-term resistance, both regions able to contain seasonal activity.
Downside, a weekly settlement below 62.14 indicates 53.87 within several months, longer term Fibonacci support able to contain selling into later year.
Upside, a weekly settlement above 82.93 indicates 94.67 within several months, able to contain buying on an annual basis.
-
For Tuesday, 70.31 - 69.81 can contain weekly selling pressures, above which 75.53 remains a 3 - 5 day target, the next 3 - 5 weeks allowing 82.93 long-term resistance.
Upside Tuesday, 73.30 can contain intraday strength, beyond which 75.53 is attainable intraday and able to contain session strength.
A settlement today above 75.53 signals 77.35 within several more days, the targeted 82.93 within 2 - 3 more weeks.
Downside Tuesday, closing below 70.31 pivots the market south into later June, 62.14 long-term support then considered a 3 - 5 week target.
Crude Oil Futures WTI (CL1!)

CL1!: Short Signal with Entry/SL/TP
CL1!
- Classic bearish pattern
- Our team expects pullback
SUGGESTED TRADE:
Swing Trade
Short CL1!
Entry - 72.93
Stop - 75.24
Take - 69.49
Our Risk - 1%
❤️ Please, support our work with like & comment! ❤️

CL1! Will Go Lower From Resistance! Sell!
Please, check our technical outlook for CL1!.
Time Frame: 12h
Current Trend: Bearish
Sentiment: Overbought (based on 7-period RSI)
Forecast: Bearish
The market is testing a major horizontal structure 73.13.
Taking into consideration the structure & trend analysis, I believe that the market will reach 69.52 level soon.
P.S
Overbought describes a period of time where there has been a significant and consistent upward move in price over a period of time without much pullback.
Like and subscribe and comment my ideas if you enjoy them!

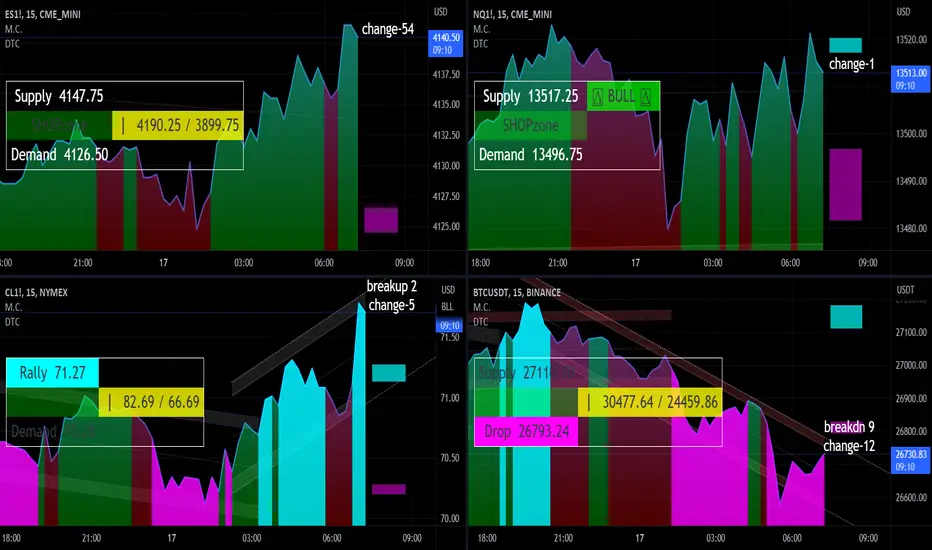
Day Trade Market Condition may 26, 2023Day Trade Market Condition may 26, 2023
levels for NQ ES CL BTC
watch the table left side for trade, right side for trend

WTI Light Sweet Crude Oil, 5/26/23For Friday, 70.22 - 70.21 can contain selling through next week, above which 75.13 remains a 3 - 5 day target, the next 3 - 5 weeks allowing 83.67 long-term resistance.
Upside Friday, 73.13 can contain intraday strength, beyond which 75.13 is attainable intraday and able to contain session strength.
A settlement today above 75.13 signals 77.35 within several more days, the targeted 83.67 within 2 - 3 more weeks.
Downside Friday, closing below 70.22 pivots the market south into later June, 62.14 long-term support then likely within 3 - 5 weeks.

Day Trade Market Condition mar 25, 2023this is may 25, 2023 levels for NQ ES CL BTC
watch the table left side for trade, right side for trend
ES above the liquidity 4139 day chart VWAP, one of these days it break such structure be patient. NQ maybe help pushing it

WTI Light Sweet Crude Oil, 5/25/23For Thursday, 70.13 - 70.61 can contain selling through the balance of May, above which 74.84 remains a 3 - 5 day target, the next 3 - 5 weeks allowing 83.67 long-term resistance.
Upside Thursday, 74.84 can contain session strength, while closing today above 74.84 signals 77.35 within several more days, the targeted 83.67 within 2 - 3 more weeks.
Downside Thursday, closing below 70.13 pivots the market south into June, 62.14 long-term support then likely by the end of June.

Day Trade Market Condition may 24, 2023this is may 24, 2023 levels for NQ ES CL BTC
watch the table left side for trade, right side for trend
ES pull back to liquidity 4139, ES/NQ likely react to this level. if ES shows selling NQ could fall to 13525. I could be wrong

Crude Oil (WTI) Bullish Pattern Forming 🛢️
It looks like WTI Crude Oil is forming an ascending triangle formation on a daily time frame
that signifies a bullish accumulation.
To confirm a bullish continuation, monitor the neckline of the pattern.
If the price breaks and closes above 74.3 that will confirm the strength of bulls.
A bullish continuation will be expected to 76.6 level then.
❤️Please, support my work with like, thank you!❤️

WTI Light Sweet Crude Oil, 5/24/23For Wednesday, 71.00 can contain selling through the balance of May, above which 74.58 remains a 3 - 5 day target, the next 3 - 5 weeks allowing 83.67 long-term resistance.
Upside Wednesday, 73.41 can contain intraday strength, beyond which 74.58 is likely and able to contain session strength.
A settlement today above 74.58 signals 77.35 within several more days, able to contain buying into later next week and the point to settle above for then yielding the more meaningful 83.67 within 2 - 3 more weeks.
Downside Wednesday, closing below 71.00 signals 70.02 tomorrow, where the market can place a weekly low and the point to settle below for indicating 62.14 within 3 - 5 more weeks.

Day Trade Market Condition may 23, 2023this is may 23, 2023 levels for NQ ES CL BTC
watch the table left side for trade, right side for trend
overnight, some selling occur, if below last Thursday might causing some panic for ES.

CL1!: Long Trading Opportunity
CL1!
- Classic bullish formation
- Our team expects growth
SUGGESTED TRADE:
Swing Trade
Buy CL1!
Entry Point - 73.18
Stop Loss - 70.96
Take Profit - 76.55
Our Risk - 1%
❤️ Please, support our work with like & comment! ❤️

CL1! Will Go Up From Support! Long!
Please, check our technical outlook for CL1!.
Time Frame: 8h
Current Trend: Bullish
Sentiment: Oversold (based on 7-period RSI)
Forecast: Bullish
The market is on a crucial zone of demand 72.77.
Taking into consideration the structure & trend analysis, I believe that the market will reach 76.39 level soon.
P.S
Please, note that an oversold/overbought condition can last for a long time, and therefore being oversold/overbought doesn't mean a price rally will come soon, or at all.
Like and subscribe and comment my ideas if you enjoy them!

WTI Light Sweet Crude Oil, 5/23/23For Tuesday, 71.40 can contain selling through the balance of May, above which 74.32 remains a 3 - 5 day target, the next 3 - 5 weeks allowing 83.67 long-term resistance.
Upside Tuesday, 73.41 can contain intraday strength, beyond which 74.32 is attainable intraday and able to contain session strength.
A settlement today above 74.32 signal 77.35 within several more days, able to contain buying into next week and the point to settle above for then yielding the more meaningful 83.67 within 2 - 3 more weeks.
Downside Tuesday, breaking/opening below 71.40 allows 70.02, while closing today below 71.40 will keep 69.19 in reach over the next several days, where the market can place a weekly low and the point to settle below for indicating 62.14 within 3 - 5 more weeks.

CL1! Will Explode! BUY!
My dear friends ,
I analysed this chart on CL1!, and concluded the following:
The asset is approaching an important pivot point 72.40
Bias - Bullish
Technical Indicators: Both Super Trend & Pivot HL indicate a highly probable Bullish continuation.
Goal - 76.49
My Stop Loss - 70.08
About Used Indicators:
Pivot points are a great way to identify areas of support and resistance, but they work best when combined with other kinds of technical analysis
———————————
WISH YOU ALL LUCK

Day Trade Market Condition may 22, 2023this is may 19, 2023 levels for NQ ES CL BTC
watch the table left side for trade, right side for trend

Day Trade Market Condition may 19, 2023this is may 19, 2023 levels for NQ ES CL BTC
watch the table left side for trade, right side for trend
notice to NQ a massive liquidity 14,000 /as for ES

Opening (Margin): /CL August 17th 35 Short Put... for a 1.20 credit.
Comments: Without much on here, doing one of my far out-of-the-money premium selling plays. A basic bet that /CL doesn't lose 50% of its current price per barrel by August opex. 1.20 ($120) max on buying power of around 8.10 ($810); 14.8% ROC as a function of buying power at max; 7.4% at 50% max.

WTI Light Sweet Crude Oil, 5/19/23For Friday, 72.33 can contain buying through next week, below which 68.77 is likely over that time horizon, possibly yielding 62.14 by the end of June.
Downside Friday, 71.69 can contain intraday weakness, below which 69.84 is attainable intraday and able to contain session weakness.
Closing today below 69.84 signals 68.77 on Monday, where the market can bottom out into later next week and the point to settle below for then indicating 62.14 within 2 - 3 weeks.
Upside Friday, pushing/opening above 72.33 allows 75.93, while closing today above 72.33 indicates 82.92 within 2 - 3 weeks, the start of a range of long-term resistance up to 84.41 able to contain buying into later summer.

Day Trade Market Condition may 18, 2023this is may 18, 2023 levels for NQ ES CL BTC
watch the table left side for trade, right side for trend

CL1! The Target Is UP! BUY!
My dear subscribers ,
I analysed this chart on CL1!, and concluded the following:
The asset is approaching an important pivot point 71.88
Bias - Bearish
Technical Indicators: Supper Trend generates a clear long signal while Pivot Point HL is currently determining the overall Bullish trend of the market.
Goal - 74.53
My Stop Loss - 70.16
About Used Indicators:
For more efficient signals, super-trend is used in combination with other indicators like Pivot Points.
———————————
WISH YOU ALL LUCK

WTI Light Sweet Crude Oil, 5/18/23For Thursday, 72.74 can contain weekly buying pressures, below which 68.77 is likely by the end of next week, possibly yielding 62.14 within 3 - 5 weeks.
Downside Thursday, 71.69 can contain intraday weakness, below which 69.84 is attainable intraday and able to contain session weakness.
Closing today below 69.84 signal 68.77 tomorrow, where the market can bottom out into later next week and the point to settle below for then indicating 62.14 within 2 - 3 weeks.
Upside Thursday, pushing/opening above 72.74 allows 75.93, while closing today above 72.74 indicates 82.95 within 2 - 3 weeks, the start of a range of long-term resistance up to 84.41 able to contain buying into later summer.

Day Trade Market Condition may 17, 2023this is may 17, 2023 levels for NQ ES CL BTC
watch the table left side for trade, right side for trend