TP FILLED ON USOILOur TP was filled on our trade for today on OIL, this was one of 2 trades we caught today and both reached the target.
Follow for more!
Crude Oil Futures WTI (CL1!)

SELL USOILI'm sharing with you our trade today on OIL that you can take, you can place your order following the same levels as mine.
Follow for more!

WTI OIL Weak price action on the medium-term.WTI Oil (USOIL) is extending the Bearish Leg of the Triangle pattern after the recent January 13 rejection on the 1W MA200 (orange trend-line). Until the 1W RSI turns bearish again, and more importantly the Support Zone gets hit, we expect this bearish trend to be extended.
The strongest Demand Level for the past 2 years has been this Support Zone, so our medium-term Target is on its top at $68.00.
-------------------------------------------------------------------------------
** Please LIKE 👍, FOLLOW ✅, SHARE 🙌 and COMMENT ✍ if you enjoy this idea! Also share your ideas and charts in the comments section below! This is best way to keep it relevant, support us, keep the content here free and allow the idea to reach as many people as possible. **
-------------------------------------------------------------------------------
Disclosure: I am part of Trade Nation's Influencer program and receive a monthly fee for using their TradingView charts in my analysis.
💸💸💸💸💸💸
👇 👇 👇 👇 👇 👇

CRUDE OIL - WEEKLY SUMMARY 3.2-7.2 / FORECAST🛢 CRUDE – 10th week of the base cycle (28 weeks), likely completing the 1st phase. The extreme forecast on February 3 worked as a reversal from the combined resistance of the MA20 and the large triangle boundary, which I mentioned in my last post. Holding the short position from the February 3 extreme forecast. The first phase of the base cycle isn’t over yet, but it is very mature.
⚠️ Note that the pivot forecast on January 17 marked a triple top with the extreme forecasts of July 1 and April 12 (Retrograde Mercury). This is a very strong resistance level. I maintain my bearish stance, which I explained in my crude oil post from summer 2024. Next pivot forecast for crude: February 11.

Market Forecast UPDATES! Tuesday, Feb 11In this video, we will update the forecasts for the following markets:
ES \ S&P 500
NQ | NASDAQ 100
YM | Dow Jones 30
GC |Gold
SiI | Silver
PL | Platinum
HG | Copper
Enjoy!
May profits be upon you.
Leave any questions or comments in the comment section.
I appreciate any feedback from my viewers!
Like and/or subscribe if you want more accurate analysis.
Thank you so much!
Disclaimer:
I do not provide personal investment advice and I am not a qualified licensed investment advisor.
All information found here, including any ideas, opinions, views, predictions, forecasts, commentaries, suggestions, expressed or implied herein, are for informational, entertainment or educational purposes only and should not be construed as personal investment advice. While the information provided is believed to be accurate, it may include errors or inaccuracies.
I will not and cannot be held liable for any actions you take as a result of anything you read here.
Conduct your own due diligence, or consult a licensed financial advisor or broker before making any and all investment decisions. Any investments, trades, speculations, or decisions made on the basis of any information found on this channel, expressed or implied herein, are committed at your own risk, financial or otherwise.

Support around 73.25 is the key
Hello, traders.
If you "Follow", you can always get new information quickly.
Please click "Boost" as well.
Have a nice day today.
-------------------------------------
(CL1! 1D chart)
The point to watch is whether it can rise above 73.25-74.62.
Since the M-Signal indicator and MS-Signal (M-Signal on the 1D chart) indicators on the 1W chart are passing around 73.25, it is expected to be the first resistance zone for the rise.
The M-Signal indicator of the 1M chart is passing around 74.62, so it is expected to be the second resistance zone.
-
If it receives resistance and falls,
1st: 70.64-71.0
2nd: 68.18-68.94
You should check whether there is support near the 1st and 2nd above.
-
(30m chart)
Resistance: M-Signal indicator of 1D, 1W chart
Support: 5EMA+StErr indicator of 1D chart (71.78)
-
Thank you for reading to the end.
I hope you have a successful trade.
--------------------------------------------------

SELL USOILBeen a while since I last posted a trade to take.
Here today you can sell on USOIL with the same TP and SL I set on my chart.
Follow for more!

Weekly Market Forecast: CRUDE OIL Can Go Lower!This forecast is for the week of Feb 10-14th.
OIL is still trending to the downside, and sells are still valid.
Until we see a bullish market break of market structure, sells all day.
CPI Data news on Wednesday, so be careful trading into news day.
Check the comments section below for updates regarding this analysis throughout the week.
Enjoy!
May profits be upon you.
Leave any questions or comments in the comment section.
I appreciate any feedback from my viewers!
Like and/or subscribe if you want more accurate analysis.
Thank you so much!
Disclaimer:
I do not provide personal investment advice and I am not a qualified licensed investment advisor.
All information found here, including any ideas, opinions, views, predictions, forecasts, commentaries, suggestions, expressed or implied herein, are for informational, entertainment or educational purposes only and should not be construed as personal investment advice. While the information provided is believed to be accurate, it may include errors or inaccuracies.
I will not and cannot be held liable for any actions you take as a result of anything you read here.
Conduct your own due diligence, or consult a licensed financial advisor or broker before making any and all investment decisions. Any investments, trades, speculations, or decisions made on the basis of any information found on this channel, expressed or implied herein, are committed at your own risk, financial or otherwise.

The Market Matrix - DXY, Gold, NAS & Crude for Feb 7 2025This weeks edition of The Market Matrix. Covering Gold, DXY, Nasdaq & Crude Oil.

WTI OIL 4H RSI Bullish Divergence hinting to trend reversal.WTI Oil (USOIL) has been trading within a Channel Down pattern since the January 15 High. Since yesterday it appears for the first time to have withdrawn from making Lower Lows. In fact, the 4H RSI has been on Higher Lows since January 27, which is a technical Bullish Divergence.
This hints to a potential trend reversal to bullish and the pattern that we can identify emerging is a Channel Up. This current potential bottoming pattern, resembles the January 08 Low which rallied above its 2.5 Fibonacci extension.
As a result, we can target the Channel's top (Higher Highs trend-line) at 76.50.
-------------------------------------------------------------------------------
** Please LIKE 👍, FOLLOW ✅, SHARE 🙌 and COMMENT ✍ if you enjoy this idea! Also share your ideas and charts in the comments section below! This is best way to keep it relevant, support us, keep the content here free and allow the idea to reach as many people as possible. **
-------------------------------------------------------------------------------
💸💸💸💸💸💸
👇 👇 👇 👇 👇 👇

Possible Crude Down to $30/BarrelSince the covid oil bull market we've yet to have a breakdown as supply catches back up with equilibrium. I would expect at some point we get a price back down to $30. First major support would potentially be $52.

WTI selloff stalls around cluster of big levelsWTI crude has seen a 11% correction from its January high, and 11 of the past 13 days since the high have been down days. But there is a glimmer of hope for bulls as prices are holding above several key levels of support, just above the $70 handle.
Tuesday's bullish pinbar held above respected the 200-day EMA and 50% retracement levels, while respecting the 200 and 50-day EMAs. It also saw a minor (and ultimately false) break of the $71 handle and November high.
While Wednesday was a down day, it was also an inside day. And this suggests a hesitancy to break immediately lower with demand around $71.
This may be on the scrappy side, but bulls could consider longs around the current lows and seek a rebound to either Wednesday's high, just beneath the $73. Though a higher target could be considered should a fundamentally bullish catalyst arrive.
The bias remains bullish above $70, but $70.49 could also be used to improve the reward-to-risk ratio.
Matt Simpson, Market Analyst at City Index

Oil Long - Capitulate First, Rise LaterMajority is long so give your SL some space while waiting for moon.

Market Forecast UPDATES! Tuesday, Feb 4thIn this video, we will update the forecasts for the following markets:
ES \ S&P 500
NQ | NASDAQ 100
YM | Dow Jones 30
GC |Gold
SiI | Silver
PL | Platinum
HG | Copper
Enjoy!
May profits be upon you.
Leave any questions or comments in the comment section.
I appreciate any feedback from my viewers!
Like and/or subscribe if you want more accurate analysis.
Thank you so much!
Disclaimer:
I do not provide personal investment advice and I am not a qualified licensed investment advisor.
All information found here, including any ideas, opinions, views, predictions, forecasts, commentaries, suggestions, expressed or implied herein, are for informational, entertainment or educational purposes only and should not be construed as personal investment advice. While the information provided is believed to be accurate, it may include errors or inaccuracies.
I will not and cannot be held liable for any actions you take as a result of anything you read here.
Conduct your own due diligence, or consult a licensed financial advisor or broker before making any and all investment decisions. Any investments, trades, speculations, or decisions made on the basis of any information found on this channel, expressed or implied herein, are committed at your own risk, financial or otherwise.

The Market Matrix - Gold, Crude, DXY & Nasdaq for Feb 1 2025This weeks edition of The Market Matrix.
Disclaimer
The information provided in this content is for educational and informational purposes only and should not be construed as financial advice, investment recommendations, or an offer to buy or sell any securities or financial instruments.
Trading financial markets involves significant risk, including the potential loss of capital. Past performance is not indicative of future results. You are solely responsible for your trading decisions and should conduct your own research or consult with a licensed financial advisor before making any financial decisions.
The creator of this content assumes no liability for any losses or damages resulting from reliance on the information provided. By engaging with this content, you acknowledge and accept these risks.

Crude OilUS Oil - Crude Oil
Bearish Channel as an corrective pattern in Short Time Frame
Break of Structure
RSI - Divergence
Completed " 12345 " Impulsive Waves and " A " Corrective Waves
Demand Zone

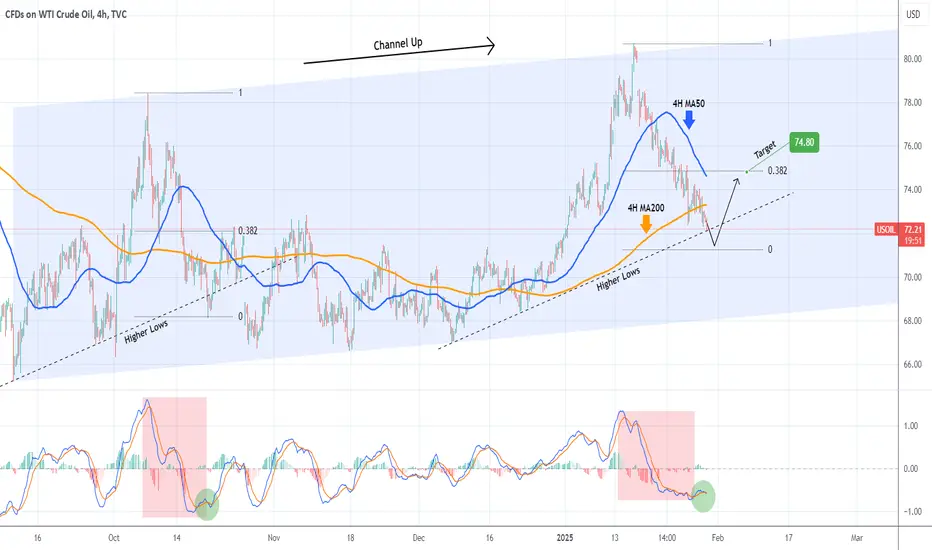
WTI OIL on a Bearish Leg but short-term rebound expected.WTI Oil (USOIL) has been trading within a Channel Up pattern that is unfolding its latest Bearish Leg. This Leg just hit the Higher Lows trend-line from the last bottom, which is so far no different than what took place during the previous Bearish Leg on October 18 2024.
The 4H MACD sequences among the two fractals are very similar so, as the October price action did, we expect a marginal breach of the Higher Lows followed by an instant rebound above the 4H MA50 (blue trend-line) and towards the 0.382 Fibonacci retracement level. As a result our short-term Target is $74.80.
-------------------------------------------------------------------------------
** Please LIKE 👍, FOLLOW ✅, SHARE 🙌 and COMMENT ✍ if you enjoy this idea! Also share your ideas and charts in the comments section below! This is best way to keep it relevant, support us, keep the content here free and allow the idea to reach as many people as possible. **
-------------------------------------------------------------------------------
💸💸💸💸💸💸
👇 👇 👇 👇 👇 👇
The Market Matrix - Gold, Crude, Nasdaq & DXY for Jan 26 2025This weeks edition of The Market Matrix.
Disclaimer
The information provided in this content is for educational and informational purposes only and should not be construed as financial advice, investment recommendations, or an offer to buy or sell any securities or financial instruments.
Trading financial markets involves significant risk, including the potential loss of capital. Past performance is not indicative of future results. You are solely responsible for your trading decisions and should conduct your own research or consult with a licensed financial advisor before making any financial decisions.
The creator of this content assumes no liability for any losses or damages resulting from reliance on the information provided. By engaging with this content, you acknowledge and accept these risks.

Weekly Market Forecast Jan 27 - 31stThis is an outlook for the week of Jan 27-31st.
In this video, we will analyze the following FX markets:
ES \ S&P 500
NQ | NASDAQ 100
YM | Dow Jones 30
GC |Gold
SiI | Silver
PL | Platinum
HG | Copper
The indices are still moving higher, as investors are moving money from the USD to the equity markets, riding the Trump Pump. We'll see how long the euphoria will last, and how the market responds to a bevy of policy initiatives and executive orders by the US President.
Enjoy!
May profits be upon you.
Leave any questions or comments in the comment section.
I appreciate any feedback from my viewers!
Like and/or subscribe if you want more accurate analysis.
Thank you so much!
Disclaimer:
I do not provide personal investment advice and I am not a qualified licensed investment advisor.
All information found here, including any ideas, opinions, views, predictions, forecasts, commentaries, suggestions, expressed or implied herein, are for informational, entertainment or educational purposes only and should not be construed as personal investment advice. While the information provided is believed to be accurate, it may include errors or inaccuracies.
I will not and cannot be held liable for any actions you take as a result of anything you read here.
Conduct your own due diligence, or consult a licensed financial advisor or broker before making any and all investment decisions. Any investments, trades, speculations, or decisions made on the basis of any information found on this channel, expressed or implied herein, are committed at your own risk, financial or otherwise.

SELL USOILBeen a while since I last posted.
Today's trade is on OIL, you can sell and target the LQ zone I targeted and set the same SL as mine.
Follow for more!

WTI OIL Channel Up emerging, aiming at $90.WTI Oil (USOIL) recently broke above its 15-month Lower Highs trend-line that has been keeping it under a bearish trend and is now naturally pulling back. This technical pull-back is so far within the tolerance levels of a bullish trend.
The pattern that making use of this trend is a Channel Up, newly emerged and now about to test the 1D MA200 (orange trend-line) as a Support for the first time since August 14 2024. As long as it holds, we expect the new Bullish Leg to start and as with the Jan - Apr 2024 Channel Up, rise towards the 1.786 Fibonacci extension. Our Target is quite below it at $90.00.
-------------------------------------------------------------------------------
** Please LIKE 👍, FOLLOW ✅, SHARE 🙌 and COMMENT ✍ if you enjoy this idea! Also share your ideas and charts in the comments section below! This is best way to keep it relevant, support us, keep the content here free and allow the idea to reach as many people as possible. **
-------------------------------------------------------------------------------
💸💸💸💸💸💸
👇 👇 👇 👇 👇 👇

WTI OIL expecting a +10% rise.WTI Oil (USOIL) has been trading within a Channel Up, supported by the 4H MA50 (blue trend-line) since the December 27 break-out. The price has already made contact with the bottom of the pattern (Higher Lows trend-line) so it is already a buy opportunity.
The ultimate buy signal technically, however, has been the 4H RSI Higher Lows since the December 06 Low, so it is possible to see one more small pull-back before the trend reverses.
Since the previous two Bullish Legs have increased by at least +10% since their 4H RSI Lows, we are targeting $84.40, which is the Resistance 1 level, exactly on the +10% mark.
-------------------------------------------------------------------------------
** Please LIKE 👍, FOLLOW ✅, SHARE 🙌 and COMMENT ✍ if you enjoy this idea! Also share your ideas and charts in the comments section below! This is best way to keep it relevant, support us, keep the content here free and allow the idea to reach as many people as possible. **
-------------------------------------------------------------------------------
💸💸💸💸💸💸
👇 👇 👇 👇 👇 👇

OUR TRADE TODAY ON USOILMy clients and I today too 2 trades, one on Oil and the other one on Nasdaq, we entered after that the market gave us a reversal point to target the liquidity level, which the market filled later in the day.
I didn't post it since we had to focus on recovering the losses silently, since we did, I'll be reposting again.
Follow for more!
