Crude Oil - Two Scenarios and about Brain PowerPrice retests the L-MLH.
VI. - Price breaks upward, target is the centerline
VII. - Price reverses again, then the target is the 1/4 line, with a subsequent extended target at the red centerline, and possibly even lower at the white dashed warning line.
On a personal note:
I was once again told that the price didn’t do what I had projected.
...yeah, really, that’s how it is §8-)
After over 30 years in the markets and hundreds of coaching sessions, I’m still amazed that people think you can predict price movements as if with a magic crystal ball.
The fact that this belief still persists (even though they don’t understand even the absolute basics of trading) deeply concerns me at the core of my trading soul.
Because this growing irrationality clearly indicates that far too little is being done in terms of education – or humanity might simply go extinct in the next 100 years due to rapidly declining intelligence!
...maybe I should just create a chart and apply a few median lines/forks?
Happy trading to all of you and I pray for those with lesser brain power.
Cl1!short

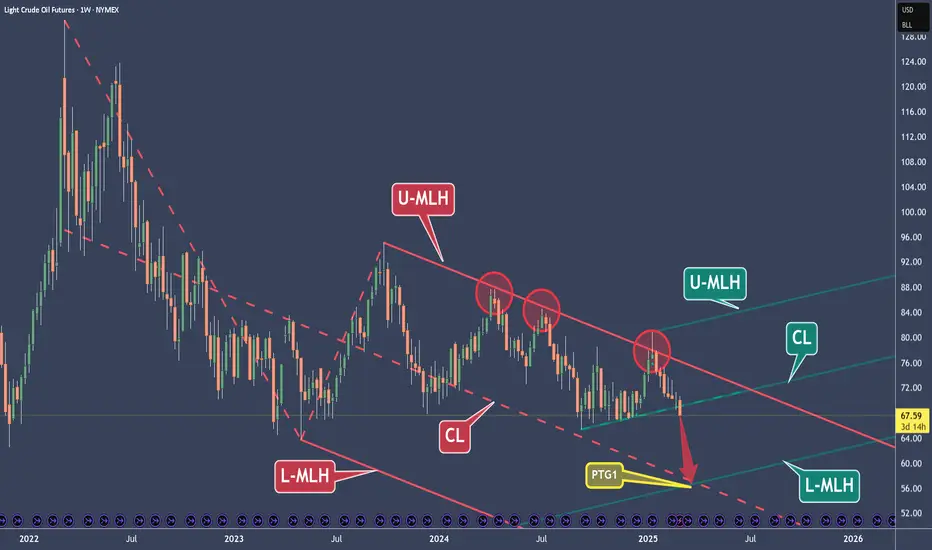
Crude Oil – A $10 Short with a Valuable LessonThe price hit the Upper Median Line Handle (U-MLH) three times and was rejected each time (red circles). These were all high-potential short trade opportunities.
However, none of these short trades managed to reach the Profit Target Goal (PTG) at the Center Line (CL). When the price repeatedly fails to hit the CL, it often builds up momentum for a larger move.
The last short opportunity from the U-MLH was at Circle #3. If you missed it, you have another chance now. Breaking the "shelf" (the petrol support line) is just like breaking a Median Line or a Center Line. It’s not magic—though it may sometimes seem like it.
The three slanted petrol lines extending to the right function the same way as a fork. So, we just broke the (petrol) Center Line, right?
Now, where is the price likely to go after breaking this (petrol) Center Line?
That’s right! There is about an 80% probability that it will move towards the (petrol) Lower Median Line Parallel.
What a coincidence—it aligns exactly with the red Center Line!
Of course, this is all based on probabilities, not guarantees. We can't predict the future, but we can rely on rules, statistics, and knowledge.
I hope you learned something today.
If you enjoy my work, I’d appreciate it if you like and share it with others.
Have a great day! 😊
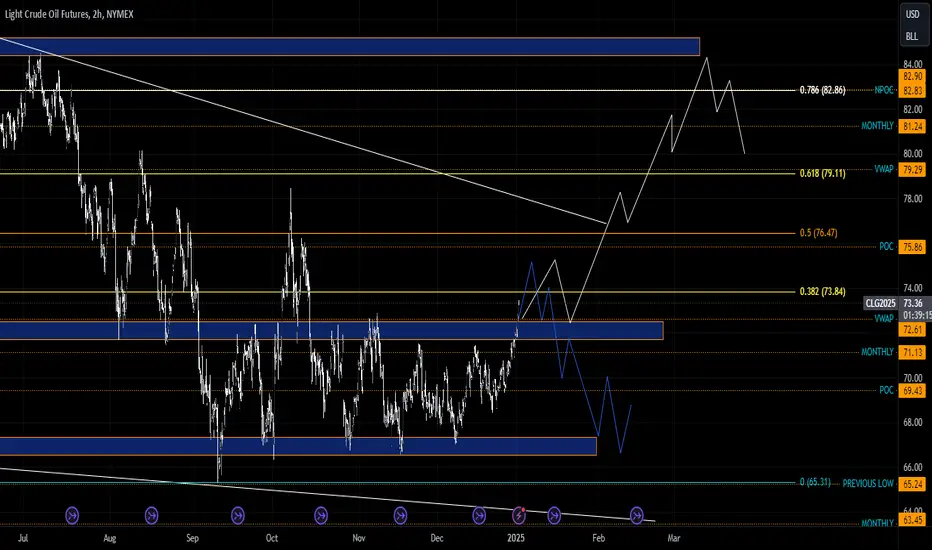
CL1! Scenario 2.1.2025 The price has currently broken through one of the main resistances and we have oil at 73 and then I have two scenarios: either the price does not break through the support at 72.5 and goes up, but I would like to see an sfp below the low, if we were to consider a short, I would like an sfp above the high, then there would be a potential entry.
Scenario on light crude oil cl1! 13.12.24If we can maintain the main monthly level, which is also support for the price of 71.66-72.44, then it is likely that the market will come for levels around 65, but if the market were to break through this level, then there is a possible scenario that the price could go higher and I would take the first tp somewhere around 75, but there are other big levels above that and the price could even reach 80.

CL1! Chart Idea - Swing Short SetupSwing Short Trade Setup - 8-10 Weeks
Entry: 82.00
TP1: 74.10
TP2: 66.86
SL: 84.84
RR: 5 to 1

Crude Oil Trade Idea for Next Week - CL CLK2024 USOIL Crude OilThe weekly candle close this week respected the bearish weekly volume imbalance, respected the bearish weekly orderblock, and failed to close above the previous weeks high.
For this reason, I am targeting the PWL as a DOL.
I will be looking for price to trade up into H4 premium arrays and reject from them. Once I see bearish arrays being respected on the H4, I will look for m15 bearish displacement to confirm entry with the PWL as the target.

WTI bears eye a move down to $80Last week's swing trade to $90 worked out well, yet momentum ha since shifted lower.
I noted in the recent COT report that managed funds and large speculators have been trimming long exposure in recent weeks, and that managed funds increased short exposure last week despite the slew of negative headlines surrounding the Middle East conflict. This also coincided with the two small bullish weekly candles, which appeared to be corrective on the weekly chart - and therfore suggests lower prices.
A lower high has formed below $90 and momentum turned lower. As support has been found around the Jan/April highs, we suspect a bounce is due. And this could allow bears to fade into favourable prices below $87 - $87.50 on the assumption a breakdown is pending ahead of its move to $80.
Should this be part of a larger decline, note that $75 and $70 are near the 100% and 138.2% Fibonacci projection levels on the daily chart.

WTI prints key reversal day ahead of FOMCWhilst we retain our view that oil prices could be headed for $100 further out, the trend seems to have hit a speed bump over the near-term.
WTI broke above $90 with ease yet faltered around $95 with a shooting car candle with high volume (which makes it a potential key reversal day). A bearish divergence has also formed with the RSI (2) after it reached overbought.
With the potential for the Fed to be more hawkish than expected, it could provide the catalyst for a pullback on WTI. A break below $90 confirms the near-term reversal is underway, with $87 making an initial target around the volume node from its preceding leg higher. $85 could also provide support around the August highs, which might tempt dip buyers more focussed on the fundamentals currently supporting higher oil prices.

$74 could be pivotal for WTI over the near termCommodities were broadly lower yesterday with the CRB index falling to a 4-day low. Geopolitical tensions are rising following Russia’s decision to back out of a key grain deal which allowed Ukraine to export grain through the Black Sea. Weak data from China and news that Libya will restart oil production also saw WTI fall for a second day.
What has caught our eye is that WTI played very nicely with its round numbers yesterday, printing the high of the day at $76, a lower high at $75 and lows around $74. It is also considering the break of a trendline, although unless volatility picks up it runs the risk of moving sideways through it (which is not in the spirit of a trendline break).
Still, $74 appears to be a pivotal level over the near-term. And if prices print a minor bounce, we’d still consider shorts below $75 with a view for it to trade to $73. Take note that it is contract expiration today so we may see spills of undesirable volatility, but overall we want to see which way momentum takes this market next.


CL1!: Short Signal with Entry/SL/TP
CL1!
- Classic bearish pattern
- Our team expects pullback
SUGGESTED TRADE:
Swing Trade
Short CL1!
Entry - 72.93
Stop - 75.24
Take - 69.49
Our Risk - 1%
❤️ Please, support our work with like & comment! ❤️

CL1! Will Go Lower From Resistance! Sell!
Please, check our technical outlook for CL1!.
Time Frame: 12h
Current Trend: Bearish
Sentiment: Overbought (based on 7-period RSI)
Forecast: Bearish
The market is testing a major horizontal structure 73.13.
Taking into consideration the structure & trend analysis, I believe that the market will reach 69.52 level soon.
P.S
Overbought describes a period of time where there has been a significant and consistent upward move in price over a period of time without much pullback.
Like and subscribe and comment my ideas if you enjoy them!

CL1! Will Fall! Short!
Please, check our technical outlook for CL1!.
Time Frame: 1D
Current Trend: Bearish
Sentiment: Overbought (based on 7-period RSI)
Forecast: Bearish
The market is testing a major horizontal structure 79.46.
Taking into consideration the structure & trend analysis, I believe that the market will reach 73.95 level soon.
P.S
The term oversold refers to a condition where an asset has traded lower in price and has the potential for a price bounce.
Oversold refers to market scenarios where the instrument is traded considerably higher than its fair value. Overvaluation is caused by market sentiments when there is positive news.
Like and subscribe and comment my ideas if you enjoy them!

WTI falters around $70Oil prices fell to a 15-month low as investors fretted over the potential for a financial meltdown. Whilst that is yet to fully materialise (or if it does at all), investors remain a little on edge - with news of the latest Hindenburg report accusing Block (SQ) of fraudulent activity not likely to quell fears.
WTI has manged to lift itself from its 15-month lows, yet volumes declined over this period to suggest the move was corrective. A bearish Pinbar also formed, which not only failed to test the $72.46 breakout level but also closed back below $70 and the December low. Also note that a bullish hammer has formed on the US dollar index (DXY).
- We're now waiting for a break of Wednesday's low to assume bearish continuation, with target zones made up of Fibonacci expansions and round numbers residing around $65 and $60 in focus.
- The bias remains bearish below $72.46, although yesterday's high can also be used if a tighter approach to risk management is preferred.


CL1!:Short Trading Opportunity
CL1!
- Classic bearish pattern
- Our team expects fall
SUGGESTED TRADE:
Swing Trade
Short CL1!
Entry - 87.23
Stop - 91.28
Take - 81.15
Our Risk - 1%
Start protection of your profits from higher levels.
❤️ Please, support our work with like & comment! ❤️

CL1!: Short Trade Explained
CL1!
- Classic bearish pattern
- Our team expects pullback
SUGGESTED TRADE:
Swing Trade
Sell CL1!
Entry Level - 95.26
Stop Loss - 101.39
Take Profit - 86.05
Our Risk - 1%
Start protection of your profits from higher levels.
Like & Comment Our Analysis, Please!
❤️ Please, support our work with like & comment! ❤️

CL1! Time To sellafter the creation of the double top we wait for the breakout of the neckline and we can take the sell position


cl1! time to sell
after the breakout of a strong support with strength we can take the sell position

CL1! time to sell after having a strong breakout of a strong support from a large candle with a large volume we can take the sell position

CL1! Time to sellafter having an uptrend we will see a downtrend after having a force breakout of the range

Nice short on crudeLooks pretty clean, im bearish on commodities in general because theres gonna be not just a decline in inflation... but deflation too!
