$USDCAD with $WTI showing signs of weakness. Correction rally?Technicals on the chart.
Pink dotted line is where the previous rate cut happened. (Old resistance)
Looking for it to hold here and test 1.2300s area.
Fundamentals on related idea.
Cl_f

Bearish Bat-man or a piece of crab?The pattern has been fulfilled ...out of market but looking for a potential short
On the monthly chart WTI has reached a 88.6 retrace (See link underneath)
I'm expecting some back and forth with the lady and tap dancing on the spot.
This possible bearish bat could turn into a crab instead... but follow the notations on the chart.
Take profit along the way
Safe trading ladies and gents!
@BLawrenceM
If you find my charts useful - consider following me on Twitter.
I do updates there on my TV-published charts and annonces quick scalp plays whenever found..

Became never a valid pattern !Became never a valid pattern. It was made in the early minutes after little swing up.
B Leg exceeded the 61.8 and later the 78,6 and went for a test of latest swing low.
-------------------------------
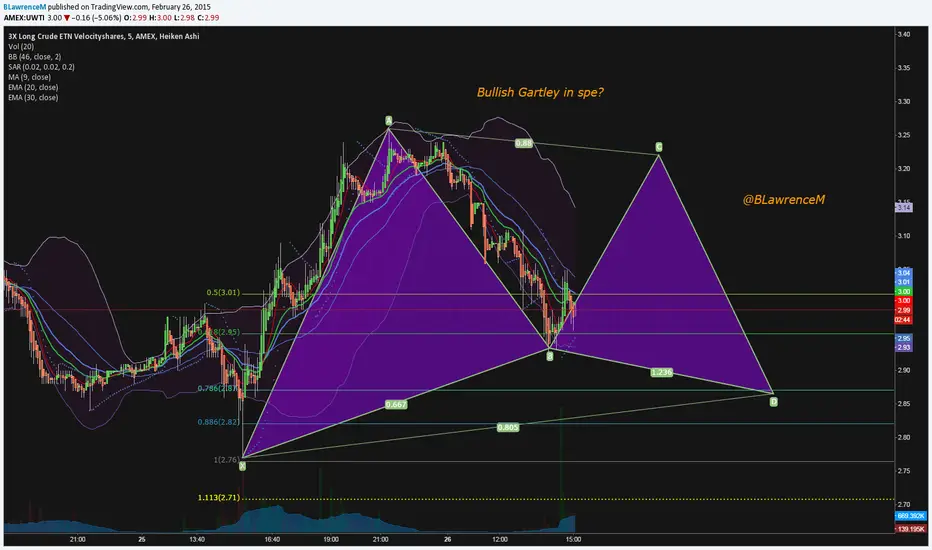
It's in the early minutes of a possible Bullish Gartley.... BUT... and there are several BUT(T)s that still can twerk this pattern apart.
Nothing is for sure yet!
We have to see where the C-leg ends and for that matter also counting in the B-leg as well.
We don't know if the B-leg is in yet ... but if it is ...a Bullish Gartley could be the outcome or at least a bullish harmonic pattern with a deeper D-leg.
Safe trading ladies and gents!
@BLawrenceM

A Possible Bearish Shark ....No longer! See Comments why!If reversal here at the 2.90ish and a gap close there is a possibility of a Bearish Shark
------------------------------------------
Have sold at the second spike at 2.14. Entry was at 2.89.
It looks more bearish now. No follow through and a full retrace of spike. I doubt we'll see the Bearish Shark. Next possibility is a Bearish Cypher. That will retest the 1.272 or a test of recent lows at the 1.618 fib. I could see that coming with a close under 2.89.
I'll will re enter on strength !
Safe trading here ladies and gents!
_________________________________
Time will tell
Safe trading ladies and gents!
@BLawrenceM

To the bearish batmobile...let's go ??Oil really a teaser these days.... in range not willing to break out either way (See my linked chart)
Safe trading
Ladies and gents!
@BLawrenceM
Music at work:
www.youtube.com

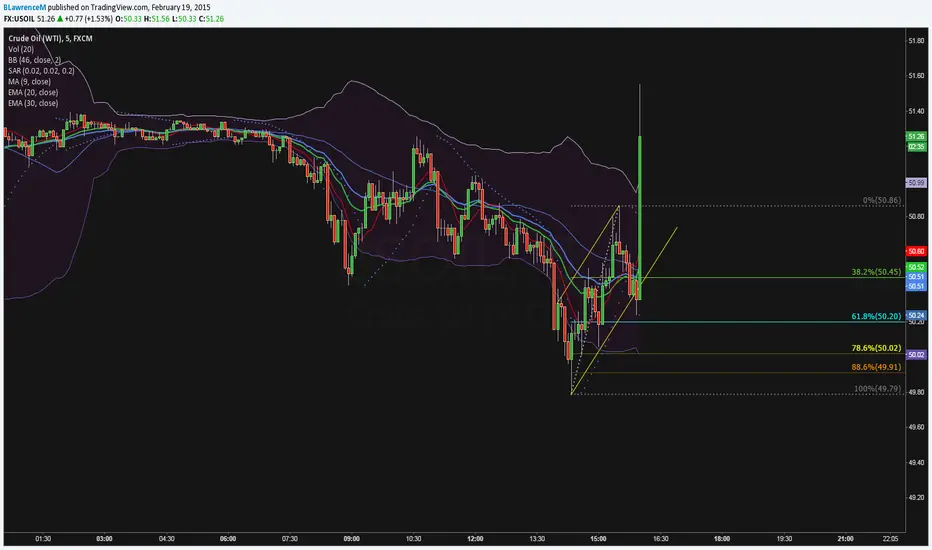
Oil "Going higher" ?First of all Bull flag!
Many E-wave combinations right now .... this is though what I see the most ... "We're going higher" testing red overhead resistance
So the chart is subject to changing wave count! Not altimate count!
Have to clear EMA 34 and the the sky is open for the test, but price will maybe stay there for ½ to 1 hour before ema13 have moved closer to a cross over. Price can even retest the blue line again! So nothing for sure ... but my best guess right now.
Positive divergens on RSI and AO indicator
Safe trading ladies and gents!
@BlawrenceM
Music at work:
www.youtube.com
open.spotify.com

5/10 wk x-over watchLot of pundits on Crude Oil. The MA cross overs is a first bullish start to consider long

I believe I can flyBowtie in full effect
No need to say i'm long but have learned over night to do the TA on the real commodity instead of the derivative
'Safe trading gents
@BLawrenceM
Music at work:
www.youtube.com
open.spotify.com
Follow me on twitter if you like my charts and my work and need intraday updates.
"Caught up" in MA's rhythm .. Dancing shoes off the shelves!!! For me...a lesson was learned today ... Have to do the TA on the security instead of the derivative. Oil looks ok see USOIL chart below:
--------------------------
Futures are decisively lower after close of market than the lower trendline drawn in.
So last chance for the E wave count would be to attach the lower trend line to the B-leg wick that gives a tolerance for a drop to the 3.20. See chart below
It would take a "good" API report to bring it up closing the gap..... and go further!!!
----------------------------------------
Written yesterday before close
----------------------------------------
Seems like E is done today and wave C up can begin.
Due to the negative sentiment....
we could see a gap up tomorrow.
That would spark the short squeeze needed to get oil up to target.... wave 4 of lower degree.
Low risk entry with a stop at 3.32
Safe trading ladies and gents
@BLawrenceM
Music at work:
www.youtube.com
open.spotify.com
NB The white B is missing at the top of 4.13 (see chart underneath)

Possible IHS on UWTIThis chart is no longer due. Pattern has panned out !!!
Possible IHS is setting up on UWTI with a possible target at the 3.78-80 ish handle.
Remember neckline has to be taken out in a convincingly manner for the IHS to be valid.
Safe trading ladies and gents!
@BLawrenceM
N.B.
If you like my charts you can get more updated by following me on Twitter

Oil... U have "No Enemiesz" in those dancing shoes!A follow up (dance)chart to my other bullish ones.
Here I see a potential ABCD setting up with a huge reward.
Notation on chart...but ..:
Entry at 3.56
Riding it to PRZ
Stop at 3.33
Safe trading ladies and gents
I'm not saying oil stop at the 127.2 or the136.2 extension. It could go as far as the 161.8 - but I make no promises.
What I say is...take some chips off around the mentioned fibs.
Time will tell..... as always
@BLawrenceM
Music at work
www.youtube.com
open.spotify.com

"Somebody" sees Oil/Crude//UWTI has bottomed? Bullish EW-countOn the 4 hour chart I see the following bullish signs:
Red W3 and W5 was made on a positive divergens
Orange W1 was 5 waves up
Orange W2 is a triangle that needs to make the last E-wave (That could be very brief back to the 50 fib line or less - the 61.8 that makes a 38.2 retrace (very common)
EMA 13 has crossed EMA 34
The count above is the very bullish count
We could as well just see an ABC up instead of 5 waves up - Time will tell!
Safe trading ladies and gent!
@BLawrenceM
Music at work:
www.youtube.com
open.spotify.com

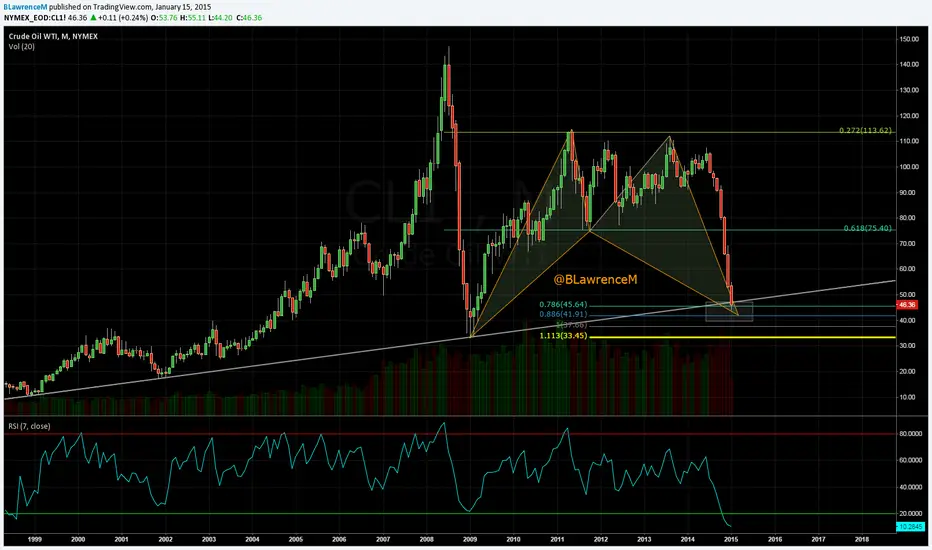
When USOIL SNAPs Back you'll "Dance to the Rhythm"!!Almost there ... have your dancing shoes ready!
The question is...... at fib 78.6 or the 88.6 fib retrace?
I'd say we'll very soon see a bounce (remember it's a monthly chart) and a possible retest a little lower at around 42.
BUT could make a possible bottom here.
The instrument is right now more oversold than ever before when looking at the the monthly RSI but a flattening has started.
For finding a similar oversold situation you have to go way back - to the 86 crash to see same RSI level.
Safe trading ladies and gents!
@BLawrenceM
Music at work
www.youtube.com
open.spotify.com
If you find my charts useful - consider following me on Twitter.
I do updates there on my TV-published charts and annonces quick scalp plays all day long.