Clams goes nuclear/ CLAMS USD LONG PRICE FORECASTConsolidating 4 years time nearly.
After reaching LL in previous cycle, reached bottom in a value of 2500 sats (which is basicaly 200 times less than CLAMS ATH) in sats terms (ratio over BTC).
Now, after gaining nearly 10X current price value (up to 24.000 sats, making ATH) and dropping all the way down to 5500sats, then retested previous high on as making LH on 15.000sats level, sank again to the very bottom where on daily timeframe we have consecutive price retest at current (5500sats level) which can be considered as a strong retest (basicaly lost 80% of entire value), wiped out.
Money is still there, it up to the people how long will they hold it, when they should sell it or make a rebuy on it.
Clams on daily seems superb.
5500 is the bottom
Target is roughly previous lower high (15.000 sats)=near to 300% gain on it.
In optimistic scenario we are heading back to previous high (21$), which would be 400% return.
Technicaly, CLAM is daily MACD bullish and there comes a weekly cross as well along with another parameters implying on a same thing.
Buy CLAM on bottom and be patiend week or two.
Good luck
PS.
I dont provide disclaimer, since i m not fake.
Cheers
CLAMBTC

Triangle. Watch and cry because there is no chance to buy:(Chart is self explanatory.
Good picture, bad coin, low liquidity, no chance to buy at least for 1 BTC without paying extra %.

Triangle. Target .0007Chart is self explanatory.
Expecting to see some actions by the end of the week.
Problem is low liquidity (0.5 BTC max)

I'm a $CLAM bull . Believe it or not!I still believe my 2013-2014 coin theory stands true and $CLAM will go UP UP UP!
I'm a bull I guess...
This one has been YEARS in the making...

Clam Wants to ClimbClams is bullish from here. Showed bullish divergence, a Double EMA Cross over with a good bounce on the retest. Easy climb for 2X target. Goodluck! Not a Financial Advise.

CLAM - Elliott wavesThe downward trend to 33435 has been reached, which means that CLAMS will soon be ready to go up again, with this revised correction wave, we recommend having a target lower than target fibs.
EP: 37210
TP: 110369
TG: 157618
Do not forget SL to DCB room with altcoin that has continuous DCB history like CLAMS
Like, share and follow if you like, thanks!

CLAM/BTC trading in the greenPrice is trading in the green after the breakout above the 250% Fibonacci line, but it remains to see if it will reach and retest at least the sliding line (sl1). A failure to approach and reach the near-term resistance levels it will send the rate down at least till the lower median line (lml). A valid breakdown will announce a significant drop.

CLAM/BTC reached the first upside targetPrice has resumed the bullish movement and it has reached the first sliding line (sl1), but unfortunately has failed to stay near it. I've told you in the previous days that only a valid breakout above the 50% line, above the sliding line (sl) and above the 250% will confirm a broader upside movement.


CLAMBTC - Trendline AnalysisCLAM is both traded at Poloniex and Bittrex, it has dumped a while back and has been silent since then, at least that is how linear charts look because on logarithmic we can clearly see the trend in a better perspective. In this chart we got the absolute top and downtrend support creating this large triangle which is consolidating, if this would break out in the future we can expect a larger breakout. So far I've seen some fractals that look quite familiar and labeled them in Phases. The fractal I copied also fits the trend lines and would make a good expectation. T
rade with good risk management and should be okay, happy trading!
-TheTrex

CLAM/BTC is bullish!!! (bullish divergence+wedge formation)I see bullish divergence at macd histogram + wedge formation for CLAM/BTC.
Profit Targets:
0.00052090
0.00052550
0.00053025
0.00053680
Stop Loss:
0.00050570
Have a nice day,
Berk

I got a feeling about good old $CLAMs (CLAM). Will it rise againI got a feeling about good old $CLAMs (CLAM). Will it live again? This is CRYPTO!
Steemit Link:
steemit.com
Rule #1: Expect the Unexpected...
Although this coin dumped hard back in October 2017, here are some factors that may indicate an impending move upwards.
DISCLAIMER:
I wrote this article myself, and it expresses my own opinions. I am not receiving compensation for it, and I have no business relationship with any company member mentioned here.
I own a very small bag of $CLAM.
This is a VERY RISKY investment and this strategy is based much on speculation. I could obviously be wrong. I am not responsible for any trading decisions. PLEASE, DYOR.
INVESTMENT RISK/REWARD:
* High Risk
* Potential +69% return
* Buy Range: 40-52 sats. Sell Range 60-70-80-90+
* Time Frame: By first week of May.
QUICK MARKET QUICK OVERVIEW (APRIL 19 2018)
* MARKET CAPITALIZATION $12,731,149
* 24 HOUR TRADING VOLUME $278,117
* 24H LOW / 24H HIGH $4.07 / $4.37
* Circulating Supply: 2,969,255 CLAM
* Total Supply: 16,665,869 CLAM
RECENT
* $CLAMs (CLAM) launched in 2014. Many 2013 and later coins have mooned, but $CLAMs has not. It dumped.
* $CLAM dumped real hard late last year. Ouch!
* It's time for either a move upwards or project death. Not that many options!
MEDIA
* $CLAM was spotted at the Block Hack 2018 conference in i.imgur.com
* $CLAM was mentioned on John Oliver show LOL imgur.com
SOCIAL
* There has been extended silence across social media for many months. Little activity.
TA
* There is visible accumulation and resistance in our current range across all trading exchanges.
* Rolled into the Ichomuku cloud this past week.
DEV
* Original / Official Github has no activity or commits in over a year
* HOWEVER, @BayAreaCoins comments on Reddit on April 18 2018- "CLAM is being developed and the new wallet is about to be released after Xploited is finished testing it."
(source: www.reddit.com)
* New Wallet = Move Upwards.
TRADING AND EXCHANGES
* $CLAM trades against $DOGE, $LTC, $BTC, and $ETH.
* $DOGE has been rising steadily so maybe 'THEY" will use $CLAM as an exit?
ORDERBOOK
* Asks increasing, Sell walls moving further awayfrom average mean.
PROJECT DEVELOPMENT MYSTERY:
* The development plan shown on the official Clams website shows that the project is 90% complete - and NOT complete.
* Although their website has not been updated in a while. Another mystery remains in their development plan: Note below, the - (??% COMPLETE) Moon.
* Development Plan: CLAMmonetas. - (90% COMPLETE) Proof-Of-Working-Stake. - (70% COMPLETE) Update to Upstream Codebase. - (70% COMPLETE) CLAMshell. - (60% COMPLETE) CLAMchat. - (20% COMPLETE) CLAMtrader. - (10% COMPLETE) CLAMmarket. - (??% COMPLETE) Moon (source: clamclient.com)
WEB DEV
- The clamclient.com last header date:·Sat,·16·Dec·2017·15:46:01·GMT(CR)(LF) - Modified date is even earlier.
- Note: 4 months isn't too bad at the end of the day given the small team and the wild bear market.
MARKET DATA
Recent Data pulled from CoinMarketCap and shows increased activity across markets.
(coinmarketcap.com) as of 4/19/2018
1 Bittrex CLAM/BTC $163,573 $4.27 59.37%
2 Poloniex CLAM/BTC $108,510 $4.24 39.38%
3 Cryptopia CLAM/BTC $1,766 $4.79 0.64%
4 YoBitYoBit CLAM/BTC $1,681 $4.20 0.61%
5 BleutradeBleutrade CLAM/BTC $7 $4.79 0.00%
6 BleutradeBleutrade CLAM/DOGE $0 $3.74 0.00%
www.coingecko.com

Clams VS Bitcoin Might Not Go Any LowerClams coin has found the support at 40k sathosis. That is not only a strong psychological support but a 327.2% Fibonacci retracement level (applied to the corrective wave after the 62k support breakout).
Clearly, 40k satoshis level has been rejected twice already, however CLAM/BTC is struggling to move above the 50k satoshis resitance, the 61.8% Fibs. At this point the consolidation between 40k and 50k satoshis is taking place and price has to break either for them to provide momentum for the next wave.
Break and close above the 50k satoshis should push price up, towards strong resistance at 62k satoshis area, or perhaps higher, towards 69k satoshis. Both of these levels correspond to the 38.2% and 50% Fibonacci retracement. On a downside, close below 40k satoshis, should push price down to 427.2% Fibs at 34k satoshis.

CLAM ANALYSIS MARCH 3 , 2018BYE NOW - 0.00055000 BTC
SELL
TARGET 1 : 0.00059600 BTC
TARGER 2 : 0.00065470 BTC
TARGET 3 : 0.00073000 BTC
TARGET 4 : 0.00084200 BTC

Clams VS Bitcoin - Uptrend - The BeginningFollowing the previous idea on Clams , it has broken above the resistance, signaling about the potential beginning of the uptrend. At the same time CLAM/BTC broke above the descending channel and the 200 Moving Average.
Clearly, ClamCoin showing strong sights of strength against the Bitcoin and should start moving higher. The very strong resistance is seen at 144k satoshi, where 50% Fibonacci retracement is. At this resistance area, there is also a 3/1 Gann Fan trendline and the upper trendline of the extended descending channel.
Overall, the bullish trend is likely to accelerate to target 144k satoshi resistance area and break above could establish a long-term trend upwards. Only break below the 38k satoshi support could invalidate bullish outlook.

CLAMS makin moves this weekThe downtrend of the past few weeks is closing in... Hard to say which way it will go but pay attention in the next week.
It looks like the 10th-13th will be critical to deciding the future of CLAMS

Clams [ CLAMBTC] | [+2000% potential Profit]
Idea
Token in active development with high potential, price at the bottom and a lot room to grow.
Indicators are hinting a bullish movement.
Technical
1d chart:
MACD, RSI and STOCH are confirming a bullish movement in the near future.
Fibonacci levels are very high.
weekly chart:
We see a falsified image by the lasted bitcoin "crash".
This coin will rise on a more stabilized market.
Buy-In
0.00065000 - 0.00080000
Targets via fibonacci
1 | 0.00352047
2 | 0.00561170
3 | 0.00899204
4 | 0.01139838
5 | 0.01446360 | old all time high
6 | 0.02331551 | new all time high <— Fib. 1.618 extension
Conclusion
Invest relax & earn.
We only trade for profit, never for loss.

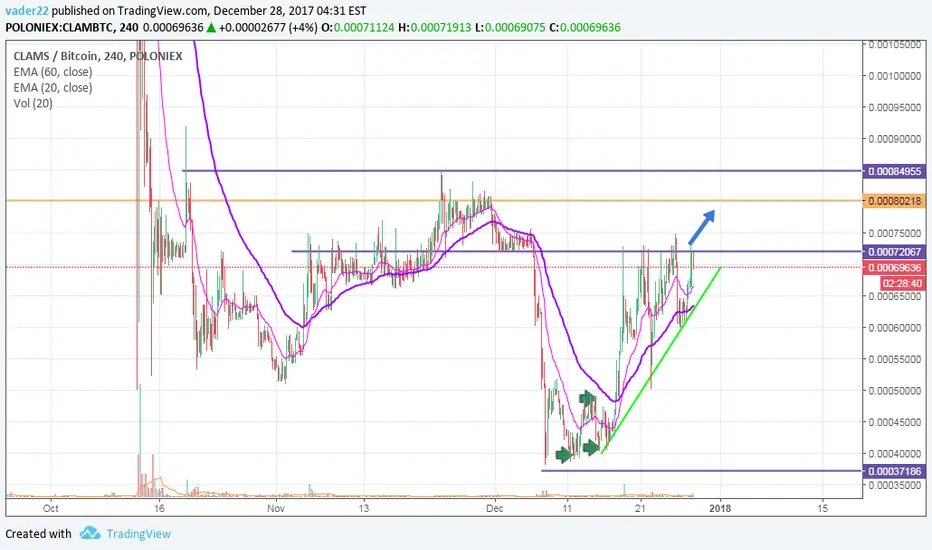
CLAMBTC LongCLAMSBTC Long
Entry:0.00070058
Tp: 0.0008
Stop Loss:0.00062382
Profit Percentage:12.4275

CLAM bottomed out, plenty of room for growthAs you can see in the weekly chart, CLAM is one of the few crypto's that are still bottomed out in this bull run. What makes CLAM special is the limited no# of coins it has According to coin market cap, I'll list the circulating and total supply of this gem:
16,519,682 CLAM : Total Supply
2,803,799 : Available Supply
Yea, you've read that right. It has just 2 million coins available. This can be huge.

Don't Forget About $Clams Clams is a coin that has had a long time to accumulate.
Confirmed double bottom is the breakout of the lower high at the bottom of the market cycle.
Smart to pick some up before the next run!

CLAM crushing into an ascending triangle - ready to jump 10-15%Good time to buy clams at <70k satoshis. Ascending triangle is crushing the price which could lead to a light pop up.
I've bought with sell orders layered at 80k & 84k sats.
Clams VS Bitcoin Waiting TimeClams have been in a heavy downtrend during past month, but it has finally found the lowest point. CLAM/BTC stopped at 38k satoshi support where it formed a double bottom. The following wave up resulted in a break above the 200 Moving Average, suggesting that Clams could continue going higher.
Nevertheless, it has rejected the 76.2% Fibonacci retracement level and a break above is required in order for Clams to start showing further strength against the Bitcoin. If/when it manages to break above the next upside resistance is seen at 141.4% Fibonacci retracement level, that is very close to 100k satoshi, a psychological round number. This resistance could play a key role in the further CLAM/BTC trend development, and the reaction of the market at that price is yet to be seen.
