$MGM 4 Month #CupandHandle #ChartPatternImpressive relative strength on a casino stock! Keep an eye out for breakout trade.
Classicalcharting

$ITT Forming 3+ Month #AscendingTriangle #ChartPatternStrong daily bar close above $65 will confirm the pattern breakout. Logical price target is around previous all time highs of $75.

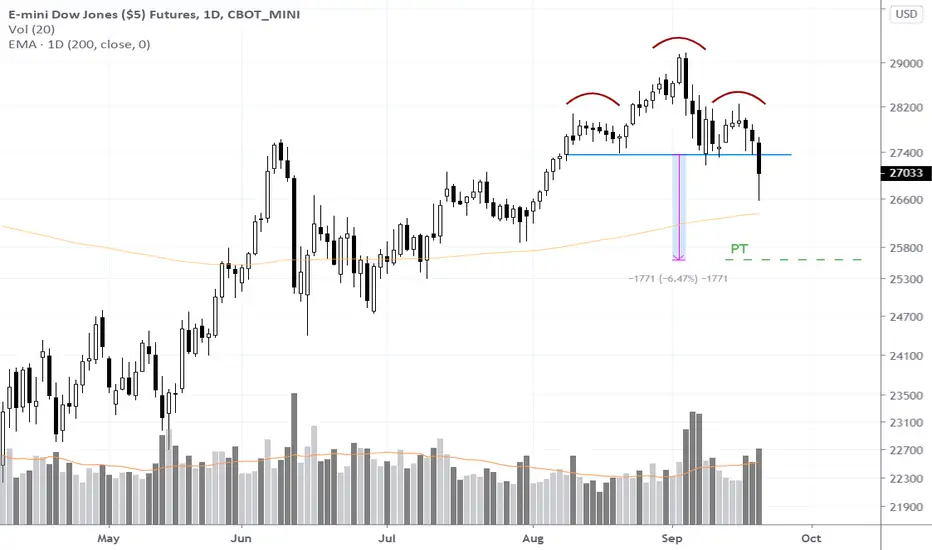
PERFECT #HeadandShoulders Neckline Kisson Dow Futures!Textbook bounce back to kiss the head and shoulders neckline. I alerted to this formation here

$GLD Entered Breakout Mode from its descending triangle$GLD $GC_F Entered Breakout Mode from its descending triangle chart pattern. I posted about this development back on september 9th here. Close below support yesterday and followed through in a big way today. Price Target added to chart.
post from 09/10 here.

$AMZN to form 4 Month #HeadandShoulders Pattern? (Prediction)Left shoulder and Head are in. Right shoulder in the making? Plausible and something to be on the lookout for.

$HLNE forming 5 month #Rectangle #ChartPatternThe stock attempted to close above $75 and head into ATH territories but failed to do so on multiple occasions. The stock has now formed a 5 month trading range with $61.50 acting as support that has been tested 5 times. Selling volume has been heavy in recent days and the stock has closed below 200 MA 8 out of the last 9 sessions. A clear daily close below $61.50 would confirm the 5 month reversal rectangle chart pattern with price target down to around $46.

KTOS Entering #Breakout #ModeBroke out from its 3 months cup and handle pattern on Monday and tested breakout zone early in the session today. I was able to grab some shares @$20.29. Pattern price target added to the chart. I will be taking profits around $24.50 though which is just below all time high (if the stock ending making a run to that level).
I posted about this consolidation pattern back on September 1st here

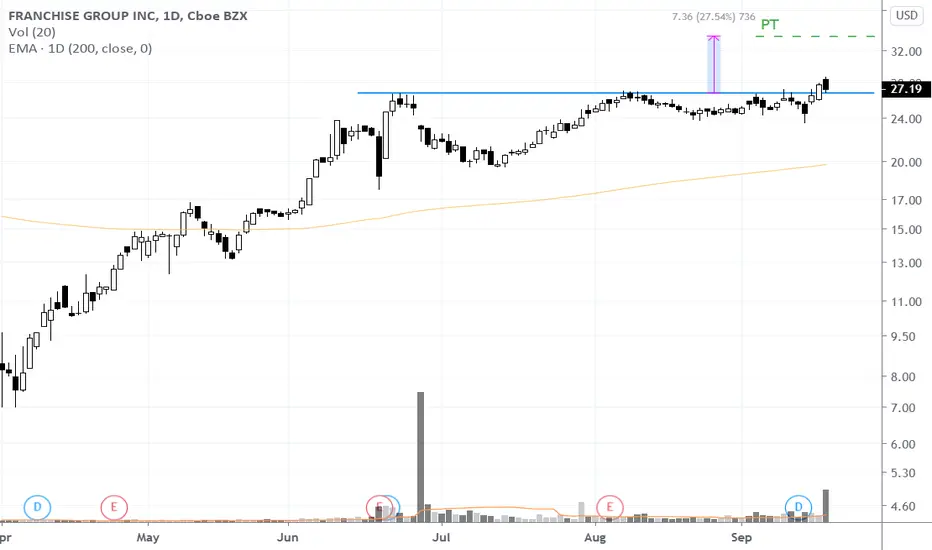
$FRG Entering #Breakout Mode on #CupandHandle #ChartPatternNASDAQ:FRG formed a 3 month cup and handle chart pattern testing pattern boundary @ $26.75 multiple times and broke out last Thursday. The stock pulled back on Friday with the market selloff and is now testing the breakout level. This is a breakout pullback entry setup. Chances are stock will head higher to profit target around $34 considering the market doesn't sell off hard next week.
GNTX 3 Month #CupandHandle #ChartPatternClear defined chart pattern resistance @28. A daily close above that will confirm the pattern and set the stage for the next leg up.

$ROKU 1 Year #Head&Shoulders Continuation #ChartPatternBig day for ROKU that sent the stock to ATH, breaking out of 1+ year continuation head and shoulders chart pattern. If the market stabilizes here, this stock's path of least resistance is much higher prices.

Daily Head&Shoulders Top Confirmed on DowLess than 2 months in length but a clear close below the neckline today. Price target listed on the chart. 200 MA is an obvious support level. A daily close back over the right shoulder will negate the pattern and possibly set the stage for rally back to chart pattern head high.
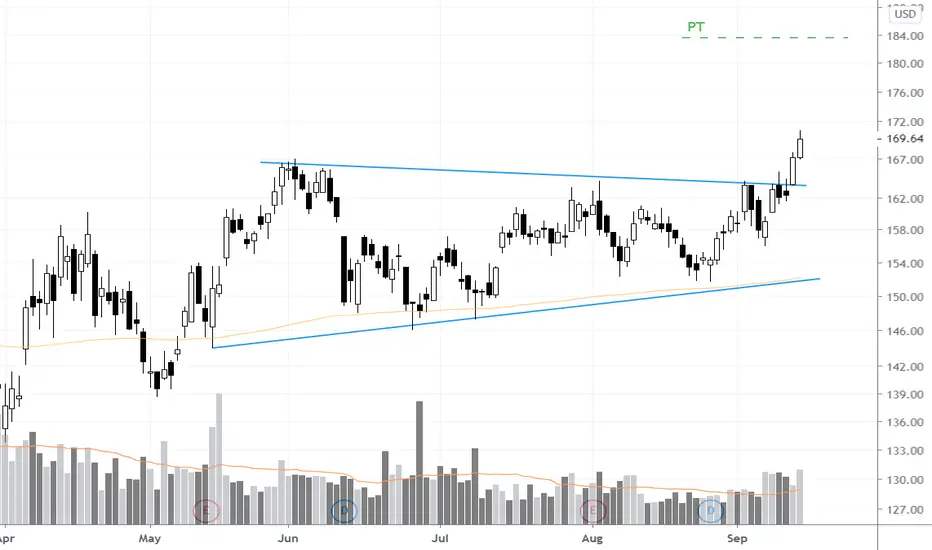
STE Entering #Breakout #ModeSTE broke out from its 3 month symmetrical triangle on Monday with a good follow through to trade at all time highs. I alerted to this consolidation breakout setup forming back on August 17th here
LIVN 1 Month #SymmetricalTriangle Inside 4 Month #RectanglePosted about this setup few days ago and now a symmetrical triangle is forming inside of the bigger 4 month rectangle chart pattern. A daily close below symmetrical chart pattern will set the stage for the next leg down in the stock.

WW finally Moving out of Consolidation PatternPosted about the setup taking place back in July and again in august. Stock closed below neckline Friday and lost over 8% today.

AX 3 Month #CupandHandle #ChartPatternVery appealing setup on this cup and handle 3 month chart pattern.
1. Handle taking the form of rectangle consolidation
2. Handle forming right above 200 MA (bullish)
3. The cup and handle pattern boundary resistance is conversion with a long term weekly down trend line (red line)
A decisive daily close above $26 will confirm the pattern and the breakout and set the stage for a rally up to $30s.

$AVNS forming 4+ Month #AscendingTriangle #ChartPatternNYSE:AVNS forming 4 month ascending triangle chart pattern with $34.50 testing multiple time and acting as resistance. Chart patterns that accomplishes 3 things when they breakout are ones that has the most chance succeeding. When the breakout takes place (daily close above $34.50), AVNS will:
1) Close above its Ascending Triangle chart pattern (blue line on chart - breakout)
2) Clear a multi month weekly downtrend (red trend line on chart)
3) Clear/Breakaway from the 200 MA (yellow line on the cart)

$SABC is forming 4 month #ascending #triangle #chartPatternNASDAQ:SBAC been trading sideways for 4 months forming a well defined ascending triangle chart pattern. The breakout will send the stock into ATH.

$RYAM #AscendingTriangle #PriceTarget ReachedTextbook ascending triangle chart pattern breakout. I posted about this breakout setup as it took place on September 10th here

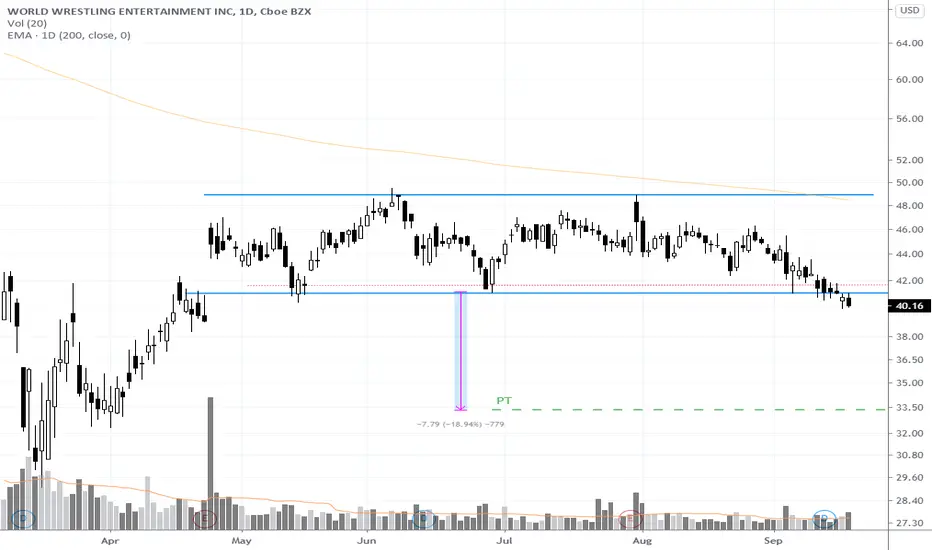
$WWE Entering #Breakout Mode from 4+ Month #RectangleNYSE:WWE formed a 4+ month rectangle chart pattern closing below support today and thursday. Took a shot at the short side with a stop on a daily close above the red dotted line. I posted about this rectangle pattern forming back on August 22nd here
$MGPI Forming 4+ Month #Rectangle #ChartpatternNice trade setup forming on NASDAQ:MGPI . A strong daily close above the 4+ months rectangle pattern will also clear the 200 MA. The stock has already cleared a weekly downtrend line indicating a possible shift in trend to the upside.

$SBNY #Rectangle #PriceTarget ReachedAnother breakout setup reaching its chart pattern price target. I posted about this trade setup here

ABNY #Rectangle #Breakout #PullbackBroke out of 3 months rectangle and pulling back/testing rectangle lower boundary.

GH Reached its #ChartPattern #PriceTarget #AscendingTriangle I posed about this trade forming on August 9th link below. GH reached its ascending triangle price target.
