Microsoft (MSFT)–Watching for Pullback Entry After $4T MilestoneMicrosoft Corp. NASDAQ:MSFT has become the second company after Nvidia to cross the $4 trillion market cap, powered by strong AI and cloud demand.
Azure revenue grew 34% to $75B in 2024, with a $30B AI infrastructure investment fueling future growth. Q4 EPS came in at $3.65 on $76.4B revenue, showing strong fundamentals.
We are looking for a pullback to key support for a long entry:
Trade Plan:
Entry Zone: $515 – $518
Take Profit: $536, $555
Stop Loss: $502
#Microsoft #MSFT #Stocks #Trading #StockMarket #TechnicalAnalysis #AI #Cloud #BigTech #NASDAQ
Cloud

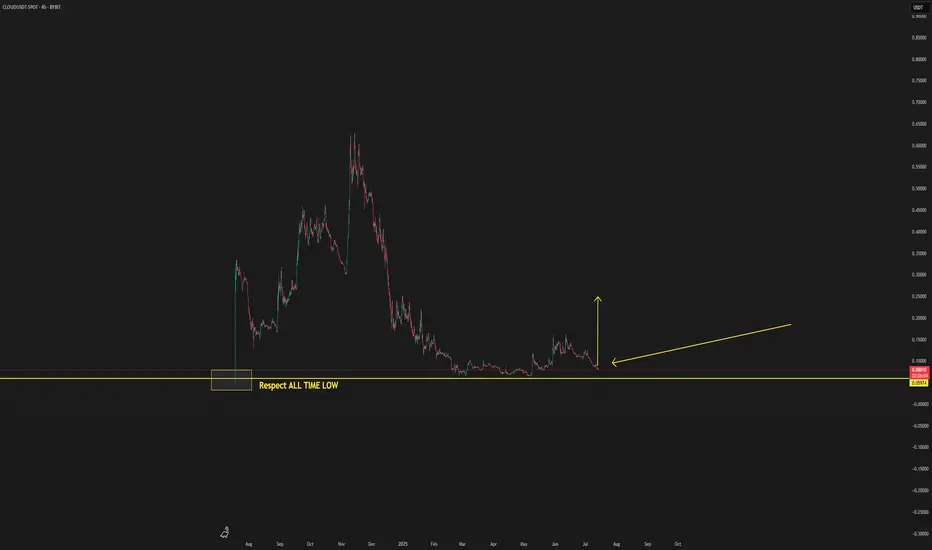
CLOUD THIS CAN BE THE BOTTOM STARTThis is a new coin to watch in the coming period, as it is showing signs of potentially forming a new bottom.
By respecting the previous all-time low, there’s a possibility that a new upward trend could begin from this level. Some indicators are also pointing toward this scenario.
If the coin provides further confirmations, updates will be shared below.
(jasmy) jasmy "array"I can't share my indicator ideas unless I publish them publicly. I don't feel like sharing my indicators with the public is necessary so I guess I will not be publishing many new ideas because the Trading View website is removing features where unpublished custom indicators are allowed to be included in sharing. Trading View is too strict and they keep choking the freedoms of watchlist, now indicators, what's next to be taken away from users of the website?


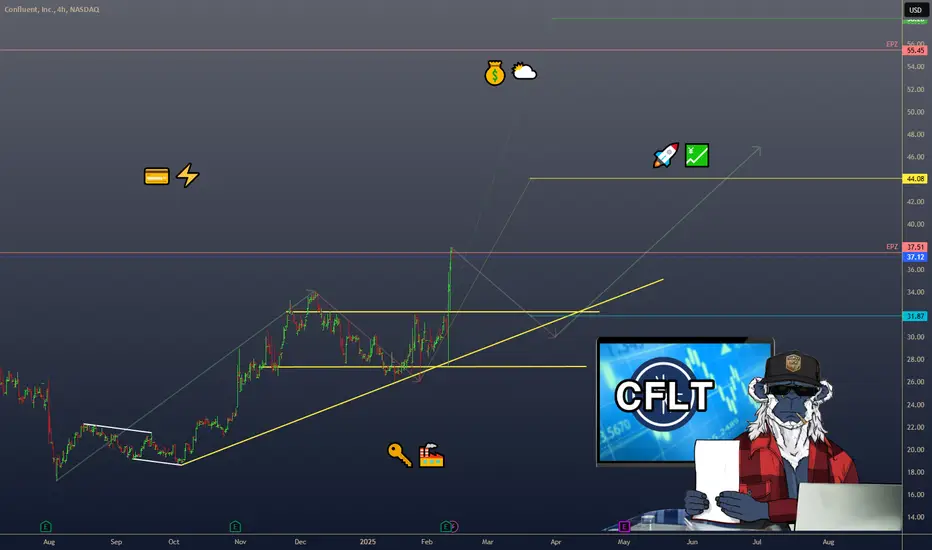
CONFLUENT ($CFLT) – DATA STREAMING’S RISING STARCONFLUENT ( NASDAQ:CFLT ) – DATA STREAMING’S RISING STAR
1/7
Ready for a snapshot of Confluent? Here’s what’s sparking chatter on X: 23% YoY revenue growth, $0.09 EPS (beats by $0.03), and free cash flow at $ 29M—above estimates! Let’s dive in. 🚀💹
2/7 – REVENUE & EARNINGS BLAST
• Overall revenue: +23% YoY
• Subscription revenue: +24% YoY 💳
• Q4 EPS: $0.09 (est. $0.06) ⚡️
• FCF: $ 29M vs. est. GETTEX:27M 💰
3/7 – CONFLUENT CLOUD SHINES
• Cloud revenue: +38% YoY 🌥️
• Big piece of their puzzle—shows they’re nailing the cloud-based approach
• Key to future scaling & recurring income streams 🔑
4/7 – SECTOR SNAPSHOT
• Confluent competes in data streaming & management
• Growth suggests they’re keeping pace—maybe even undervalued if adoption keeps climbing 🤔
• Keep an eye on how they stack up vs. other cloud/data players like Snowflake or Datadog 🏭
5/7 – RISK ASSESSMENT
• Market Saturation: More competitors in cloud/data → potential pricing pressure 💼
• Tech Shifts: Rapid changes could leave older solutions behind 🔄
• Economic Downturn: Slowed IT budgets might delay or shrink deals 🌐
• Customer Concentration: If a few big clients leave, it stings big time 🏹
6/7 – SWOT HIGHLIGHTS
Strengths:
Strong Confluent Cloud growth (+38% YoY!)
Broader customer base (+17%) 🙌
Weaknesses:
Heavily niche in ‘data in motion’ 🤏
High acquisition costs in a crowded market 🏷️
Opportunities:
Expand into new verticals & geographies
AI/ML integration for next-level analytics 🤖
Threats:
Fierce giants with deep pockets 🦖
Regulatory changes in data privacy ⚖️
7/7 – Where do you see Confluent heading next?
1️⃣ Bullish—Cloud growth = unstoppable! 🌟
2️⃣ Neutral—Need more consistent profitability 🤔
3️⃣ Bearish—Competition is too intense 🐻
Vote below! 🗳️👇
Snowflake ($SNOW) | Rerating Incoming with 2-3x PotentialOur top analyst Shay Boloor (@StockSavvyShay) is adamant that Snowflake will be rerated in 2025 with a price target of $300 (called out live on Fox Business). Their NRR is at 127%, meaning existing customers will spend 27% more YoY. For Snowflake to grow 27% within the next year, all they need to do is nothing. They can afford to sit.
Data consumption models make money out of thin air. 40% of the Fortune 2000 data is stored in Snowflake’s ecosystem ALREADY. They are trading at 25% of Palantir’s valuation and 20% of Cloudflare’s. This could be a 3-4x trade. There is still no floor on AI and its applications.
On the technical side, over $205 and we have a liquidity zone up to $300. Our entries are at $109 and $125, but this would be a secondary entry for a position trade to capitalize on one of the top names in stage two AI (software/applications).
Entry: Over $205
Targets: $230, $300, $400
NYSE:SNOW

Ichimoku Theories - Complicated? Keep it SimpleNYMEX:CL1!
The Ichimoku Strategy is a technical analysis method using the Ichimoku Kinko Hyo indicator, which helps traders identify trends, support/resistance levels, and potential trade signals. It consists of five key components:
Ichimoku Indicator Components:
1. Tenkan-sen (Conversion Line): (9-period moving average)
• Short-term trend indicator.
• A sharp slope suggests strong momentum.
2. Kijun-sen (Base Line): (26-period moving average)
• Medium-term trend indicator.
• Acts as a support/resistance level.
3. Senkou Span A (Leading Span A): ((Tenkan-sen + Kijun-sen) / 2, plotted 26 periods ahead)
• Forms one edge of the Kumo (Cloud).
• A rising Span A suggests an uptrend.
4. Senkou Span B (Leading Span B): (52-period moving average, plotted 26 periods ahead)
• The second edge of the Kumo (Cloud).
• When Span A is above Span B, the cloud is bullish (green); when Span A is below Span B, it’s bearish (red).
5. Chikou Span (Lagging Span): (Closing price plotted 26 periods behind)
• Confirms trend direction.
• If Chikou Span is above past prices, it signals bullish momentum.
Trading Strategies Using Ichimoku
1. Kumo Breakout Strategy
• Buy when the price breaks above the Kumo (Cloud).
• Sell when the price breaks below the Kumo.
2. Tenkan-Kijun Cross Strategy
• Bullish signal: Tenkan-sen crosses above Kijun-sen.
• Bearish signal: Tenkan-sen crosses below Kijun-sen.
3. Chikou Span Confirmation
• Buy when Chikou Span is above past price action.
• Sell when Chikou Span is below past price action.
4. Kumo Twist
• When Senkou Span A crosses above Senkou Span B, it signals a potential bullish reversal.
• When Senkou Span A crosses below Senkou Span B, it suggests a bearish reversal.
5. Trend Confirmation
• Price above the cloud = bullish trend.
• Price inside the cloud = consolidation.
• Price below the cloud = bearish trend.
Advantages of Ichimoku Strategy
✅ Provides a comprehensive market view (trend, momentum, support/resistance).
✅ Works well in trending markets.
✅ Offers clear entry and exit signals.
Limitations
❌ Less effective in ranging or choppy markets.
❌ Can be complex for beginners.
❌ Requires confirmation with other indicators (e.g., RSI, MACD).
Trade Smart - Trade Safe 🚀

A lot of room to grow for $EDGE in DePINEDGE has been in a major uptrend since december fueled by new attention to its supercloud products that have been in development for over a decade and its recent partnership with Tinder, gaining them as a client to run the YearInSwipe competition on the edge network. This year there is a large number of releases to be expected, from its all new storage product, VPN, to AI Agents. Revenue has been on the rise to the tune of 1.3 million USD ARR from users of the supercloud, which is similar to some 10x valued project like Akash. Combined with the fact that it is not on any reputeable CEX yet, exchange listings can be seen as catalysts for further growth. In summary, a lot is aligning in the macro-picture for EDGE this year giving it the very good chance to catch up and overtake other DePIN projects price-wise. This is a project solving real-world issues with growing real-world revenue and deflationary tokenomics, making it an ideal long-term hold

CLOUD/USDT NEW INCREASECLOUD/USDT NEW INCREASE
There is a good chance that this coin can increase in the coming time frames with new volume.

First 2025 prediction Cloud/usdt $0.65prediction Cloud/usdt $0.65 with time
this coin has a good chance to gain $0,65, after studying the data of this coin.
The best way is to follow this coin's low day frame with the day trend.
This update is not a trading update, but a prediction update.
Know that there is no guarantee that this price will become a reality, our study is based on the data study which can be confirmed.
There is also a day trading follow updates by this update
Let the time show us if this coin is going to get the expected break.
Markets going on their way, and it can take time before this coin can show a result. also, this update depends not on the small time frame changes. it's a large picture for the coming times.

F5, Inc. (FFIV) AnalysisCompany Overview:
F5, Inc. NASDAQ:FFIV is a market leader in application delivery and cybersecurity, providing solutions that ensure seamless and secure digital experiences for enterprises globally. The company's evolution from a hardware-centric model to one focused on software and security solutions reflects its agility in adapting to market dynamics and customer needs.
Key Growth Drivers
AI Infrastructure Integration:
F5’s partnership with MinIO, a leading high-performance object storage platform, enhances its presence in the AI infrastructure space.
This collaboration integrates MinIO’s storage capabilities with F5’s advanced traffic management and security solutions, creating a compelling value proposition for enterprises embracing AI and data-intensive workloads.
Shift to Software and Security:
F5’s strategic pivot from hardware to software-driven and security-focused solutions broadens its market reach.
This shift positions F5 to capitalize on increasing enterprise demand for application security, cloud migration, and edge computing.
Strong Financial Foundation:
Recurring Revenue Dominance: 76% of total revenue ($2.1 billion) is now recurring, providing financial stability and predictable cash flows.
Stock Buyback Program: The $1 billion repurchase initiative demonstrates management’s confidence in the company’s growth trajectory and commitment to enhancing shareholder value.
Customer-Centric Innovation:
F5’s solutions are vital for enterprises navigating the complexities of modern multi-cloud environments and ensuring robust cybersecurity for applications.
Investment Outlook
Bullish Case:
We are bullish on F5, Inc. (FFIV) above the $220.00-$222.00 range, given its robust recurring revenue base, strategic partnerships, and expanding market opportunities in cybersecurity and AI infrastructure.
Upside Potential:
Our upside target is $360.00-$365.00, reflecting the company’s ability to sustain long-term growth through innovation, market leadership, and strong financial management.
🚀 FFIV—Redefining Digital Security and Application Delivery in the Age of AI. #Cybersecurity #Cloud #AIInfrastructure

Cloudflare (NET) AnalysisCompany Overview:
Cloudflare NYSE:NET , a global leader in cybersecurity, content delivery networks (CDN), and edge computing, is well-positioned to capitalize on increasing digital transformation and growing demand for secure, efficient cloud infrastructure.
Key Growth Catalysts:
Strategic AI Partnerships 🤝
Cloudflare’s collaboration with Microsoft Azure enhances its AI infrastructure, fostering innovation and bolstering its competitive edge in enterprise cloud solutions.
Zero Trust Leadership in Cybersecurity 🔐
Cloudflare’s Zero Trust platform addresses growing enterprise needs amid rising cyber threats and increased remote work adoption.
Advanced threat intelligence and access controls make it a leader in next-gen cybersecurity solutions.
Edge Computing & IoT Opportunities 🌐
Edge computing solutions are experiencing strong adoption, fueled by:
Growing demand for 5G networks and the IoT revolution.
The edge computing market is projected to reach $87.3 billion by 2026.
Cloudflare’s focus on reducing latency and enhancing network efficiency positions it to capture market share.
Global Expansion & Untapped Markets 🌍
New data centers in underserved regions expand Cloudflare’s global reach, improving service delivery and unlocking revenue opportunities in untapped markets.
Investment Outlook:
Bullish Stance: We are bullish on NET above $90.00-$91.00, supported by strong positioning in AI, cybersecurity, and edge computing, coupled with robust global expansion strategies.
Upside Target: Our price target is **$145.00-$150.00

Aethir Project Overview: $ATH going All time high?Project description:
Aethir ( TSX:ATH ) is a decentralized infrastructure protocol that focuses on providing real-time data and computational resources for gaming and metaverse applications, aiming to create scalable, low-latency solutions using blockchain technology.
Type of project:
Decentralized infrastructure for gaming and metaverse applications.
Is it under a block?:
Yes, Aethir operates on the Ethereum blockchain and plans to expand to other compatible blockchains, providing its services through a decentralized network powered by TSX:ATH tokens.
Latest update or news:
As of November 7, 2024, Aethir announced its Compute Node Partnership Program, which incentivizes participants to contribute computing resources to support gaming and metaverse applications on the Aethir network.
Narrative:
Gaming infrastructure, metaverse, decentralized computational resources, and blockchain-based real-time data solutions.
Unlocks Data for Aethir ( TSX:ATH ):
1. Upcoming Unlock:
Next Unlock Event: Scheduled for November 10, 2024, with an unlock of 4 million ATH tokens.
Percentage of Circulating Supply: This release constitutes approximately 0.02% of the current circulating supply.
2. Rate of Token Released to Circulation:
Next 7 Days (November 7 – November 14): 4 million ATH tokens, or approximately 0.02% of the circulating supply.
Next 30 Days (November 7 – December 7): Cumulative unlocks totaling 12 million ATH, approximately 0.06% of the circulating supply.
3. Total Unlocked:
Total Unlocked Tokens: 3 billion ATH, which represents approximately 7.14% of the maximum supply of 42 billion ATH tokens.
4. All Upcoming Unlocks in the Future:
November 10, 2024: 4 million ATH
December 10, 2024: 4 million ATH
January 10, 2025: 5 million ATH
5. Vesting Analysis for Aethir ( TSX:ATH ):
Aethir’s token vesting is structured to ensure gradual and stable distribution:
Compute Node Incentives: 50% allocation, distributed over 5 years to support long-term infrastructure growth. Team and Advisors: 15% allocation, vested over 3 years to align with project milestones. Ecosystem Development: 15% allocation, released based on project expansion and strategic partnerships. Investors: 10% allocation, unlocked gradually to mitigate sell pressure. Community and Airdrops: 10% allocation, provided to early adopters and supporters to encourage platform adoption.

(MOG) mog coinmog coin listed to kraken but now does not appear on their website as newly listed. Not sure if there is a bug or glitch or if they decided to not list mog coin. As I can see on trading view the kraken USD mog coin pair does exist despite the listing on their website going blank. Kraken also listed memecoin. In the last few months Kraken has listed some ~50 cryptocurrency to their trading exchange.
notable add-ons include;
TURBO, ECHELON PRIME, PARCL, RENDER, FLOKI, MANTLE, KUJIRA, BITTENSOR, LAYERZERO, BIG TIME, PENDLE, SAFE, MAPLE, HELIUM, BONK, OPTIMISM,.
people in the USA cannot trade :
ACA, AGLD, ALICE, ASTR, ATLAS, AUDIO, AVT, BONK, C98, CFG, CLOUD, CSM, FLOKI, GENS, GLMR, HDX, INTR, JASMY, KIN, KMNO, KUJI, L3, LMWR, MC, MV, NMR, NODL, NYM, ORCA, OTP, OXY, PARA, PEPE, PERP, PICA, PORTAL, PRCL, PSTAKE, PYTH, RAY, REQ, REZ, ROOK, SAMO, SDN, STEP, SUI, TEER, WEN, WIF, WOO, XRT, YGG, ZEX.
I notice quite often the best performing cryptocurrency "on the day," is one that is not tradable in USA. For instance, this week Sanctum (CLOUD) performed the best while most cryptocurrency was losing yet there is no way to gain from this instance because as seen from above CLOUD is not tradable in USA. Neither Bonk nor Dogwifhat are tradable in America on Kraken.com.
to check your location here is the link:
support.kraken.com

CRWD - Crowdstrike, this looks similar. Crowdstrike has been demolished in recent session on the back of poor Cybersecurity news / IT OUTAGES.
This type of sell usually gets a dead cat bounce like we saw in December of 2021.
However this decline usually proceeds more selling.
Notice how price respected each Fib level, but it did challenge and pierce each Fib level, shaking out buyers and sellers.
Im eyeing a quick bounce soon but a move lower move we complete that bounce.

Members Daily Analysis July 22 2024Markets surge off rate cut comments before CPI hits 2%
Nat Gass bouncing hard.
Yields quietly moving higher.
Bitcoin not participating with risk assets today.
Google earnings on watch / Cloud stocks

NVIDIA 850 ABOVE 815 SL 805 Reason Why Nvidia Will Still Growing
Diverse Market Presence: NVIDIA is not just a semiconductor manufacturer; it’s a tech powerhouse. Beyond GPUs for gaming and professional markets, they also create system-on-a-chip (SoC) units for mobile computing and automotive applications. Their expansion into cloud software and services positions them well for growth1.
Cloud-Based Software Dominance: The pandemic accelerated the adoption of cloud-based software and computing. NVIDIA’s GPUs play a crucial role in data centers—the brains behind cloud services. In Q1 2021, NVIDIA’s data center revenue hit a record high of $2.05 billion, accounting for 36% of total sales. Major players like Microsoft’s Azure Cloud, Google Cloud, and Amazon’s AWS rely on NVIDIA’s GPUs for data operations1.
AI and Deep Learning: Artificial intelligence (AI) systems demand fast and reliable processors. NVIDIA’s GPUs are unmatched for training and running AI systems. Their focus on research and development ensures they stay at the forefront of AI technology1.
Competing with Giants: NVIDIA is developing its own cloud services, including AI Enterprise and the Base Command Platform. They’re also venturing into creative collaboration tools with Omniverse. These initiatives put them in direct competition with tech giants like Amazon, Apple, Alphabet, and Microsoft1.
Analyst Estimates: While NVIDIA’s stock has rallied significantly, its price-to-earnings (P/E) ratio remains high. However, analysts estimate that by fiscal 2025, their earnings per share could double, making the stock more attractive2.

SNOWFLAKE breaking long time resistanceThere is a multi year resistance around $205 for NYSE:SNOW
Signs I'm looking for:
Top of channel to become support, a bounce off there and a move into $220 should confirm that.
I want to see the SuperTrend indicator stay green, upwards of the level of where the red downtrend line exists.
SuperTrends on higher time frame charts work the best. It's often pretty solid when used on individual stocks rather than an index.
Take a look at the supertrend (strategy) and mess around with different time frames. You'll see the cumulative return is very high, often much higher than just buying and holding the equity.
Let me know what you think : )

StorjStorj, pronounced as “storage,” is an open-source cloud storage platform in which people with hard drive space and good internet connectivity can participate in the network to become a node in the network, and be rewarded by Storj tokens. Anyway, STORJ chart is a little stochastic and noisy, but there are clear upward and downward trends. After storj broke the major downtrend line, it started oscillating in an inverted wedge pattern. Now it seems storj has started an upward impulse wave and trying to break this inverted wedge. Let's see what happens.

Microsoft Breakout?Often MSFT can lead the market.
If this stock is breaking out of a daily range it will likely help propel the indices and cloud stocks higher.
With the second largest company in the world showing technical strength, one has to sway slightly more bullish.
if this breakout fails than one can lean more bearish. As of now this is a bullish move for MSFT

EQIX: A way to Short AI & Commercial Real Estate in One StockThis company deals with renting out Commercial Real Estate, mostly to do with Datacenters and other Internet Connected Operations, and due to that, this makes it a perfect stock to get Bearish Exposure to if you are both Bearish on the AI Big Tech Mania and Bearish on Commercial REITs
One of the main risks for this stock is if their biggest clients, like MSFT and AMZN begin to shift away from using Equinix datacenters in favor of creating and using their own in order to save on costs. If MSFT's recent earnings call is anything to go off of, they are currently desperate to increase profit margins and reduce the costs associated with their business operations especially the costs associated with working with third parties.
One area in which they could cut costs would be to reduce their reliance on Equinix datacenters, but in general as the AI Mania begins to wind down we could likely see the Equinix enterprise consumer base shrink even more, in which case we could see price begin to correct to reflect upon their lower cashflows as both the AI and Commercial REITs sectors continue to slow.
Beyond that: We have a Bearish Shark with MACD and PPO Bearish Divergence and PPO Arrow Confirmation; with hardly any support below us. If it plays out we could see a decline of about 50% from the current price level.

SNOW - Rising Trend Channel [MID -TERM]🔹180 supported indicates a potentially POSITIVE reaction; a downward breach indicates a NEGATIVE.
🔹Technically positive for the medium long term.
Chart Pattern:
🔹DT - Double Top | BEARISH | 🔴
🔹DB - Double Bottom | BULLISH | 🟢
🔹HNS - Head & Shoulder | BEARISH | 🔴
🔹REC - Rectangle | 🔵
🔹iHNS - inverse head & Shoulder | BULLISH | 🟢
Verify it first and believe later.
WavePoint ❤️

The end of the SaaSacre and the rise of generative AIWe recently had the pleasure of speaking with Janelle Teng of Bessemer Venture Partners (BVP). Janelle is a vice president at BVP, focused primarily on cloud software, infrastructure and developer platforms. WisdomTree began working with BVP in 2020 to launch WisdomTree’s Cloud Computing Strategy which tracks the BVP Nasdaq Emerging Cloud Index. This blog is a summary of the key takeaways from the discussion.
The SaaSacre1 of 2022
We had to start by recognising the feeling of our current environment, which comes largely from what BVP has termed the ‘SaaSacre’ of 2022. What is a SaaSacre? If one pulls up the return of the BVP Nasdaq Emerging Cloud Index during 2022 and sees a figure worse than -40%, then they will see it – that drop is the SaaSacre. The market underwent a complete adjustment to valuations across the board, going from peak levels observed in late 2022 to levels much lower reflecting, among other things, a higher general interest rate environment brought on by the US Federal Reserve (Fed). Investors in software-as-a-service (SaaS) companies tended to see an opposite relationship during 2022, where, as interest rates rose, SaaS valuations fell and vice versa2. While it is logical that companies that expect to deliver cash flows far into the future would see their valuations impacted by interest rates, the relationship is not always so stark.
The 3 archetypes of COVID-19 shocks on growth S-curves
The S-curve is a commonly used heuristic to help investors relate time, plotted on the horizontal axis, to adoption, plotted on the vertical axis. A steeper S-curve = faster adoption. An S-curve moved vertically upwards = a larger adoption. The COVID-19 pandemic was a shock that changed the position of the S-curves of various SaaS companies. If we can understand at least a few archetypes of how this occurred, it can help us to better evaluate how companies are doing now, largely on the other side of the shock. We show these examples in Figure 13:
Temporary exponential growth from illusion of market opportunity: this shock would appear as a bulge upwards in the upper portion of the S-curve—telling us that adoption picked up rapidly for a period of time—before dropping back to the original trend.
Unsustainable exponential growth due to acceleration within original market opportunity: this shock would appear as a steeper S-curve, with the rising slope pulled further to the left telling us that adoption was occurring suddenly, faster—with the top level peaking at the same place as originally intended, but just arriving there sooner. Many people are familiar with Zoom Video Communications, and this company’s pandemic experience seems to largely be consistent with this archetype.
New growth baseline from expanded market opportunity: while it may be easy for CEOs to tell us all a story about how they now have a ‘new growth baseline’, it is far more difficult to actually deliver and execute on than it is to say. If there is one area where this happened, it was in food delivery, in that after the pandemic the general person thinks differently about using certain services, be it Uber Eats or DoorDash.
The difficulty of making predictions
In thematic topics, it is frequently difficult to make predictions about growth rates and the ultimate sizes of given markets. In the conversation with Janelle, we talked about an example of some forecasts that Gartner had made regarding Worldwide Public Cloud Service Revenues4.
In April of 2019, the prediction for 2022 was $331 billion.
In April of 2022, the prediction for 2022 was $495 billion, significantly higher.
Initial public offerings (IPO’s) and mergers and acquisitions (M&A)
We spent time talking about what we were seeing, or put more accurately weren’t seeing, in 2022, and that was IPOs. A significant benefit of speaking with Janelle and BVP is that there is a sense of history. We can recognise that 2021 was an outlier year, in that the aggregate value of software IPOs priced was in the vicinity of $28 billion. Even without the historic shift in policy at the Fed, Figure 2 shows that matching anything close to 2021’s result was going to be difficult.
Within the category of corporate actions, sometimes you see M&As (Adobe’s intended purchase of Figma was a big example) and sometimes you see private equity players making investments. So-called ‘take-privates’ in 2022 were extremely active, and we saw many such examples through the year.
Growth vs profitability
One of the questions that we hear often regards what is more important, growth or profitability? In recent years, maybe the real answer is, ‘it depends when you ask.’ It’s very clear that those of us following the software space in 2018 and 2019 saw that growth was of the utmost importance. In 2022, on the other hand, we were hearing a lot more about profitability.
Janelle was able to walk through some work done by BVP within the 2023 State of the Cloud report, the gist of which was, when considering the impact on valuations5:
November 2021: revenue growth was about six times as impactful on valuations as profitability.
October 2022: the importance of revenue growth and profitability were roughly equal in their impact on valuations.
April 2023: revenue growth was about two times as impactful on valuations as profitability.
The true conclusion: It is never all growth and it is never all profitability, but it is important to be aware of how the focus on these measures can ebb and flow across time.
Generative AI is going to be everywhere
Janelle and I spoke the day after Microsoft reported its quarterly earnings for the period ended March 31, 2023. We briefly touched on this quote from Amy Hood, Executive Vice President and Chief Financial Officer6:
“In Azure, we expect revenue growth to be 26% to 27% in constant currency, including roughly 1 point from AI services."
We can also note this statement from Satya Nadella, CEO7:
“Our Azure OpenAI Service brings together advanced models, including ChatGPT and GPT-4, with the enterprise capabilities of Azure. From Coursera and Grammarly, to Mercedes-Benz and Shell, we now have more than 2,500 Azure OpenAI Service customers, up 10X quarter-over-quarter.”
Janelle and I discussed how the big companies, in this case represented by Microsoft, are important, in that they tell us something about broader enterprise consumption and spending, leading to better clarity on the environment that the more ‘emerging’ cloud companies have to operate within. Microsoft is sending a big signal on generative artificial intelligence (AI), and we believe we will continue to see it spreading across many different companies.
Bottom line: lots of growth catalysts for those with more time
Even if we recognise the uncertainty in the current 2023 economic environment, those investors with a longer time horizon can take advantage, positioning for important growth drivers looking forward. It is rare that companies with the largest market capitalisations in the world are able to announce something that could have a material impact on revenue growth, but that is just what generative AI seems to be as we write these words.
Sources
1 SaaSacre is a term from BVP, combining ‘SaaS’ and massacre, to help illustrate in words the tough performance environment observed in 2022.
2 Source: bvp-atlas/state-of-the-cloud-2023
3 Source: nextbigteng.substack the-reckoning-of-pandemic-tech-darlings
4 Source: nextbigteng.substack.com the-reckoning-of-pandemic-tech-darlings
5 Source: bvp atlas/state-of-the-cloud-2023?from=feature
6 Source: Microsoft earnings FY23Q3
7 Source: Microsoft earnings FY23Q3
