SP500 - Cycle Analysis; New V-Bottom24 Dec 2018 - V-Bottom Trough:
This marks a clean V-bottom. Both the 227-ROC and 114-ROC showed simultaneous positive acceleration after price reacing its low. Shortly after, both crossed their 57-SMA almost in sync — increasing the probability of a sustained bullish move. Price confirmed this by breaking resistance and forming a V pattern. This was further validated by the centered moving average crossover (114-CMA crossing above 227-CMA).
25 Mar 2020 - Deep COVID Crash Trough:
During this phase the priced broke below the support, creating a deep trough. Altough both ROC lines initially showed strong negative acceleration due to the COVID-19 crash, they soon reversed above their 57-SMAs, signaling a major shift in momentum. This coincided with the price breaking above the key resistance which was also crossed in 2019 when confirming the old V-pattern. After this breakout, a brief pullback followed before the uptrend resumed with increasing strength.
22 Jun 2021 to 19 Dec 2023 - Pattern
During the initial period a bearish divergence was visible in the ROC, nevertheless price and rate of change both declined making a low in early October 2022. A technical pattern began to form, which appears to align more closely with a symmetrical triangle; So when measuring its height and projecting it from the breakout point aligns with the new all-time highs that were reached on 27 June 2025.
21 Mar 2025 - New Cycle Trough
A new V-bottom formed shortly after the current cycle began. Both ROC indicators had already crossed their SMAs to the upside, showing early signs of positive acceleration, days before of price broke through the resistance and reached the new record high.
The 227-SMA is likely to cross from below the fast SMA while a possibility of a pullback increase.
Following that, the 114-CMA will probably has the chance to cross back the 227-CMA, with the price potentially confirming a new support level and resuming its uptrend - in line with the broader cycle timeline.
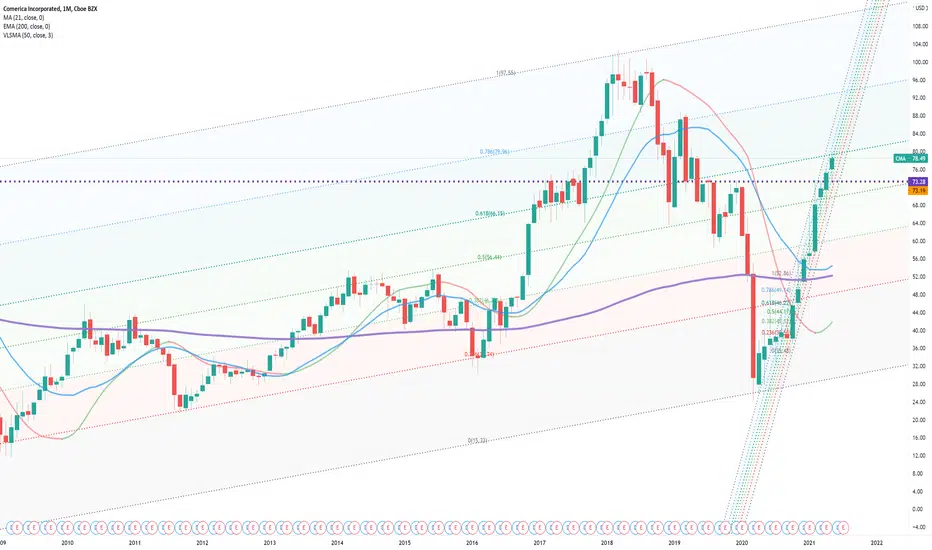
CMA

Comerica (NYSE: CMA) Reports First Quarter 2025 Earnings ResultsComerica Incorporated (NYSE: NYSE:CMA ), together with its subsidiaries, a company that provides financial services in the United States, Canada, and Mexico reported her first quarter 2025 earnings results today before the bell.
The results are available on the Investor Relations section of Comerica's website: c212.net
Technical Outlook
Prior the earnings, shares of Comerica Incorporated (NYSE: NYSE:CMA ) are up 1.28% in Monday's premarket session. The asset is trading in tandem with the support point of $52, a break above the 38.2% Fib level could set the pace for a bullish reversal albeit the stock was already consolidating as hinted by the RSI at 46.
Financial Performance
In 2024, Comerica's revenue was $3.20 billion, a decrease of -8.79% compared to the previous year's $3.50 billion. Earnings were $671.00 million, a decrease of -21.43%.
Analyst Forecast
According to 21 analysts, the average rating for CMA stock is "Hold." The 12-month stock price forecast is $67.43, which is an increase of 27.35% from the latest price.

CMA - Bottom Within ChannelI have drawn a large channel in solid white
this is accompanied by a triangle structure but more importantly it as a double bottom for price
I have shown this double bottom with a bars pattern along the lower line of the triangle
This is where I think price will turn a recovery

Bearish divergence on CMA Daily and 4HWeekly (not shown):
Possible bearish divergence coming up. Impulse still green, but is shows prices around 101 were rejected and price closed much lower.
MACD-Histogram still rising, as well as EFI. sRSI declining, although it could cross.
Daily
Bearish divergence on MACD-H, MACD lines, EFI and even Stochastic RSI. Stoch RSI crossed bearish and comes from an overbough condition. Even an ATR channel divergence. Current bar shows an upwick and rejected the to close around the 101$ resistance
4H
Bearish divergence again on ATR lines, MACD-H and MACD lines, and EFI. sRSI is bearish and is declining.
Entry:
At this level, but first we need to see how the weekly opens.
98-99,5
Stop:
102
Target 1: 94,46
Target 2: 92,88

CMA - LONG - ZOOM-OUTOh, it's a long way home
It's a long way home
In the night alone
(Johnny Hallyday)
CMA is approaching resistnace, potential drop! CMA is approaching our first resistance at 88.30 (Horizontal pullback resistance, 61.8% Fiboancci extension, 61.8% Fibonacci retracement) where a strong drop might occur below this level pushing price down to our major support at 76.33 (50% fibonacci retracement, 61.8 %Fibonacci extension).
Stochastic (89,5,3) is also approaching resistance where we might see a corresponding drop in price.

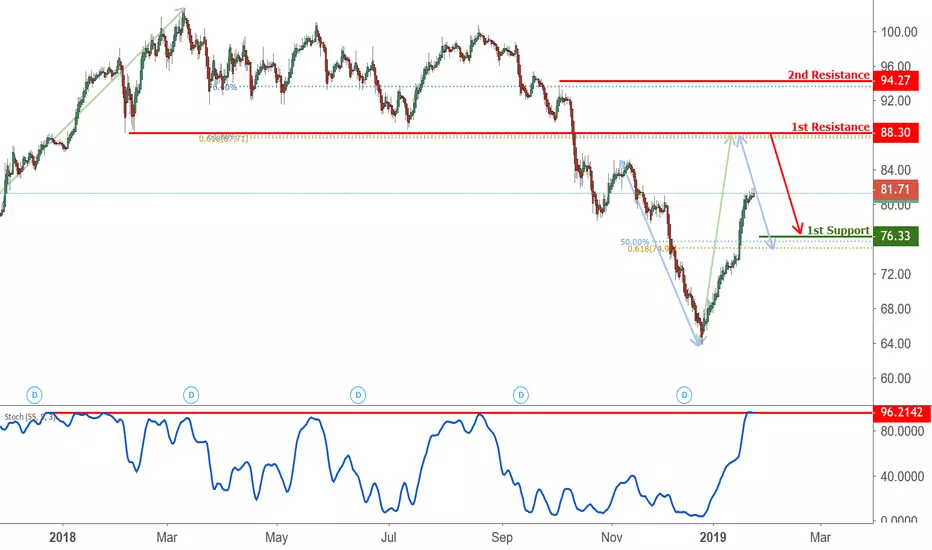
CMA Approaching resistance, potential drop! CMA is approaching our first resistance at 88.30 (horizontal pullback resistance, 50% Fibonacci retracement, 61.8% Fibonacci extension) where a strong drop might occur below this level pushing price down to our major support at 76.33 (50% Fibonacci retracement, 61.8% Fibonacci extension).
Stochastic (55,5,3) is also approaching resistance where we might see a corresponding drop in price.
CMA approaching resistance, potential drop! CMA is approaching our first resistance at 88.25 (horizontal pullback resistance, 61.8% Fibonacci extension, 61.8% Fibonacci retracement) where a strong drop might occur below this level pushing price down to our major support at 76.02 (horizontal swing low support 50% Fibonacci retracement).
RSI (55) is also approaching resistance where we might be seeing a drop below this level.

Possibility of Zigzag correction (USDCHF)Hi, Traders
Looking for zigzag correction because first A" has clear 5 waves. it may also be complex pattern.
But overall usdchf is bullish so we have to wait for proper pullback.
Note: This is mere a idea not a trading signal to trade. Trade carefully !
Thank you for your support !

Look for sell (GBPCAD)Hi, Traders
Currently market making a flag pattern it may be abc corrective structure but in any case it is sell with higher probability.
Note: This is mere a idea not a trading signal to trade. Trade carefully !
Thank you for your support !

Big move to the downside(If breakout happened) (GBPCHF)Hi, Traders
looking for a big move to the downside if breakout happened. this pair has both side opportunity buy and sell but most considerable trade is downside if anybody wants to take trade upside, take carefully.
If breakout does not happen and market moves to the upside then look for one more impulse(wait for small correction for taking long position) because of three wave corrective structure.
Take a short entry to the first pink level(Because of 3 wave formation) after breakout then go for last one.
Note: This is mere a idea not a trading signal to trade. Trade carefully !
Thank you for your support !

Strong Rally on the way (EURGBP)Hi, Traders
Market developed a corrective structure which almost completed. another possibilty is that it can go down for one more dip (But not necessary).
i will update the chart if any changes occure.
Note: This is mere a idea not a trading signal to trade. Trade carefully !
Thank you for your support !

Impulse about to come (CADCHF)Hi, Traders
As i am observing on the chart that first price may go upside to prescribed level then impulse will come into play.
lets see how it moves ,i will update chart if any changes occure.
Note: This is mere a idea not a trading signal to trade. Trade carefully !
Thank you for your support !

One more upside (BRENT CRUDE OIL)Hi, Traders
I am expecting one more upside because it is in a correction formation.
Note: This is mere a idea not a trading signal to trade. Trade carefully !
Thank you for your support

Market moving under a complex correction(NZDJPY)Hi, Traders
As i am observing that market under a complex corrective structure it may be abc correction or it will go all the way to upside.but there is a lot of possibility of selloff from c'' wave.
Note: This is mere a idea not a trading signal to trade. Trade carefully !
Thank you for your support

Market in alteration (DXY)Hi, Traders
looking for a correction in the form ABC. All majors pair will go accordingly.
Note: This is mere a idea not a trading signal to trade. Trade carefully !
Thank you for your support

Regular Flat pattern (GOLD)Hi, Traders
Now XAUUSD is showing a small flat pattern which gives us a chance to buy to the pink level.when trade comes in profit then move your s/l to the breakeven because breakout may be occure.
Note: This is mere a idea not a trading signal to trade. Trade carefully !
Thank you for your support !

Moving for 4th wave or Breakout??(EURJPY)Hi, Traders
Market moving for 4th wave if breakout happens then we have to wait for proper 3 wave correction and look for long position, if not happens then look for sell after a correction.
Note: This is mere a idea not a trading signal to trade. Trade carefully !
Thank you for your support !

Looking for impulse (BTCUSD)Hi, Traders
As I am considering corrective pattern looking for another impulse. lets see !
Note: This is mere a idea not a trading signal to trade. Trade carefully !
Thank you for your support !

Be Cautious while taking long position.(GBPUSD)Hi, Traders
Be cautious while taking any long position in this pair because it has overall sell any time it can go down.
Note: This is mere a idea not a trading signal to trade. Trade carefully !
Thank you for your support !

Wave ending with ending diagonal (EURUSD)Hi,Traders
This is the 3rd wave which almost ended and already made ending diagonal. this currency pair is going in correction to the prescribed level.
But in longer term it is still bearish.
Note: This is mere a idea not a trading signal to trade. Trade carefully !
Thank you for your support !
Wave ending with expanded diagonal (DXY)Hi, Traders
Dollar index is going in correction because this is end of 3rd wave. Possible correction will be between these ratio 21.40% t0 38.20%
lets see how it goes!
Note: This is mere a idea not a trading signal to trade. Trade carefully !
Thank you for your support !

Be Aware while Buying euro!!Hi, Traders
As we see the previous selloff considering that, this pullback is working as a corrective structure.
Potential side is downward but we can buy for some pips with good money managment or wait for correction end.
Note: This is mere a idea not a trading signal to trade. Trade carefully !
Thank you for your support !
