CAD Option Flow Positive Sentiment. It's worth taking a closer Based on the analysis of yesterday's trading on CME, we have captured an excellent portfolio in the lens.
The trader methodically formed this position in a 5-minute period of time, which is a good sign.
Сonfirmation - the market is already moving in his direction
But, reasonable entry level - above 0.7339.
Don't rush it. The risk/profit ratio is still at acceptable levels, but it's worth waiting for the resistance to be overcome.
Cme!


Bitcoin CME Gap June 21thBitcoin has a CME gap at $103.292 . Historically, these gaps tend to get filled and if it happens again, it could mean a short-term move before continuation.

E mini Nasdaq 100. 20.06.2025, Thursday [Day after FOMC]Clean delivery after FOMC. Massive meltdown on NQ.


Nikkei 225. Tokyo Open Delivery cause of Geopolitical DriversSharing my Tokyo Open model for the daily expansion on Nikkei. Along with Intraday market profiles. And Quarterly Theory

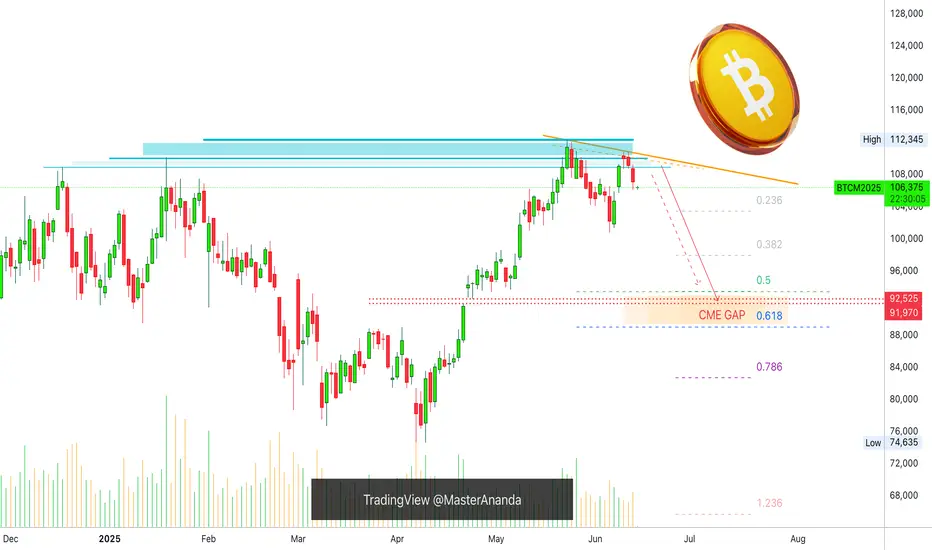
5 Bearish Signals —Bitcoin CME Gap (91,970 - 92,525)Bitcoin's bearish bias is confirmed clearly. Bearish signals are starting to pile up one on top of the other, let's recap those real quick:
1) Bitcoin is trading below its December 2024 high, it's January 2025 peak price and the recent 22-May all-time high. Trading below these levels open the doors for a move downward.
2) Recent lower high. 10-June closed lower compared to 22-May. This is a local lower high.
3) Overall low volume. Total volume decreasing since January 2025. No strong buying activity.
4) Sustained growth. Bitcoin grew straight up for 45 days. It is normal to see a retrace after sustained growth.
5) CME Gap. This is the latest signal that came to my attention and this gives further strength to the bearish case. The GAP sits between $91,970 and $92,525.
It is likely that Bitcoin will move lower before producing a new all-time high. Bitcoin is not likely to move below 80K. This is very unlikely.
Most likely Bitcoin will find support above 90K and if it moves below 90K this might be a brief occurrence lasting only a few hours or a few days at max. When all is set and done, we will continue to see long-term growth based on a bullish structure of higher highs and higher lows. The 7-April bottom will remain untouched.
Namaste.
Emini Nasdaq 100. CPI. 11.06.2025, WednesdayExpecting major meltdown on the daily. The triad should melt from here on

ES Futures-Weekly OutlookCME_MINI:ES1!
Fundamentals and Economic Calendar
Data Recap:
• Friday: 06/06/2025
o US Non-Farm Payrolls (May) 139k vs. Exp. 130k (Prev. 177k, Rev. 147k)
o US Unemployment Rate (May) 4.2% vs. Exp. 4.2% (Prev. 4.2%)
o US Average Earnings YY (May) 3.9% vs. Exp. 3.7% (Prev. 3.8%, Rev. 3.9%)
• Overnight Monday: 06/09/2025
o Chinese Trade Balance (USD)(May) 103.22B vs. Exp. 101.3B (Prev. 96.18B)
o Chinese Exports YY (USD)(May) 4.8% vs. Exp. 5.0% (Prev. 8.1%)
o Chinese Imports YY (USD)(May) -3.4% vs. Exp. -0.9% (Prev. -0.2%)
o Chinese CPI MM (May) -0.2% vs. Exp. -0.2% (Prev. 0.1%)
o Chinese PPI YY (May) -3.3% vs. Exp. -3.2% (Prev. -2.7%)
o Chinese CPI YY (May) -0.1% vs. Exp. -0.2% (Prev. -0.1%)
Looking ahead this week on the calendar, notable economic data releases are as follows:
• Wednesday: 06/11/2025
o US CPI YoY (May)
o US CPI MoM (May)
o US 10 year Note Auction
• Thursday: 06/12/2025
o US PPI MoM (May)
o US PPI YoY (May)
o US 30 year Bond Auction
• Friday: 06/13/2025
o Michigan Consumer Sentiment (Jun)P
o Michigan 1-year and 5-year Inflation Expectations (Jun)P
On the trade and tariff front, we have China-US trade talks continuing in the UK today. The Chinese Vice Premier is visiting the UK from June 8th-13th.
There has been progress made which is visible in terms of China relaxing export controls on rare earth minerals and President Trump stating that they are very far advanced on the China deal ahead of high level talks in London today.
The FED is in a blackout period until the FOMC meeting. Trade, tariffs, and geopolitical risks still need to be monitored.
Technical:
What has the market done?
With NQ leading, ES has also reclaimed yearly open. It held above yearly open in the overnight session.
What is it trying to do?
Climb higher, overlapping bars and yearly VPOC shifting higher denote acceptance at higher prices.
How good of a job is it doing?
Overlapping bars, headline risks and leveraged positions also point towards potential for prices moving lower before resuming higher or remaining range bound. TACO acronym traders may be in for max pain.
What is more likely to happen from here?
Given the data above, we would iterate given our previous explanation that recent data including CPI, PPI, Trade imports, exports is skewed due to trade tensions and this being reflected in business and consumer behavior. FED is likely to remain on hold while it waits and averages out the impact on growth, inflation and labor market.
Scenario 1: Push higher
Prices continue to push higher, if CPI comes in lower than expected, this may prompt a short-term continuation higher.
Scenario 2: Range bound
Markets remain in wait and see mode this week having climbed above yearly open. Markets build value higher and we expect VPOC to shift higher too.
Scenario 3: Sell-off
A mix of factors could e.g., trade talks stalling, weaker than expected US 10 year and 30 year auctions could foreshadow cracks appearing in the bonds market. This may fuel a wider sell-off if yields climb back higher.
Glossary:
ES - emini-S&P 500 Futures
NQ - emini-NASDAQ 100 Futures
VPOC - Volume Point of Control: The most traded price by volume in a given range. Represents acceptance or consensus

Emini Nasdaq 100 Weekly Outlook and Walkthrough. Outlined the orderflow and my thought process on Daily profiles and expansion days. Marked out my thought process. And how I would execute in that very specific moment. One of my best examples. Go ahead check it out.

Crude. Daily Internal to External Range Liquidity. 06.06.25Covering the crude expansion from daily internal towards the first external range liquidity

Gold NFP delivery. Thursday High Of The Week Market ProfileCovering Gold orderflow on thursday and NFP friday with proper reasoning.

GOLD 05.06,2025, Thursday. Day before NFPCovering my all star model. The criteria the setup the thought process and the narrative behind this model.

Gold 01.06.2025, SundayExpecting bullish price delivery on gold to make a All Time Highs. Before the meltdown on the quarterly Fair Value Gap

NQ Daily Orderflow, MMXM swing points Market Efficiency ParadigmDaily orderflow on NQ. How it formed why it formed. Using Internal Liquidity and sub Internal Liquidity

CME Futures PREMIUM —Bitcoin Will Continue To GrowThe PREMIUM between Bitcoin's CME Futures and spot price is still on. This means that Bitcoin continues bullish.
In a previous article, I used this signal to predict a bullish breakout and bullish continuation. When there is a bullish bias Bitcoin becomes more expensive on CME vs spot, it means buy demand is very strong. With a strong demand for Bitcoin from the public, prices continue to grow.
There is a huge difference between the double top in 2021 and the chart structure in 2025.
The double top in 2021 came out of a 5-up waves pattern. The current top comes out of a 7 months long consolidation phase. Based on Elliotts law of alternation, the bull market will end in a blow off top in 2025 rather than a double top. This means that we will see one final and very strong move up followed by a crash, and that's how the bull market will end. Think of 2017/2018 and you can get a perfect picture of how the bull market will end. The only question that remains is about how far up prices will go, will the bullish wave end at $157,425 or will it go to $211,855?
Six months is enough to reach the second target.
This is a friendly reminder.
Bitcoin will continue to grow.
Namaste.

Nasdaq 100. Mistakes and Daily Orderflow 27.05.25Covered the mistakes that I have made while reading the price. Wanted the shorts although the daily and the 4H suggested bullish price action. The good think was didn't forced. Just left the market after booking partials and breakeven
Post that took one long towards the Volume Imbalance

Weekly Outlook on Nasdaq 100, S&P 500, Dow Jones 30Expecting range bound consolidations on Index triad. High Resistance. Not expecting any further monthly highs. Want Internal Liquidity which means shorts. But the daily and the weekly are opposing each other.

Weekly Walkthrough on Currencies & CommoditiesCovering weekly price action on majors and other assets. Outlined the weekly displacements along with proper reasoning. Go ahead check it out

Yearly Open in Play — Is This the Real Bull or Just a Bounce?CME_MINI:ES1!
Macro Recap
Late Friday, Moody’s lowered the US’s sovereign rating from AAA to Aa1. This reflects a unanimous downgrade of the US, joining S&P and Fitch in stripping the US of its AAA status.
Would this result in a sell-off?
In our analysis, and consensus from the Street, is that it will be contained since the downgrade puts Moody’s in the same camp as S&P and Fitch.
There are talks of renegotiating UK–EU trade deals, which has boosted cable.
On the geopolitical side, not much has changed. Ceasefire talks are ongoing but stuck in neutral. No new catalysts—yet.
The spotlight, however, is firmly on the Fed. Over the weekend, President Trump called on Chair Powell to cut rates “before it’s too late,” echoing a post from April 17th where he labeled Powell’s speech “a complete mess” and added, “Powell’s termination cannot come fast enough.”
With a packed schedule of Fed speakers this week, the real question is whether they’ll double down on the Fed’s independence—or bend toward political gravity, especially with Trump reportedly eyeing the top job.
Economic data is light. That puts full attention on the Fed and headline risk. Traders should stay nimble and alert. Momentum could shift fast.
Markets are now pricing in two cuts of 25 bps each for September and December 2025.
This is very different from market pricing one month ago, when reciprocal tariffs were announced.
Monitoring rate cut expectations is another key theme this week, with multiple Fed speakers scheduled.
ES Futures
ES Futures have been one-time framing up — i.e., creating higher lows — on the weekly timeframe.
ES Futures have also created higher highs.
Key Levels:
• March 2025 High: 6052.50
• 2025 Yearly Open: 6001.25
• Previous Week High: 5977.50
• Previous Week Mid: 5856
Bull Market—or Just a Bear Bounce?
That’s the question traders are asking.
From our perspective, this looks like a recovery from a trade policy shock. The market took the hit, recalibrated, and bounced back.
But let’s not get ahead of ourselves. After a move this strong, some pause is natural. We’re watching for potential consolidation or profit-taking, especially with price action still holding below the yearly open.
Caution is warranted here—momentum’s in play, but the structure hasn’t fully confirmed the shift.
Scenario 1: Another Up Week, Capped by Yearly Open
In this scenario, the rally will be contained as the yearly open remains a strong pivot and resistance zone.
The LIS (Line in the Sand) for short trade opportunities is the yearly open pivot.
Scenario 2: Range-Bound Week
In this scenario, we expect markets to consolidate, remaining above last week’s low and finding support at the prior week’s mid-range.
We will look to initiate longs from the previous week’s mid-range, looking for level-to-level scalping opportunities in a range-bound market.

E mini Nasdaq 100. Weekly walkthroughWeekly walkthrough on NQ. Huge gap up and continuation weekly profile towards the Major Buyside Internal Liquidity

Gold weekly overview and Outlook for next week
Expecting a push up on gold based on 4H fractals. Internal Ranges suggest bullish price action. Need to see where we are going to open.

Liberation, Altercation & Boom: US China Trade talks CME_MINI:ES1!
Pointing to our previously written blog post (Liberation, Altercation or Doom) on March 31st. A mix of all scenarios played out.
Global universal tariffs with reciprocal tariffs layered on top. It resulted in a huge sell-off on April 2nd.
After months of tit-for-tat tariffs and growing economic friction, the US and China have agreed to hit pause. In a joint statement that’s given markets some breathing room, both countries announced a 90-day suspension on a large portion of their punitive tariffs—an initial step toward dialing back tensions and restarting dialogue.
Key Tariff Measures from US-China Joint Statement (90-Day Pause)
US Tariff Reductions:
Tariffs on Chinese goods were reduced from 145% to 30% for a 90-day period.
24 percentage points suspended, leaving a 10% base tariff in place.
China Tariff Reductions:
Tariffs on US goods reduced from 125% to 10% for the same 90-day period.
China also suspends 24 percentage points of additional ad valorem duties.
Retains a 10% baseline tariff on US imports.
Non-Tariff Measures: China to suspend or remove all non-tariff countermeasures imposed since April 2.
Includes sanctions on certain US companies.
Lifts export controls on some critical minerals.
Timeline & Commitment:
Both parties agree to implement these actions by May 14.
Commitment to continue trade and economic talks through a new bilateral mechanism.
Talks may be held in alternating locations (US/China) or via third-party venues.
No Agreement On:
Currency policy.
E-commerce “de minimis” exemptions.
Sector-specific tariff frameworks.
Future Key Dates and Timeline:
May - Potential US semiconductor tariffs.
May/June - Potential US pharmaceutical tariffs.
July 8th - 90-day tariff lowering for "worst offenders" expires.
July 14th - US tariffs on Mexican agriculture goes into effect.
August 10th - US-China tariff relief expires.
Was this really mutual or just a game of chicken?
There’s an argument to be made that this is more of a tactical pause than a full reconciliation. With China’s GDP in purchasing power parity terms now surpassing that of the US, and its continued technological advancements across sectors like aerospace, semiconductors, and critical minerals, the balance of economic leverage is shifting. For investors, this isn’t just about tariffs—it’s about the evolving structure of global trade.
Geopolitical undercurrents continue to shape the backdrop. China’s strategic influence in regional security, technology supply chains, and commodity access adds another layer to its negotiating position. Recent developments—such as China's reassertion of dominance in strategic corridors and growing control over key mineral exports—suggest its economic posture is becoming more assertive. This, in turn, has implications for US firms dependent on Chinese inputs or facing retaliatory restrictions.
In short, the 90-day window presents a tactical opportunity, but the structural story remains complex. Investors would be wise to monitor not just tariff updates, but broader shifts in trade alliances, export controls, and supply chain vulnerabilities—especially in sectors like tech, energy, and defense-adjacent industries.
ES Futures:
ES Futures and risk on assets are positive across the board following this announcement.
Key Levels:
Key LVN/ Key LIS: 5861-5837.25
200 Day MA: 5872.99
0.786 Fib Retracement level: 5921.75
0.618 Fib Retracement level: 5688.75
pWkHi: 5741
mCVAL 2025: 5639.75
Expectations for the week ahead:
US CPI and Retail Sales data on the docket this week along with slew of FED speakers.
Scenario 1: Risk on
ES Futures get back above 200-day moving average clearing the key LVN resistance zone and our key LIS, head towards 0.786 Fib retracement level before pulling back and consolidating for the remainder of the week.
Example trade:
Entry: 5861
Stop: 5837
Target: 5921.75
Risk: 96 ticks
Reward: 243 ticks
Risk/Reward ratio: 2.5 R
Scenario 2: Further consolidation
Markets consolidate below the key LVN resistance zone and prior weekly high.
Example Trade:
Entry: 5837
Stop: 5861
Target: 5741
Risk: 96 ticks
Reward: 384 ticks
Risk/Reward ratio: 4 R
Glossary:
VA: Value Area
VPOC: Volume Point of Control
VAL: Value Area Low
C: Composite (used as a prefix: VA, VAL, VAH, VPOC, etc.)
mC: micro Composite (used as a prefix: mCVA, mCVAL, etc.)
LNV: Low Volume Node
LIS: Line in Sand
Important Notes:
These are example trade ideas not intended to be a recommendation to trade, and traders are encouraged to do their own analysis and preparation before entering any positions.
Stop losses are not guaranteed to trigger at specified levels, and actual losses may exceed predetermined stop levels.
