E mini Nasdaq 100. Weekly walkthroughWeekly walkthrough on NQ. Huge gap up and continuation weekly profile towards the Major Buyside Internal Liquidity
Cme!

Gold weekly overview and Outlook for next week
Expecting a push up on gold based on 4H fractals. Internal Ranges suggest bullish price action. Need to see where we are going to open.

Liberation, Altercation & Boom: US China Trade talks CME_MINI:ES1!
Pointing to our previously written blog post (Liberation, Altercation or Doom) on March 31st. A mix of all scenarios played out.
Global universal tariffs with reciprocal tariffs layered on top. It resulted in a huge sell-off on April 2nd.
After months of tit-for-tat tariffs and growing economic friction, the US and China have agreed to hit pause. In a joint statement that’s given markets some breathing room, both countries announced a 90-day suspension on a large portion of their punitive tariffs—an initial step toward dialing back tensions and restarting dialogue.
Key Tariff Measures from US-China Joint Statement (90-Day Pause)
US Tariff Reductions:
Tariffs on Chinese goods were reduced from 145% to 30% for a 90-day period.
24 percentage points suspended, leaving a 10% base tariff in place.
China Tariff Reductions:
Tariffs on US goods reduced from 125% to 10% for the same 90-day period.
China also suspends 24 percentage points of additional ad valorem duties.
Retains a 10% baseline tariff on US imports.
Non-Tariff Measures: China to suspend or remove all non-tariff countermeasures imposed since April 2.
Includes sanctions on certain US companies.
Lifts export controls on some critical minerals.
Timeline & Commitment:
Both parties agree to implement these actions by May 14.
Commitment to continue trade and economic talks through a new bilateral mechanism.
Talks may be held in alternating locations (US/China) or via third-party venues.
No Agreement On:
Currency policy.
E-commerce “de minimis” exemptions.
Sector-specific tariff frameworks.
Future Key Dates and Timeline:
May - Potential US semiconductor tariffs.
May/June - Potential US pharmaceutical tariffs.
July 8th - 90-day tariff lowering for "worst offenders" expires.
July 14th - US tariffs on Mexican agriculture goes into effect.
August 10th - US-China tariff relief expires.
Was this really mutual or just a game of chicken?
There’s an argument to be made that this is more of a tactical pause than a full reconciliation. With China’s GDP in purchasing power parity terms now surpassing that of the US, and its continued technological advancements across sectors like aerospace, semiconductors, and critical minerals, the balance of economic leverage is shifting. For investors, this isn’t just about tariffs—it’s about the evolving structure of global trade.
Geopolitical undercurrents continue to shape the backdrop. China’s strategic influence in regional security, technology supply chains, and commodity access adds another layer to its negotiating position. Recent developments—such as China's reassertion of dominance in strategic corridors and growing control over key mineral exports—suggest its economic posture is becoming more assertive. This, in turn, has implications for US firms dependent on Chinese inputs or facing retaliatory restrictions.
In short, the 90-day window presents a tactical opportunity, but the structural story remains complex. Investors would be wise to monitor not just tariff updates, but broader shifts in trade alliances, export controls, and supply chain vulnerabilities—especially in sectors like tech, energy, and defense-adjacent industries.
ES Futures:
ES Futures and risk on assets are positive across the board following this announcement.
Key Levels:
Key LVN/ Key LIS: 5861-5837.25
200 Day MA: 5872.99
0.786 Fib Retracement level: 5921.75
0.618 Fib Retracement level: 5688.75
pWkHi: 5741
mCVAL 2025: 5639.75
Expectations for the week ahead:
US CPI and Retail Sales data on the docket this week along with slew of FED speakers.
Scenario 1: Risk on
ES Futures get back above 200-day moving average clearing the key LVN resistance zone and our key LIS, head towards 0.786 Fib retracement level before pulling back and consolidating for the remainder of the week.
Example trade:
Entry: 5861
Stop: 5837
Target: 5921.75
Risk: 96 ticks
Reward: 243 ticks
Risk/Reward ratio: 2.5 R
Scenario 2: Further consolidation
Markets consolidate below the key LVN resistance zone and prior weekly high.
Example Trade:
Entry: 5837
Stop: 5861
Target: 5741
Risk: 96 ticks
Reward: 384 ticks
Risk/Reward ratio: 4 R
Glossary:
VA: Value Area
VPOC: Volume Point of Control
VAL: Value Area Low
C: Composite (used as a prefix: VA, VAL, VAH, VPOC, etc.)
mC: micro Composite (used as a prefix: mCVA, mCVAL, etc.)
LNV: Low Volume Node
LIS: Line in Sand
Important Notes:
These are example trade ideas not intended to be a recommendation to trade, and traders are encouraged to do their own analysis and preparation before entering any positions.
Stop losses are not guaranteed to trigger at specified levels, and actual losses may exceed predetermined stop levels.

NQ Outlook for CPI week. CME_MINI:NQ1!
Expecting massive meltdown on Indexes. But need more data to confirm. Neutral at this point. Waiting for more prints.
Gun to my head, I want all out meltdown right from Monday after tagging Monthly FVG C.E

Intraday Playbook ES Futures: Trade Setup & Context CME_MINI:ES1!
Big Picture Context
Please see related trade idea.
In this analysis, we refine our intraday levels to identify potential trade setups. We also review recent price action and present a high-probability long trade example that frequently offers favorable risk-reward dynamics when it plays out successfully.
See chart image below reviewing yesterday’s long trade opportunity.
Example Trade Setup: SFP Long
Time frame: 1 hour or 30 mins
• Entry: 5612
• Stop: 5595.50 (below SFP candle)
• Target: 5682 (mCVAH — confluence with recent highs)
• Risk: 66 ticks
• Reward: 280 ticks
• Risk/Reward Ratio: 4.2 R
Note: Past performance is not indicative of future results.
________________________________________
Intraday Market Structure Review
What has the market done?
• ES Futures have rallied and reclaimed a key technical level.
• Currently trading above:
o March 2025 low
o 2025 mid-year level
o Developing Value Area Low (VAL) for the 2025 Volume Profile
What is the market trying to do?
• Recover prior months' losses.
• Price action is climbing steadily, establishing higher lows.
How well is it doing?
• Despite headline risks, ES futures show resilience.
• Price has painted green candles in the full session for the past 10 consecutive days—a strong bullish structure.
________________________________________
What Is More Likely to Happen from Here?
Scenario 1: Pullback and Continuation Higher
A pullback toward the 0.618 Fib retracement and mCVAH confluence could offer another long setup, targeting the April 2nd high. This is further supported by NQ already reclaiming those highs, with ES still lagging but showing strength.
Example Trade Idea:
Time frame: 1 hour or 30 mins
• Entry: 5688
• Stop: 5680
• Target: 5724 (May 2 High)
• Risk: 32 ticks
• Reward: 144 ticks
• Risk/Reward Ratio: 4.5 R
Target may be adjusted if relative volume and delta support strong momentum toward April 2nd highs.
________________________________________
Scenario 2: Further Consolidation
• Sellers push prices back into last week's balance/value area.
• Market consolidates and builds energy for a likely next leg higher.
• No short setup is presented, as current risk and stop placement do not justify initiating short positions.
Important Notes:
• These are example trade ideas not intended to be a recommendation to trade, and traders are encouraged to do their own analysis and preparation before entering any positions.
• Stop losses are not guaranteed to trigger at specified levels, and actual losses may exceed predetermined stop levels.

NQ weekly review and Outlook. FOMC week CME_MINI:NQ1!
Expecting buyside expansion on NQ. Lets see how we react in here.

NQ1! High Resistance Liquidity Run Market ProfileCME_MINI:NQ1!
Wanted to short NQ for daily FVG . Unable to get the draw after the displacement. Took two stops and stayed side lines for the rest of the day

ES Futures: Upcoming Mag 7 Earnings and NFP Report
This week, although there was not much market-moving macro newsflow over the weekend, we are approaching month-end. In addition, several key catalysts are on the horizon, including earnings from the Magnificent 7 and the release of Non-Farm Payrolls (NFP) data, which typically arrives on the first Friday of the month.
The Federal Reserve is currently in its blackout period ahead of the interest rate decision scheduled for May 7th, 2025.
As part of our process, we will be reviewing technical levels and drawing a plan based on current market structure. ES futures are currently trading above the March 2025 lows. A “death cross” — where the 50-day moving average crosses below the 200-day moving average on the daily timeframe — was recently observed. This pattern is commonly touted by analysts as a bear market indicator.
However, in a macro-driven environment, this could potentially be a false signal.
Key Levels:
• mCVAL: 5622
• Upper Neutral Zone: 5620 -5585
• March 2025 Low: 5533.75
• 2022 CVAH: 5384.75
• Lower Neutral Zone: 5171.75 -5150.75
Our scenarios are as follows:
Scenario 1: Range-bound price action
A P-shaped micro composite profile suggests resistance at our neutral zone. It is labeled neutral because the price is trading above the March 2025 lows. However, if the level above acts as resistance, we expect further range-bound price action. Markets may trade below the mCVAL for further price discovery and potentially establish a new short-term range, with the 2024 lows acting as downside support.
Scenario 2: Mag 7 and NFP as bullish catalysts
Four of the Magnificent 7 companies are reporting earnings this week. The Mag 7 collectively represent around one-third of the S&P 500 index by market capitalization. Microsoft and Meta are scheduled to report on Wednesday after the close, while Amazon and Apple report on Thursday after the close.
On Friday, the NFP data will be released. This could serve as a fundamentally net-positive catalyst for U.S. markets, especially in light of recent shocks that have weakened sentiment.
In this scenario, we will be closely watching our neutral zone and mCVAL as potential areas to initiate long trades.
Glossary Index for all technical terms used:
Blue Zones: Neutral zones.
C: Composite (prefix before VAL, VAH, VPOC, VP, AVP)
mC: micro-Composite (prefix before VAL, VAH, VPOC, VP, AVP)
VAL: Value Area Low
VAH: Value Area High
VP: Volume Profile
CME_MINI:ES1!

BCT CMEWe are have 2 target
1) 86850
2) 83200
Friday close in 4h sibi, I think this Sunday NWOG open price down and looking stops lvl 83.200
We are see below 4h bisi after week vi, I think price need move first this area for create sales candle and after hunt 86.850 above NWOG 7 March
I search buy in this two pd area
Lets see what happen after open exchanges

E-mini S&P 500 Outlook for next week. Thought process is the same just like NQ1!. Want massive buyside expansion. But weekly profiles need to be there. Tuesday/Wednesday Low of the Week is what I' personally looking for.
So expecting an SMT Divergence on the Previous Weekly Sellside . And then a massive push up.
2nd Stage Distribution on Market Maker Buy Model. Offset it is. Crosshairs on 5529

E-mini Nasdaq 100 Weekly Overview & Outlook for next weekIntroduction of Gap Quadrants. Weekly Orderflow Review. Expecting classic Weekly "Power of Three" next week. Along with a SMT Divergence on the lows with ES1!

GBPUSD. Weekly trading levels 14 - 18.04.2025During the week you can trade from these price levels. Finding the entry point into a transaction and its support is up to you, depending on your trading style and the development of the situation. Zones show preferred price ranges WHERE to look for an entry point into a trade.
If you expect any medium-term price movements, then most likely they will start from one of the zones.
Levels are valid for a week, the date is in the title. Next week I will adjust the levels based on new data and publish a new post.
! Please note that brokers have a difference in quotes, take this into account when trading.
The history of level development can be seen in my previous posts. They cannot be edited or deleted. Everything is fair. :)
----------------------------------------------
I don’t play guess the direction (that’s why there are no directional arrows), but zones (levels) are used for trading. We wait for the zone to approach, watch the reaction, and enter the trade.
Levels are drawn based on volumes and data from the CME. They are used as areas of interest for trading. Traded as classic support/resistance levels. We see the reaction to the rebound, we trade the rebound. We see a breakout and continue to trade on a rollback to the level. The worst option is if we revolve around the zone in a flat.
Do not reverse the market at every level; if there is a trend movement, consider it as an opportunity to continue the movement. Until the price has drawn a reversal pattern.
More information in my RU profile.
Don't forget to like Rocket and Subscribe!!! Feedback is very important to me!

ETH/USDTbtc $85k is high liquidation and cme gap zone.
once these tariff headlines slow down bitcoin will be pulled toward these magnet levels

Bitcoin At $250,000 In 2025: Bull-Market Entry (Buy) Zone ActiveBitcoin's 2025 bull-market buy-zone is still active. Actually, Bitcoin is at a great price right now. We are aiming for a target of $250,000 for this cycle. We are looking at the bottom right now, literally. Any buy below $90,000 is extremely good and below $80,000 a dream come-true. This will be obvious in just a matter of weeks.
How are you feeling today?
I hope the start of the weekend is treating you good.
This is a friendly reminder, Bitcoin has been sideways for months. When Bitcoin drops, it drops but, currently, there are no new lows.
Bitcoin peaked in December 2024 and produced a double-top in January 2025. A small retrace and that's it; the accumulation phase is ongoing and the buy-zone active.
There are many signals that support a correction bottom being in. We looked at these already so you will have to trust me. Leverage is possible on this setup. Leverage for a long-term trade. This is the best possible scenario and the best type of trade.
No complexities. No calculators. No fees. No interest, just buy and hold.
Wait patiently... It will be a very strong rise and the Altcoins will grow even more than Bitcoin. The entire Cryptocurrency market will produce maximum growth.
This post is intended to alert of you a great entry-timing. Great prices as well but timing right now is great. We might have to wait a bit longer, it won't move right away, but with this price you can't go wrong.
I am wishing you tons of profits in 2025 and financial success.
Thank you for reading.
If you are new, feel free to follow.
Master Ananda for you (formerly Alan Santana).
Namaste.

Thoughts on US equities. Not looking good at all. Expecting more sellside distribution on US equities. We need to go towards any discount levels

Weekly Outlook and overview of Nasdaq 100Bearish displacement on the weekly timeframe. Weekly Power of Three lined up with strong fundamentals. Tariffs.
Walkthrough of the weekly Price action and outlook for the next week

Liberation, Altercation or Doom? ES Futures weekly planCME_MINI:ES1!
Quick Update
The upcoming week is poised to be critical for financial markets as President Donald Trump's so-called "Liberation Day" on April 2 approaches. On this date, the administration plans to implement new tariffs aimed at reducing the U.S. trade deficit by imposing reciprocal duties on imports from various countries.
As April 2 looms, the full impact of these tariffs remains uncertain, leaving markets and investors in a state of heightened anticipation.
We may get clarity on the tariff situation on April 2, 2025.
Universal tariff announcement of categories of imports may clarify US administration’s maximum tariff escalation approach.
A phased out and unclear tariff approach may keep markets in limbo.
Economic Calendar
Keep an eye on the data docket, NFP and other key releases are due this week.
Tuesday, Apri 1, 2025 : ISM Manufacturing PMI, JOLTS Job Openings
Wednesday April 2, 2025 : ADP Employment Change, Factory Orders MoM
Thursday April 3, 2025 : Balance of Trade, Imports, Exports, ISM Services PMI, Initial Jobless Claims
Friday, April 4, 2025 : Non-Farm Payrolls, Unemployment rate, Average Hourly Earnings MoM,Average Hourly Earnings YoY, Fed Chair Powell Speech
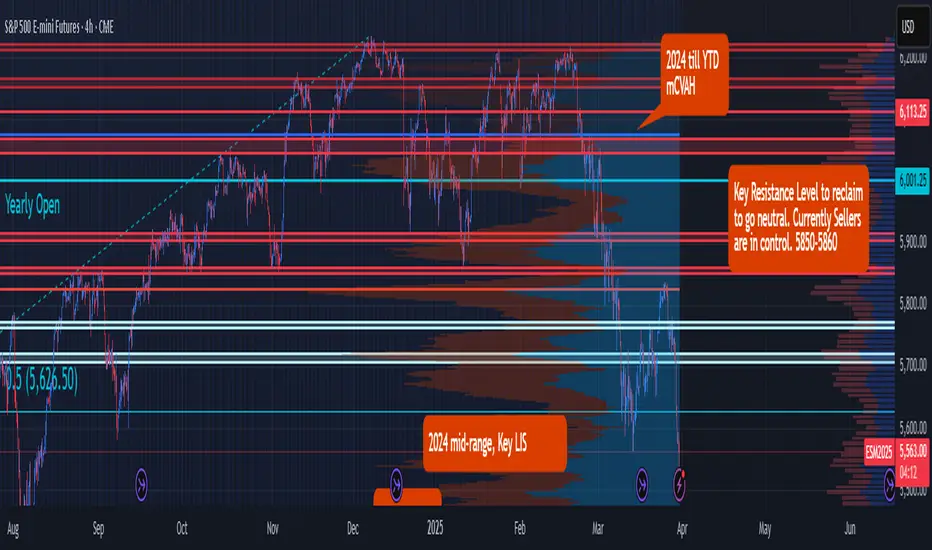
Key Levels to Watch:
Yearly Open 2025 : 6001.25
Key Resistance : 5850- 5860
LVN : 5770 -5760
Neutral Zone : 5705-5720
Key LIS Mid Range 2024 : 5626.50
2024-YTD mCVAL : 5381
2022 CVAH : 5349.75
August 5th, 2024 Low : 5306.75
Scenario 1: Bold but Strategic Tariffs (Effective Use of Tariff to reduce trade deficit and raise revenue) : In this scenario, we may see relief rally in ES futures, price reclaiming 2024 mid-range with a move higher towards key resistance level.
Scenario 2: Maximum pressure, maximum tariff (All out trade war) : In this scenario, we anticipate a sell-off with major support levels, such as 2024- YTD mCVAL, 2022 CVAH and August 5th, 2024 low as immediate downside targets.
Scenario 3: Further delays in Tariff policy (A negotiating tool, with looming uncertainty) : In this scenario, sellers remain in control and uncertainty persists, while we anticipate that rallies may be sold, market price action may remain choppy and range bound.
ES Draw for next weekExpect onesided meltdown on ES. Upcoming week is going to be massively liquid. Try to position less compare to your original postitions

NQ weekly walkthrough and outlook for the next weekExpecting onesided displacement on NQ towards the sellside. Also we have NFP week.

Weekly outlook on GoldExpecting all out displacement on Gold towards 3211. Massive bullish expansion in place


NQ weekly review and outlook for next weekExpect a buyside run on NQ towards weekly FVG coupled with daily arrays. IRB on the weekly

GOLD 24.03.2025-28.03.2025Expecting a meltdown on GOLD. Weekly retracement profile. Against the overall bullish orderflow. Risky. but thats the thought. I will only hunt for shorts
