Parabolic curve step like formation on ETH"At the end-point of Base3, indicated by the "X" symbol, the stock could double in the shortest period of time", as we can see ETH did more than 140%.
We are in the last stage of this parabolic move, the upcoming CME Futures on February 8th may be a great "sell the news" opportunity.
*Remember about setting a proper stop-loss appropriately to your position!
Cmefutures

Ethereum ST (February 1st 2021)Ethereum/USD (February 1st 2021 through March 2021)
Low: $1,302
High: $3,302
Wanted to come up on another update for Ethereum before the big Chicago Mercantile Exchange futures launches on February 8th.
I think 5 important short term future levels to watch for could be $1,570, $1,901, $2,436, and $2,971-$3,302. I specifically want to see bearish reactions off of those levels, the 1.27 could be important too but maybe not as important as these other fibonacci levels.
I think with the introduction of CME futures for Ethereum, price could get extremely volatile. It may get a glorious pump but it may end in terrible devastation too. Bitcoin's CME futures launch was January 13th 2020, and Bitcoin managed to pump up to mid-February before it took another month to crash. But at that time, things were fundamentally different and Bitcoin had already been in a months-long major downtrend. Ethereum could still be in a major uptrend but if this crash I've been theorizing about comes, it could be far worse than March 2020.
There could be some decent volatility this week before it really starts pumping, but when it gets going it will probably be insane. If a real crash happens after, we could see prices back under $600 for sure. This will be very unpopular, but in my opinion, Ethereum could go back under $100 by the time the bear is done. For now, the market euphoria may only increase more and more.
The red box is my predicted range for Cindicator forecasting this week.
Related ideas attached below:
Thanks for tuning in :) Disclaimer, anyone in the trade needs to do their own due diligence and decide what is right for YOU. My charts can be wrong at any time and it's very important that you have your own strategies and plans in place. I run this channel for my own educational purposes of learning to trade, and I will never be 100% right, so please do not let me confirm any bias for you! (Dangerous to do so, stay safe and remember the basics & rules of risk assessment.) Expect the unexpected and happy trading!


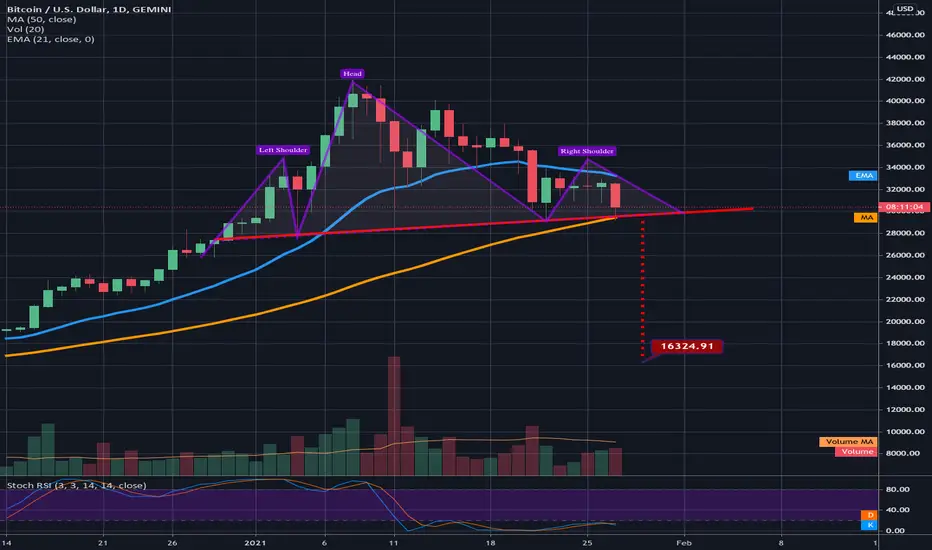
A bigger h&s with an even lower breakdown target appearsWe now have a bigger h&s with a more traditional horizontal neckline in play that if we were to trigger has a breakdown target around the mid 16,000s. Of course we must await confirmation...but this could potentially trigger a very deep correction....one item of bearish onfluence is there is a me futures gap around this range so a correction this deep is not impossible. Currently low probability we would go that far even if we did close candles below this neckline but worth considering all the same. As of now nothing is confirmed and a fakeout is still very possible. As always await confirmation.
5 bearish CME GAPSI wanted to point out there are 5 bearish CME gaps on the Bitcoin chart. These gaps are located around $23360, $18355, $9680, $7580 & $3570.
My opinion about this is that $23360, $18355,$9680 and MAYBE $7580 get filled. This is still possible and BTC could continuing keeping its uptrend on bigger timeframe.
If BTC breaks this uptrend, it will likely go even lower than the $ 3570 bearish gap.

CME BTC Futures - The Story of the Gap Fill Fake OutHere is some fun Chart Art
While everyone has their eyes glued to that CME Gap and believing it will hold for support..
Smart Money understands Market Maker Mentality and can see a few square ups.
Do you know what a square up is? But do you REALLLLYYY know..?

#BTC CME FUTURES 4hrs i think there is a more way to go higher on CME
54855$ is the next resistance on CME

Bitcoin Futures Another Symmetrical TriangleBitcoin CME Futures are so gappy these days because of the high volatility during the weekends, so I decided to write my own script to follow them. This last one is looking like an exhaustion gap after having a breakout gap on lower levels. But currently, there is a symmetrical triangle, which if broken downside we might test the gap support line at 26,645$. However, if broken upside we might try making a double top or just go around 36,000$. I am being very careful with my positions on these levels, I am waiting for confirmation with a candle close or very high volume supporting the break. Let's see if we are finally going to get the retracement that everyone is waiting for.

BTC! CME Futures - when are going to close the gap?What Is a Gap?
A gap is an area discontinuity in a security's chart where its price either rises or falls from the previous day’s close with no trading occurring in between. Gaps are common when news causes market fundamentals to change during hours when markets are typically closed, for instance an earnings call after-hours.
KEY TAKEAWAYS
-A gap is a discontinuous space in the price chart of an asset or security, often occurring between trading hours.
-There four different types of gaps – Common Gaps, Breakaway Gaps, Runaway Gaps, and Exhaustion Gaps - each with its own signal to traders.
-Gaps are easy to spot, but determining the type of gap is much harder to figure out.
What Does A Gap Tell You?
Gaps typically occur when a piece of news or an event causes a flood of buyers or sellers into the security. It results in the price opening significantly higher or lower than the previous day’s closing price. Depending on the kind of gap, it could indicate either the start of a new trend or a reversal of a previous trend.
Gapping occurs when the price of a security or asset opens well above or below the previous day’s close with no trading activity in between. Partial gapping occurs when the opening price is higher or lower than the previous day’s close but within the previous day’s price range. Full gapping occurs when the open is outside of the previous day’s range. Gapping, especially a full gap, shows a strong shift in sentiment occurred overnight.


Bitcoin CME Futures Open with a massive Gap UpI think if BTC appreciates significantly before the next bear market, this gap will be a target. Future reference.
Bitcoin at 25,000 - 27,000? What's next and where is correction?Hello dear friends.
Congratulations to everyone with a very good profit again if you read my previous trading idea carefully.
My friends and I also took a lot of profit from this price movement, and even, purely luck, took an impulse of 1000 profit pips short.
As I knew, check out my trading idea
"Bitcoin - a look into the future"
As you remember, in my previous ideas I wrote, the 16th will change everything - today is the 17th, we have a new peak.
What about positions, purely for me, this growth - it is not adequate, no, not because I expect a decline (we took almost half of this growth)
For me, this growth is not adequate to the fact that:
We have a lot of unclosed gaps
We have too many long positions
For the CME goals (previous) we are above these values, above the monthly values for CME.
As well as growth without a rollback.
And now for the main thing.
If you see that the price is leading to 23850 - and they are trading there for 1 hour - open a long position to achieve new CME targets. (24650-27335)
But now I prefer to work from the short position, since I know what goals, resistance and support levels are.
Plus, the volume falls, several indicators show overbought
And yes, I look forward to the correction.
Namely, up to such values as - 22270 and the most important target is 20550-20730.
Further, from these values, if the price is brought there, I will look at the formations.
Now, as for me, a correction is needed. And therefore, I open a short position - 23450
with goals such as 23000-22680 -22280 - 21880
Stop loss at 23900.
PS If you see that the price will be above 23750, prepare a long position.


Rockin' around the Christmas treeRockin' around the Christmas tree
At the Christmas party hop
Mistletoe hung where you can see
Every couple tries to stop ....
www.youtube.com

BTCUSD on CMEIn CME futures 1H & 4H Chart breaks the trend line.
A very good setup for short position.

CME TARGETS WEEKS /BTCFUTURESRelevant weekly CME targets.
20395-20550
AS WELL AS
17900-17750
With 93% of one of these goals, the price reaches one of them.
You don't need to invent anything - there is a flat (I am working in it now)
For those who do not know how to work in this situation, I write -
Going beyond the border of this channel will show you the way, either update the bottom if the price is below 18500, or top. 19500 - everything between these values - FLAT
By the way, one of my long positions is now at minus 300 points. But I'm not upset, because this is the market.
You see, I look forward to further growth, although I see how everything goes down. Perhaps I became a fan of bitcoin and the number 20,000 is like candy to me.


bitcoin cme gapcurrent price is 19125 $
cme gap at 17810 $
there is no point that bitcoin can fill this gap immediately

Bitcoin - looking into the future)))) - part 2⚡️ I am publishing the final expected CME goals for December and in general for the end of 2020)))
🤑 Upper limit: 22887 - 20937
🤑 Lower limit: 15650 - 13700
🔥 These values give a channel for working within a month and with a probability of 87% (<<<<<-----These are statistics for 2 years) they reach one of the boundaries at the end of the month, to a new expiration of contracts.
💡 The nearest December expiration will be: December 24 (Thursday).
📌 Also on December 24, the expiration of the ANNUAL (12-month) contract will take place.
As for my short position - if I see that the price will be above the level of 19280, there will be trades and creeping on the volume, I will open a long with a stop at 18400.
In the meantime, I see a correction
The first target is taken
Stop loss at 19280.
All profitable trades, and profit for you

CME BTC Chart printing major Bear SignsCME futures are printing major bearish Divergence in the RSI with higher high on price and much lower low on RSI showing weaknes at the top as well as the Stochs getting kicked out of the Bullish trending Zone

BTC-CME Game "Find The Patterns" just for fun...Look thru this BTC CME chart, cleaner than spot charts with no weekend trading...so...
Hints...
Look at Fibs (noted by red arrows)...Golden Pockets at 61.8%-65% Where will the last one take BTC now?
How many " W"'s can you find?
How many "Cup & Handles"
Note the $27K measured move off the Largest "W"
Oh and look at the upward "regression" trend line...BTC just touched to top blue, now where?? Back down to Center Red?
Lesson of the game...BTC will retrace to the Golden Pocket ater "High" is put in...
On spot chart it would be that and the Weekly 21EMA..
Both great price points to Get More BTC

BTC1! CME Bitcoin Futures - GapToday is Monday and as you can see - CME Bitcoin futures created this GAP. Based on history, we have 100% chance, that the gap will be fully or partially filled. There should be a lot of buyers at the horizontal resistance of the triangle. This trade is only a short term quick trade, so there is nothing to be worry about. I expect a pullback to 11 000 - 11 200 USD.
I am not saying we will fill the gap immediately. But it happens rather sooner than later.
Please, hit the like button and follow me for more of these ideas!
Also, check my signature down below ↓
