CMT/BTC LONGSignal
CMT/BTC
BUY
Open 323;
SL 311;
TP 380;
Risk/Reward: 1/4.75
Hey guys!
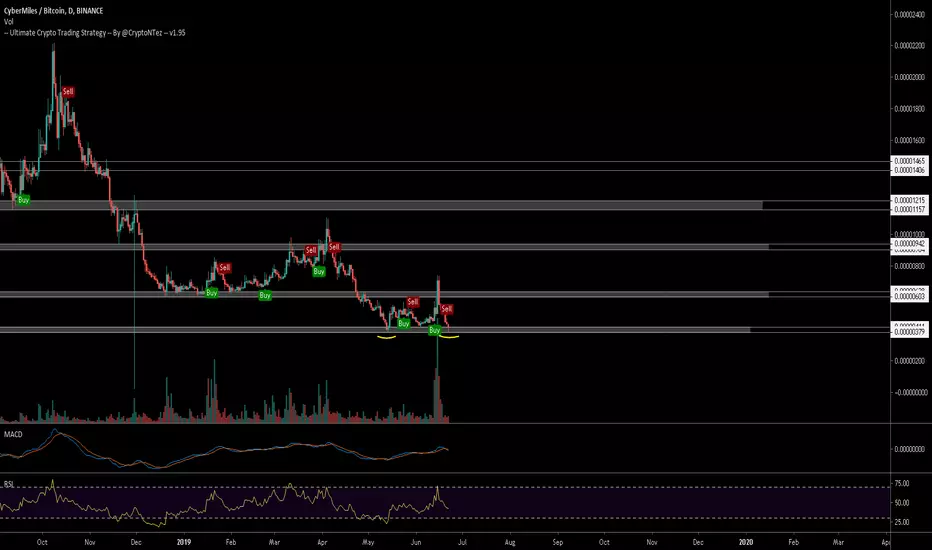
On the chart of this pair, we can see a convergence RSI and AO. Also, we have a downward wedge and a strong resistance level.
CMT


#CMT : Upto 100% Profits Opportunity In The Mid Term.#Accumulatio_Recommendation
Pair : #CMT / #BTC
Trading Platform : #Binance
RSI : 56
TA Notes :
- MACD : Looking bullish on the daily chart.
- RSI : Looking bullish too for the short the short term being in a neutral position form but going to move towards the overbought area in the mean time.
EMA : Already below the price level indicating a good reversal bull trend.
- Volume : Trying to have energy at the current 4H chart and if it gets some more input it will be a good energizing effect for a confirmed reversal break out.
- Candle Stick formation also looks bullish and will be a confirmation if it closes above the falling wedge as it is trading currently and currently forming a bullish engulfing candle stick.
#Accumulation_Zone : 405 sats - 435 sats
Distribution_Zone:
Target 1 : 466 sats
Target 2 : 511 sats
Target 3 : 547 sats
Target 4 : 583 sats
Target 5 : 634 sats
Mid Term Targets
Target 6 : 668 sats
Target 7 : 700 sats
Target 8 : 750 sats+
STOPLOSS : Close below 394 sats
Risk : High
Capital Accumulation : 3%
@TogetherWeAccumulate

CMT BTC Macro AnalysisCMT BTC has an long and wild history and has brought in alot of trading volume recently, sparking at all time lows. The bearish momentum appears to be low due to there being no more descending fibonacci fan trendlines coming down from the all time high. The sine lines and horizonal fibonacci show the periods in time where i expect to see price movement. There is a W shaped reversal pattern on the local timeframe, which may lead me to believe that this alt coin has bottomed out; however i wont be making any trades on this pair until we see some confirmed upwards movement. I will use moving averages analyse the momentum in the short term.
Not an expert, not advice.
Biffy


CyberMiles Starts To Run (1190% PProfits), Can Go Higher!CyberMiles (CMTBTC) is doing some great numbers on Binance. We've seen over 75% growth in the last 12 hours... Here is the chart:
Let's take a look at this chart together, we have some targets for you... and make sure to hit like to show your support.
Let's get started!
We have a high volume break above EMA5 and EMA10, after CMTBTC printed its highest volume candle (accumulation) just three weeks ago.
The above signal is only confirmed when the week closes since we are looking at the weekly chart.
The indicators are also massively bullish with the MACD printing bullish divergence and the RSI trending up strong.
We have over 1,000% (10X) profits potential (PProfits) if CMTBTC reaches its May peak price... This can take time, of course, anywhere between 6-8 months, up to a year+.
So CyberMiles is looking quite bullish on Binance for the long-term, but what happens if something goes wrong?
Conditions for change: If CMTBTC moves down and closes below 0.00000280, the above signals are invalidated.
Thanks a lot for reading.
And thanks a lot for your continued support.
This is Alan Masters.
Namaste.

$CMT at ATL BTC support around 400 sats.$CMT at ATL BTC support around 400 sats.
Wait for bouncing confirmation (Volume..) before taking a position or enter with a tight SL (BTC could do whatever right now)
#CMT
CMTBTC Latest Technical AnalysisWe are doing Analysis of CMTBTC on 1 Day Timeframe.
I have Mention Support and resistance levels on Chart
Note: This is only for Educational Purpose this is not an Investment advice.
Please support the setup with your likes, comments and by following on Trading View.
Thanks
Adil Khan

CMTBTC READY FOR SOME ACTIONCMTBTC READY FOR SOME ACTION
Apossible 30% move to the upside
It has build up a lot of momentum recently

$CMT Flipping resistances at the 6h chart with great volume....$CMT Flipping resistances at the 6h chart with great volume....
Currently flipping 610 sats resistance into support and looking for new leg up into the 700sats...
UCTS Buy signal on the 6hs signaling the trend up (30% from buy entry)
Entry with tight SL below support.
#CMT


CyberMiles/Bitcoin (21 May) #CMT $CMT #BTC $BTC#BUY
CMT is forming a reverse H&S pattern and showing the possibility of price reversal in short-term
Current price : 476
Buyzone : 475
Recommend Sellzone : 525-575-640
Stoploss if price is lower than 450

CMT/BTC, is it a time for the dragon to wake up?Altcoins are going to experience a huge jump if BTC keep the momentum that gained during the last couple of weeks.
CMT is definitely experience one of the worst days ever (Bottom).

There is a possibility for the beginning of an uptrend in CMTETHTechnical analysis:
. CYBERMILES/Ethereum is in a range bound and the beginning of uptrend is expected.
. The price is below the 21-Day WEMA which acts as a dynamic resistance.
. The RSI is at 40.
Trading suggestion:
. There is a possibility of temporary retracement to suggested support zone (0.00019000 to 0.00016400). if so, traders can set orders based on Price Action and expect to reach short-term targets.
Beginning of entry zone (0.00019000)
Ending of entry zone (0.00016400)
Entry signal:
Signal to enter the market occurs when the price comes to " Buy zone " then forms one of the reversal patterns, whether " Bullish Engulfing ", " Hammer " or " Valley " in other words,
NO entry signal when the price comes to the zone BUT after any of the reversal patterns is formed in the zone.
To learn more about " Entry signal " and the special version of our " Price Action " strategy FOLLOW our lessons:
Take Profits:
TP1= @ 0.00022600
TP2= @ 0.00025200
TP3= @ 0.00026700
TP4= @ 0.00033400
TP5= @ 0.00044100
TP6= @ 0.00061400
TP7= Free

cmt 2 target reached if 3rd target - support - sl ...
as i told you cmt started bullish trend
and 2 target reached now.
if 3rd target want to touch it soon this level most be support it
breaking this support can be stop loss
so follow price and keep watch
also maybe 3rd target be 0.0000110 for now

CMT Gaps & S/R #long#CMT have a lot of gaps to fill on the way up, the full green horizontal lines, all other lines are EMA's, MA's, Ichimoku S/R
There is one gap below unfilled at 730 sats, this is where you long.

CyberMiles "Conventional" TR Wyckoff Accumulation EventCMTUSD showing classic Cup and Handle Accumulation model, price in e phase. Mark up phase started, so we waiting for targets: 0.06$ and above.
How to trade it now?!
Enter at retracements looking on 4h or 1h charts.
You can ask if you have questions PM me or in telegram.
CMTBTC levels:


CMT-BTC Long Trade PlanCommodity : CYBERMILES
Trade Type : LONG
Trading Against : BITCOIN
Entries : Double-UP Entries throughout the Buy Zone
Profit Taking : 25% at each TP point. Keeping 25% to run after all TPs are filled
Profit Locking : Move SL to break even once TP1 is hit, to TP1 once TP2 hits, to TP2 once TP3 hits and so on
Duration - 1-4 weeks
Investment in trade : 15% of the total Trading Balance.
Prospective Profit : 8% to 20%
Prospective Loss : 4%
RRR : SL to TP1 is 1.9, SL to TP2 is 2.9 , SL to TP3 is 4.3
Buy Zone/TPs/SL price points are marked in the chart as follows
Greens - Profit Targets (TPs)
Blue - Buy Zone (Entries)
Red - Stop Loss (SL)
