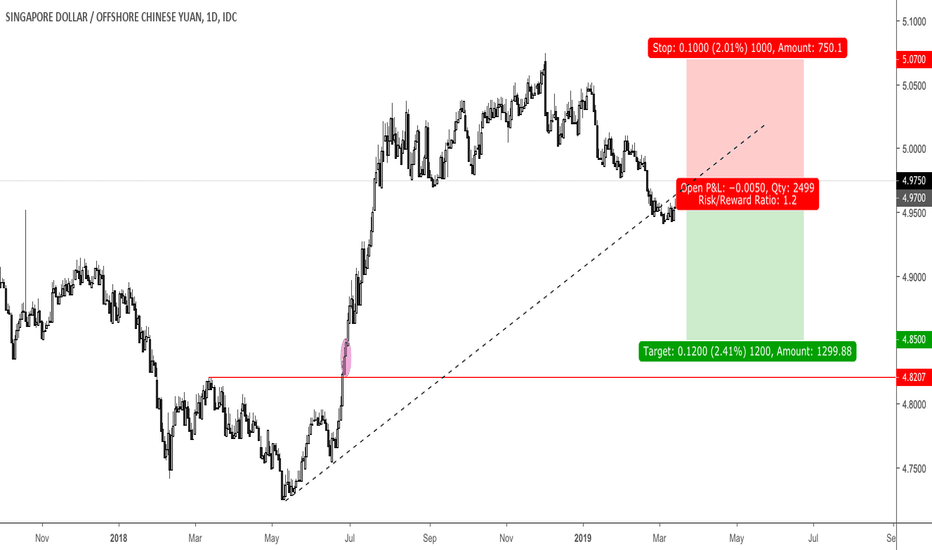
CNH
Year of the Bull? Not according to the fundamentals...With large account deficits, disinflation and widening interest rate differentials there are many reasons to not be bullish China.
Whilst on the political side there is a desperate need to keep CNY stable and stronger because China needs to attract capital inflows for the second half of 2019.
Why?
Because they are trying to facilitate the process of inclusion in equity and bond indexes to make China more attractive for FDI.
Risks to this trade are for deterioration in Chinese macro data and if equity markets sell-off.
Best of luck all and thanks for keeping the support coming with likes, comments, follows and etc.
Buying the dip in USDCNHHere we are getting very close to the moves and trading the initial breakup in this final 5th wave on the large timeframes (see attached: "Adding upside exposure on a correction" for more details on this count).
Dollar strength is coming to our screens, time to position.
Best of luck
NZDCAD about to make new lows (TA and FA)According to the elliot wave theory, FX:NZDCAD . is at its correction phase, and using the fib extension we get T1 for the small ABC wave and T2 for the bigger wave; T1 is short term while T2 is mid/long term
Another thing to keep in mind, is that China is expected to report on Monday that economic growth cooled to its slowest in 28 years and this means that CNH is going down and we all know that CNH is positively correlated to both AUD and NZD.
CHFJPY approaching resistance, potential drop!
CHFJPY is approaching our first resistance at 112.707(horizontal swing high resistance , 76.4% Fibonacci retracement , 61.8% Fibonacci extension ) where we might see a drop in price to our first support at 108.082 (horizontal swing low support, 61.8% Fibonacci retracement. 100% Fabonacci extension ).
Trading CFDs on margin carries high risk.
Losses can exceed the initial investment so please ensure you fully understand the risks.
USDCHN, worth the shotThe pattern is a bit unclear, but because the RR is so great i am taking the risk here. Starting small and increasing on the break of the yellow zone. Think we might make a lower high on the daily, so it could potentially drop a lot coming weeks. Making the RR enormous, which makes it worth the risk for me. I am using the stop loss, but in case we move only slightly higher but start to drop again (false breakout), i will probably short it again when that yellow zone breaks.
USDCNH SELLPrice has formed a strong price action at the top of the pattern and now is forming a continuation pattern to the downside. Watch strong price action at the current price for sell.
Don’t take a trade if you don’t see clearly when big guys are in.
Forex signals premium channel. We made 1048 pips this week. Join us!
t.me
USDCNH. Correction continues. Target 6.73The last sideways consolidation shaped the notorious Triangle pattern in wave B as a junction of waves A and C of this big correction.
The drop could hit the area of 6.73 as market thinks about the deeper retracement lately.
Its all about the uncertainty of US-China relations and players tread the water to take their time.
USDCNHWas that the top in USD/CNH? Traders should not make a living or hobby out of calling major reversals in a market, but when a combination of developments arise that signals the tides may be turning, they also shouldn’t have their head in the sand.
While many people were looking to the sell-off in the Turkish Lira and the South African Rand, the turn around on a development with the funding market in China may turn out to be the real story. In short, the cost to short the Yuan jumped to the highest level since 2016 and early 2017.
With China increasing the cost to borrow the Yuan, a key vehicle to short the currency while restricting Chinese bank’s ability to lend yuan off-shore, traders may be wondering if we’ll see a seven-handle on the USD/CNH anytime in the near future or later. Especially with US Dollar long positions by institutions already stretched.
Adding to the narrative, unsurprisingly on Monday was US President Donald Trump, who had a few words of disappointment for Fed Chairman Jerome Powell ahead of his keynote speech at Jackson Hole on Friday. The following headlines hit my terminal, which aligned with downside pressure on USD/CNH:
USD/CNH 1H Chart: Declining patterns is brokenAfter scoring a new high level last week, the USD/CNH currency exchange rate had declined throughout the second half of the week. During that time various patterns were broken. Because of that reason a review of the pair is conducted.
The pair has revealed a large scale descending speculative pattern, in the borders of which a medum term channel down pattern was located at. Although, on Monday the descending pattern was already broken by a junior scale channel up pattern.
The ascending pattern is most likely just representing the first move in the borders of a new to be discovered medium size pattern.
USD/CNH Shooting star reversal!#USD_CNH just formed #Bearish #ShootingStar reversal candle on the #Weekly timeframe with a long wick that implies for a reversal signal for a wave of short positions coming to drag spot PA from 6.85 to our TP targets and key support levels at 6.70 & 6.58!
While #CNH #Renminbi appreciating against #Greenback , #GOLD #XAU_USD will accelerate to the upside to gain some short-term #Bullish momentum to hover around 1195 & 1205


