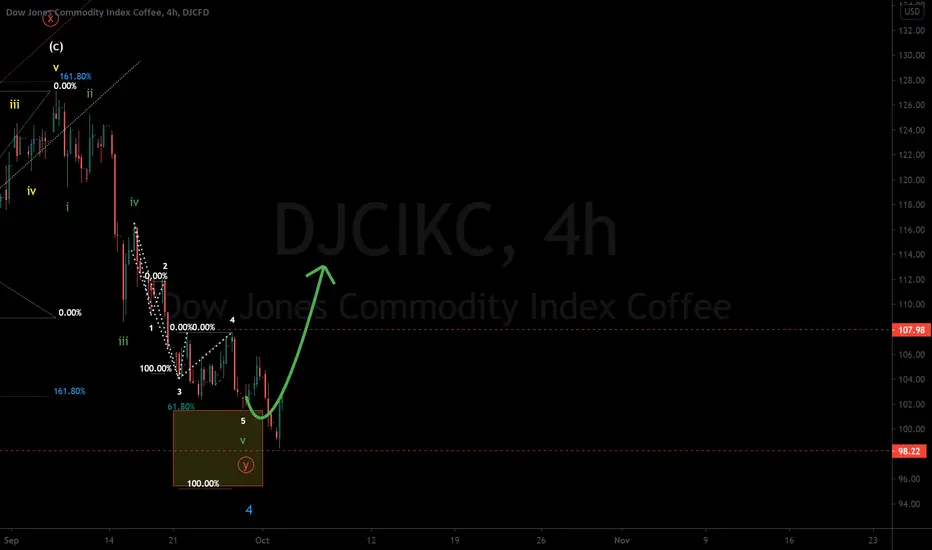
COFFEE - Possible "coffee break" aheadCoffee is back around the price of the beginning of the month.
Since OCT 2 we have a shy uptrend forming for coffee’s standards, in the 4h time frame (TF).
The price went up from its lowest of the current month and $104.90 to $113.35 (+8.04%) on OCT 12 and $111.70 (+6.45%) today so far.
The trend on the Higher TFs is still bearish and technically this is where are now.
We have some indications suggesting that we might be in front of a total reversal for the price of Coffee.
There are:
1) Higher lows since OCT 2
2) at the 4h TF since OCT 9 from the 10 bars 8 of them are above the 50MA
3) we had two major tests (and rejections) for price to break above two week resistance
4) we expect the price to reach at some point soon the monthly Fib 0.382 level
Against the above are the latest data from the COT report of OCT 6 where hedge funds closed 3.207 positions and opened 4.219 bringing the Net Long positions to 47.505 from 54.931 the previous week. Of course we still don’t know what their positions are for the current week.
So what we make out of all this.
To put it in simple terms with what I know so far the longer the price remains above the 50MA the more the chances of it breaking the $112 and move towards the Fib 0.382. The “Decision lvl” is where the two weeks resistance meets the blue trendline. Break it and we buy.
If on the other hand price breaks below the green trend line and the 20MA then we might be looking for more to the down.
Good luck traders
Note: I'm no trading expert nor have the ambition to become one! The above is just an idea that I share with the intention of attracting comments and perhaps become a better trader.
Coffee

COFFEE FUTURE : POTENTIALLY SOMETHING BIG TO COMEENGLISH
- Prices have been evolving below a bearish trendline, registering lower highs but no significant new market bottoms since May 2011. The long-term trend is then neutral.
- However, even though prices have still been consolidating laterally over the last year, they also managed to clear their bearish trendline by successfully rebounding multiple times over the 87.00/103.75 zone, registering what looks like a reversal rounding bottom pattern . In addition, volumes have been on the rise during all the testing phase of the support zone while the DMI shows an increasing bullish pressure inside a more and more directional movement.
- It is still hard to talk about a strong bullish reversal here as the market hasn’t registered any new highs. However, this year’s bullish breakout tells us the bearish trend is now over while positive signs on technical indicators (transaction volumes and DMI) demonstrate buyers ‘interest for the asset. It seems the slow dance around the strong psychological and technical level of 100.00 has been an opportunity for bull traders to try to regain control of the market. In this configuration, the bullish scenario remains the most likely but a market close below the 103.75/95.00 zone would invalidate or, at least, delay the bullish potential towards 140.00, 172.00, 198.00 and 224.00 by extension.
NB : Coffee has been overperforming the Bloomberg Commodity Index since October 2019
________________________________________________________________________________________________________________________________
FRENCH
- Les prix ont évolué sous une ligne de tendance baissière, enregistrant des sommets de plus en plus bas mais aucun nouveau creux de marché significatif depuis mai 2011. La tendance long-terme est donc neutre.
- Cependant, même si les prix ont consolidé latéralement au cours des dernières années, ils ont également réussi à s’affranchir de leur ligne de tendance baissière de long-terme en rebondissant à de multiples reprises au-dessus de la zone 87.00/103.75, en s’inscrivant dans ce qui semble être une figure haussière de creux en soucoupe. De plus, les volumes ont été en hausse durant toute la phase de test de la zone support alors que le DMI affiche une pression acheteuse grandissante au sein d’un mouvement de plus en plus directionnel.
- Il est toujours compliqué de parler d’un fort renversement à la hausse alors que le marché n’a toujours pas effectué de plus haut significatif. Cependant, le franchissement technique de cette année nous confirme que la tendance baissière de long-terme est désormais terminée alors que les signes positifs rapportés par les indicateurs techniques (volumes de transaction et DMI) nous démontrent un regain d’intérêt des acheteurs pour l’actif. Il semblerait que la lente dance des prix autour du niveaux technique et psychologique fort des 100.00 a été une opportunité pour les acheteurs de tenter de reprendre le contrôle du marché. Dans cette configuration, le scénario haussier reste le plus probable mais toute clôture de marché en-dessous de la zone 103.75/95.00 invaliderait ou, du moins, diffèrerait le potentiel haussier vers 140.00, 172.00, 198.00 puis 224.00 par extension.
NB : le café superforme l’indice Bloomberg des matières premières depuis Octobre 2019.

COFFEE - Turning the tide ?Coffee after a 3 week structure and battle seems to be making a break towards the Fib 0.382.
The higher time frames still point down.
The ADX indicator shows uptrend but no strength yet (it usually has a delay on that).
The COT of Sep 29 shows a lot of long orders closed (-3745) and more short open (+3065) with net long positions to 54931 compared to 61741 of the week before that.
So hudge funds expect more to the down.
We might have a turn of tide for coffee if this is not a false breakout, at least up to the Fib 0.382 area.
I will start engaging buy orders just after the decision level (green line) is broken to the upside by solid moves, maybe wait for the day to close.
Good luck traders.
Note: I'm no trading expert nor have the ambition to become one! The above is just an idea that I share with the intention of attracting comments and perhaps become a better trader.

COFFEE BREAKOUT LONG|
COFFEE MET SUPPORT.
BROKE OUT OF THE CHANNEL.
RETESTED.THUS LONG.
Like and Subscribe, guys!


Starbucks Swing Starbucks sitting at my support zone at 83 could see a drop down to 73 if we break below 79. theres a gap down at 79.15 that we could fill within these next few weeks or we could just keep pushing during winter. With winter coming up i see SBUX going up to 95 by December. SBUX has been bullish during the past winter seasons and we could see the same for this year. Pumpkin spice lattes and more coming soon!

COFFEE FUTURES - Wake up and smell the coffeeCOFFEE holded the support area of ~109.20-109.50 and made a pullback breaking the trendline (marked green on chart).
However the bulls seem to be sleepy so I believe the trend continues to be bearish and we have to monitor how price will react to make our decision.
Personally I'm considering a short position around the area marked on the chart.
Potential profit to blue line which is the next support area.
So as mentioned on the chart we monitor price and have our finger on the trigger.
Good luck traders.
Note: I'm no trading expert nor have the ambition to become one! The above is just an idea that I share with the intention of attracting comments and perhaps become better at trading commodities.


The decline is not done yet. ExplainedCoffee reached our target at 120. However, there is still no signal the decline is done and we want to follow the trend. The support is broken and it makes me believe there is a big chance we can see a retest of important support/resistance near 104. So, if you still hold your shorts, consider adding trailing stops and let the good time roll.

Trend change is coming. Potential entries and targetsThe COT report is bearish, the seasonal tendency is to the downside. We have a divergence in the 4h chart. So, where do we sell? I think breaking below Thursday's low or formation of lower high would be good entries. 120 has been an important level for Coffee. It has to be tested again and it is our swing target.

COFFEE - Short (again)I was stopped out on that last attempt but the technical picture is getting stronger! I have re-entered.
note: this is end of day data, that's why the profit/loss tool is in the particular place it is. Current price as I post this.
This is a scalp, a little less than 2:1 RR
I will most likely be out by that 50% Fib, my fav location. Quick to break even, quick to take profits, loads of Bullishness in this futures contract.
Happy Trading!

Copper Tesla Coffee8.13.20 I reviewed a few markets including copper, Tesla, coffee, and if you equity markets that I am no longer going to follow as I am cleaning up my watchlist. The discussion is mostly about trading dynamics and how to manage losing trades when it's likely they will give you a second chance to exit a trade.

Coffee price goes DOWN
Hi! In my point of view we saw a long side movement, than a breakout. The shooting star appeared in a daily chart and even the confirmation arrived with the next day candle. Even a weakly chart shows a shooting star. Normally since the big top price (289) the things have been changed. Aug and sept are negative months. Oct is the comeback. Even the Corona news getting worst which confirms the turnback. Regarding the rules, evry correction takes at least 3 candles but it can takes 3-6 weeks. So on Monday we will see a price around 115.5 than bouncing back around the 120 area than goes down until 102, maybe 98 than the 6.5 weeks period is over ( the actual month will be October as well) so a new Long will come again.


COFFEE - Short Scalp. I have been discussing this for over a month, the long anyways....price is starting to hit resistance. I think it will break but should retrace before doing so.
This is my trade idea.
Tried some ghost price action...ominous.

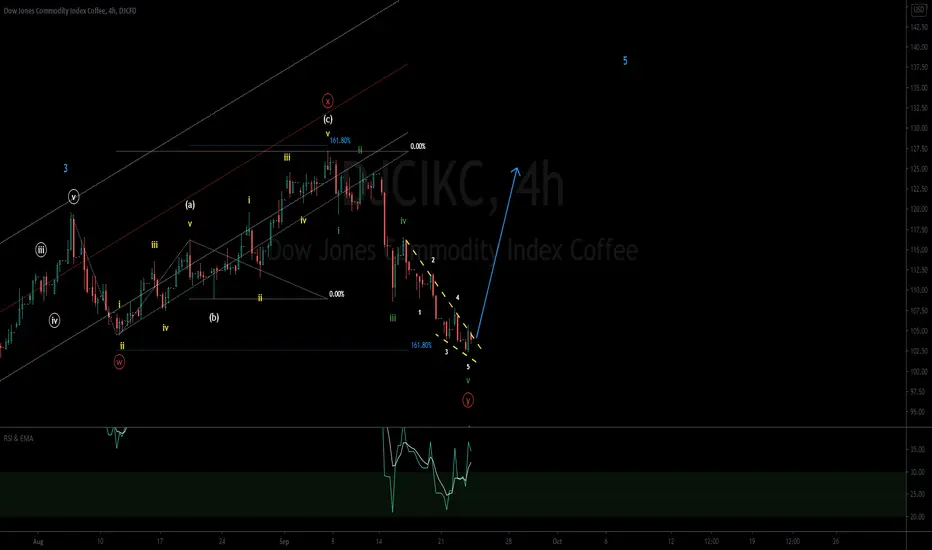
US Coffee futures ( KC1!) - stay short for C wave US Coffee futures ( KC1!) has completed ABC zigzag up side where C wave was extended impulse.
It dropped in wave A in 15 min time frame, so get in to sell trade in B wave near 124.25, with stops above invalidation level above 127.50 for target of C wave down up to 116.50, which is the 4th wave zone of internal wave of C previous wave of Up cycle.


