COFORGE 8100 CE – 29 MAY EXPIntraday to Short-Term Trade Setup (15min/1H)
🟢 Bullish Breakout | Volume Surge Confirmed
🛒 Entry Zone (Buy Above): ₹258–260
🔑 Confirmation on 15min candle close above ₹260 with volume
🎯 Targets:
T1: ₹276
T2: ₹306.50
T3: ₹353.90 (if momentum continues into next session)
🛑 Stop Loss:
SL: ₹230 (on candle close basis for 15min TF)
Conservative SL: ₹240 (if tighter risk appetite)
📊 Indicators Signal:
✅ 9 EMA crossed 26 EMA (momentum confirmation)
✅ RSI at 76.79 – strong, but watch for pullback
✅ BB %B at 0.89 – breakout zone
✅ Clean breakout above resistance (~₹230) with volume spike
✅ Pivot & resistance flip visible on both 15min & 1H TF
For Education Purposes Only
COFORGE

Review and plan for 6th May 2025Nifty future and banknifty future analysis and intraday plan.
Quarterly results.
This video is for information/education purpose only. you are 100% responsible for any actions you take by reading/viewing this post.
please consult your financial advisor before taking any action.
----Vinaykumar hiremath, CMT

$COFORGE: Coforge Ltd. – AI Travel Tech Titan or Overhyped?(1/9)
Good afternoon, everyone! 🌞 NSE:COFORGE : Coforge Ltd. – AI Travel Tech Titan or Overhyped Split?
Coforge snags a $1.56B Sabre deal and a 1:5 stock split—shares spike 10%! Is this IT gem ready to soar or just riding AI hype? Let’s unpack the buzz! 🔍
(2/9) – PRICE PERFORMANCE 📊
• Recent Surge: Shares up 10% post-Sabre deal news 💰
• Stock Split: 1:5 split announced, boosting accessibility 📏
• Sector Trend: IT outsourcing on fire, per X posts 🌟
It’s a hot streak, fueled by big moves! ⚡
(3/9) – MARKET POSITION 📈
• Market Cap: Not specified, but shares soaring 🏆
• Operations: Global IT player, travel tech focus ⏰
• Trend: $1.56B deal lifts travel sector outlook 🎯
Firm, staking its claim in AI-driven IT! 🌐
(4/9) – KEY DEVELOPMENTS 🔑
• Sabre Deal: $1.56B, 13-year AI partnership 🔄
• Revenue Boost: Travel sector growth projected, per analysts 🌍
• Market Reaction: 10% jump, analyst upgrades flying 📋
Scaling up, with AI as the jet fuel! 💡
(5/9) – RISKS IN FOCUS ⚡
• Execution Risk: Big deal, big delivery pressure 🔍
• Hype Factor: AI buzz could overinflate expectations 📉
• Competition: IT giants crowding the space ❄️
High stakes, but risks are real! ⚠️
(6/9) – SWOT: STRENGTHS 💪
• Mega Deal: $1.56B Sabre contract, 13 years locked 🥇
• Travel Tech: Niche expertise shining 📊
• Split Appeal: 1:5 makes it investor-friendly 🔧
Loaded with ammo for growth! 💼
(7/9) – SWOT: WEAKNESSES & OPPORTUNITIES ⚖️
• Weaknesses: Execution hiccups could trip it up 📉
• Opportunities: AI adoption, travel sector boom 📈
Can it deliver or just dazzle? 🤔
(8/9) – 📢Coforge shares up 10%, $1.56B deal in pocket—your take? 🗳️
• Bullish: Skyrocketing on AI wings 🐂
• Neutral: Solid, but watch execution ⚖️
• Bearish: Hype outpaces reality 🐻
Drop your vote below! 👇
(9/9) – FINAL TAKEAWAY 🎯
Coforge’s $1.56B Sabre deal sparks a 10% surge 📈, with a 1:5 split sweetening the pot 🌱. Volatility’s our playground—dips are DCA gems 💰. Snag ‘em cheap, ride the wave! Goldmine or glitter?

COFORGE Options Trading Strategy: Breakout and Momentum-BasedIn this post, we’ll explore a couple of options strategies for COFORGE using the data for strike price 9000 . By closely monitoring the price action and key option data, we can make informed decisions that align with market trends. Here’s how we can approach trading this stock’s options effectively:
Key Option Data Breakdown
Call Short Covering: Indicates that the market sentiment is bullish as traders are closing their call positions, signaling a potential upward movement.
Put Writing: A strong sign of bullishness as traders are actively writing puts, expecting the price to stay above the 9000 strike.
Call and Put LTP (Last Traded Price):
Calls LTP: 278.8 (indicating that calls are gaining traction).
Puts LTP: 100.7 (a lower LTP for puts suggests lower demand).
Open Interest (OI) and Change in OI:
Calls OI Change: -47,850 (indicating a reduction in call positions due to short covering).
Puts OI Change: +123,975 (signifying an increase in put writing, which reinforces the bullish sentiment).
Strategy 1: Buying the Call or Put Based on the First 5-Minute Candle
This strategy involves observing the price movement in the initial 5 minutes after the market opens and deciding whether to buy a call or put, depending on the price action and option data.
When to Buy the Call or Put:
If the first 5-minute candle shows a bullish move, consider buying the call option as the market sentiment appears to be in favor of upward movement.
If the first 5-minute candle shows a bearish move, consider buying the put option. However, given the overall data showing strong put writing, this could be less likely.
Why It Works:
The first 5 minutes are crucial for gauging market sentiment, and with the data indicating strong bullishness (due to call short covering and put writing), a call option is likely to perform well.
Considerations:
This strategy requires watching for clear momentum during the first 5 minutes. If the market remains indecisive, it may be better to stay on the sidelines to avoid wasting premium.
Strategy 2: Breakout Strategy – Buy Calls or Puts on the Break of Highs
This strategy involves waiting for a breakout of the call or put’s high price. The breakout indicates a shift in momentum, and we’ll enter the trade based on whichever direction triggers first.
When to Buy the Call:
Watch for the call’s high price (389.85). If the call option breaks this level, it signals that the upward momentum is gaining strength. Buy the call to capitalize on the breakout.
When to Buy the Put:
If the call option doesn’t break its high and the price starts to show weakness, consider buying the put once it breaks its high (360.6). However, the data suggests that the market bias is bullish, so a call breakout is more likely.
Why It Works:
Breakouts are powerful signals of market momentum. Since the data shows heavy put writing, the call option is more likely to break its high first. This creates an opportunity to buy calls in a bullish trend.
Considerations:
Always monitor the volume and the price action for confirmation of the breakout. If both calls and puts test their highs without clear direction, consider waiting for a clearer signal.
Conclusion:
Given the strong bullish sentiment reflected in the options data—call short covering and put writing—the most reliable strategy is Strategy 2. Watch for a call breakout above 389.85 or a put breakout above 360.6 (if the call fails to break its high). The bullish bias suggests that the call option is more likely to outperform, but a breakout in either direction can trigger the strategy.
Pro-Tip: Set a stop loss just below the breakout level to manage risk effectively. The market sentiment is heavily tilted towards bullishness, so a call option breakout is the most probable outcome.

coforge getting bearishcmp 6845
sl and t1 shown on chart
note : its for educational purpose and not a trading call/tip.

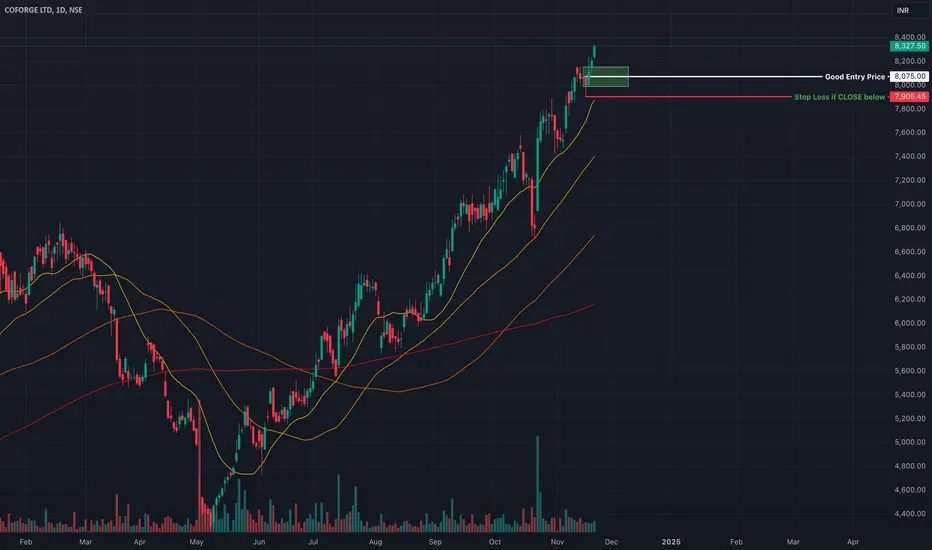
Coforge: Bullish in bear marketThis stock shows very strong trend. Kind of respecting 20SMA and 50SMA.
Trend : Strong Bullish
Trade: Long
SL Price : Recent swing low, 7900.
Entry : 8075.
Target: there is no target. Just trail SL unitl prices closes below recent swing low.
Whenever price bounces back from 20SMA, your can hold with more conviction.
Here risk is about 8075-7900 = Rs.175 per stock.
Aim of 1:3 or 1:5 at least.
For entry you can even target and wait for even better entry level better than 8075.
COFORGENSE:COFORGE
One Can enter now!
Or Wait for a retest of the trendline(BO)!
Or Wait for a better Risk:Reward Ratio!
Note :
1. One should go long with a StopLoss, below the Trendline or the Previous Swing Low.
2. Risk :Reward ratio should be minimum 1:2.
3. Plan your trade as per the Money Mangement and Risk Appetite.
Disclamier : You are responsible for your profits and loss.
The idea shared here is purely for Educational purpose.
Follow back, for more ideas and thier notifications on your email.
Support and Like incase the idea works for you.

Coforge in Consolidation – Awaiting Breakout!➡️ Bullish breakout above ₹7,084.25 (Target ₹7,200+)
➡️ Bearish breakout below ₹6,779.40
➡️ Support levels: ₹6,436.50, ₹5,993.60

COFORGE Gives Brakeout On Daily chartNSE:COFORGE
I am buying this stock
Near 5915
And follow sl on 5150
My target will be 7400
My risk reward ratio is 1:2
Return on capital 22%+

#NIITLTD 113 TGT 130 #Coforge #MIT #FII #DII #stocks #tradingNIITLTD 113
TGT 130
TF < 3M
NSE:NIITLTD
If you like my work KINDLY LIKE SHARE & FOLLOW this page for free Stock Recommendations. With 💚 from Rachit Sethia

My view on Coforge Coforge forming inverse head and shoulder
Looking tgt 5320-5370-5400++
in very short term👆
Keeping on radar Coforge 5300 CE
👆👆

COFORGE : BULLISH PATTERN FORMINGCOFORGE is now at the support level and forming a bullish pattern at the daily time frame also a fundamentally Good pick fell recently because its recent result is not very bad also acquired a new business to expand and grow its sales exponentially and we can expect good upside movement from this level Target and stop loss on the chart.

SWING IDEA - COFORGEIn the ever-evolving tapestry of stock markets, CoForge has emerged as a compelling prospect, hinting at the possibility of a promising rally. The technical landscape paints an intriguing picture, suggesting favorable conditions for a potential swing trade.
Reasons are listed below :
CoForge has undergone multiple tests within the 5800-5900 zone, breaking through and retesting this critical range. The current attempt to resume the upside move indicates a resilient upward momentum.
Notably, CoForge is supported by the 0.382 Fibonacci retracement level, adding a robust layer of support and fortifying the potential for an upward trajectory.
CoForge consistently forms higher highs, a testament to a sustained uptrend and indicative of positive market sentiment.
Trading above both the 50 and 200 exponential moving averages (EMA), CoForge maintains the integrity of its trend, providing confidence in the continuation of the upward movement.
The presence of a bullish marubozu on both daily and weekly timeframes adds a bullish tone to the technical outlook, further reinforcing the potential for a positive price action.
Target : 8404
Stoploss : weekly close below 5987
Disclaimer :
Decisions to buy, sell, hold or trade in securities, commodities and other investments involve risk and are best made based on the advice of qualified financial professionals. Any trading in securities or other investments involves a risk of substantial losses. The practice of "Day Trading" involves particularly high risks and can cause you to lose substantial sums of money. Before undertaking any trading program, you should consult a qualified financial professional. Please consider carefully whether such trading is suitable for you in light of your financial condition and ability to bear financial risks. Under no circumstances shall we be liable for any loss or damage you or anyone else incurs as a result of any trading or investment activity that you or anyone else engages in based on any information or material you receive through TradingView or our services.
@visionary.growth.insights

£INFIBEAM 17 TGT 26 47% Buy Recommended - Rachit SethiaINFIBEAM 17.75
TARGET 26
SL 13
Return 47%
RR > 2
TF < 6 Months
Factors: BULLISH WEDGE BREAKOUT Trend Following Rising Volume with rising Prices. Flag pattern breakout. Pennant Pattern Breakout with Bullish Candle. Retest Successful. Higher Highs & Higher Lows. Broken above RESISTANCE levels Trading at SUPPORT levels Earnings are strong. Bullish Wedge Breakout Risk Return Ratio is healthy. And Rising from Double Bottom Pattern to Flag Pattern forming. If you like my work KINDLY LIKE SHARE & FOLLOW this page for free Stock Recommendations. With 💚 from Rachit Sethia

COFORGENSE:COFORGE
One Can Enter Now !
Or Wait for Retest of the Trendline (BO) !
Or wait For better R:R ratio !
Note :
1.One Can Go long with a Strict SL below the Trendline or Swing Low.
2. R:R ratio should be 1 :2 minimum
3. Plan as per your RISK appetite and Money Management.
Disclaimer : You are responsible for your Profits and loss, Shared for Educational purpose

COFORGENSE:COFORGE
One Can Enter Now ! Or Wait for Retest of the Trendline (BO) Or wait For better R:R ratio
Note :
1.One Can Go long with a Strict SL below the Trendline or Swing Low of Daily Candle.
2. Close, should be good and Clean.
3. R:R ratio should be 1 :2 minimum
4. Plan as per your RISK appetite
Disclaimer : You are responsible for your Profits and loss, Shared for Educational purpose

COFORGE--Consolidation + Bullish ??Observations:
The stock is trending upwards.
Now the stock price is trading near its resistance level, if its continue towards resistance or fall again from this resistance.
we have a trendline support as well. If trendline breaks we have support @4100 level, fake breakdown at trendline may happens here.
after consolidation for 1 month price again moving upwards towards resistance.
Previously a strong fall is observed from 4500 levels.
we have demand zones left @4100, @3950 if price fall below trendline, this will give support.
Keep in the buy side from demand zones.

#PERSISTENT... looking good 17.05.23#PERSISTENT.. ✅▶️
Intraday as well as swing trade
All levels given in charts ...
IF good potential seen then we work in options also
if activate then possible a huge movement Keep eye on this ...
We take trade only when it activates...
Possible to give good target
TRADING FACTS


#COFORGE... Looking good in this level#COFORGE... ✅▶️
Intraday as well as swing trade
All levels given in charts ...
IF good potential seen then we work in options also
if activate then possible a huge movement Keep eye on this ...
We take trade only when it activates...
Possible to give good target
TRADING FACTS

COFORGE - Bullish Consolidation BreakoutNSE: COFORGE is closing with a bullish consolidation breakout candle supported with volumes.
Today's volumes and candlestick formation indicates strong demand and stock should move to previous swing highs in the coming days.
The stock has been moving along the horizontal support for the past few days which is indicating demand.
One can look for a 8% to 12% gain on deployed capital in this swing trade.
The view is to be discarded in the event of the stock breaking previous swing low.
#NSEindia #Trading #StockMarketindia #Tradingview #SwingTrade
Disclaimer:
This is for educational purposes only.

COFORGE Sell for intraday tradingCOFORGE Sell for intraday trading if stock break the given support level...........

NIFTY IT - Recovery started with Double Bottom Breakout Confirm Key highlights: 💡⚡
On basis of Weekly Time Frame
📊 Currently NIFTYIT has given Double Bottom Breakout with confirmation.
📊 Keep an eye on IT sector's scripts.
📊 Example : LTTS , COFORGE , TECHM
1st Target - 32816
2nd Target - 34381
Support - 30559
⚠️ Important: Always maintain your Risk & Reward Ratio.
⚠️ Purely technical based pick.
✅Like and follow to never miss a new idea!✅
Disclaimer: I am not SEBI Registered Advisor. My posts are purely for training and educational purposes.
Eat🍜 Sleep😴 TradingView📈 Repeat 🔁
Happy learning with trading. Cheers!🥂
